Lab-based performance tests often give different results from data that's collected from real users. This article explains the differences between these two ways to measure site speed and how they lead to different test results.
We'll focus on Lighthouse and the Chrome User Experience report, but note that there are many other ways to collect lab or field data.
Example mismatch in PageSpeed Insights
PageSpeed Insights shows both types of data when testing a URL. Field data is shown at the top and lab data below it.
(The overall score at the top of the report is based on lab data.)
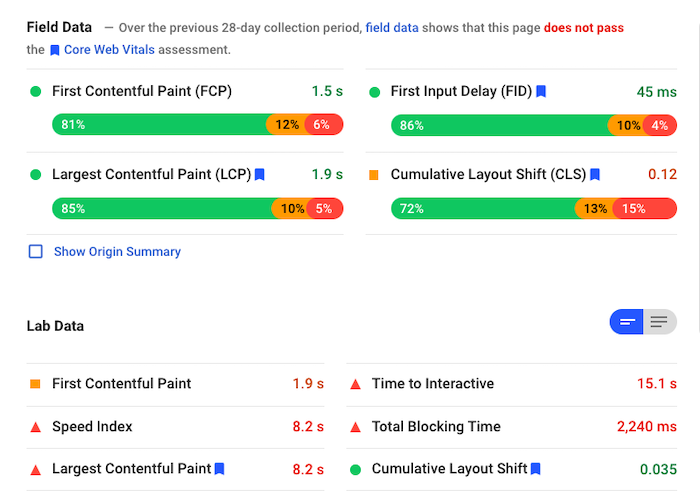
The results of this tests are fairly typical:
- Largest Contentful Paint is much worse in the lab (8.2 s) than in the field (1.9 s)
- Cumulative Layout Shift is worse in the field (0.12) than in the lab (0.04)
First Input Delay is a field-only metric, lab data instead shows Total Blocking Time.
2024 Update: Interaction to Next Paint (INP) has now replaced First Input Delay (FID) as a Core Web Vital.
Why does lab data in Lighthouse and PageSpeed Insights not match field data?
Lab data reports how a website behaves in a controlled test environment, for example using a certain network speed. In contrast, real user data is aggregates experiences from many different users. The website may load fast for some users (for example those with a fast network, located close to the website servers) and slow for others.
Lighthouse uses a fairly slow test device by default, so typically the lab metrics are worse than the real user data. It doesn't try to describe a typical user experience, but rather shows how the slowest 5% - 10% experience your website.
How does Lighthouse collect lab data?
Lighthouse is the tool PageSpeed Insights uses to collect lab data. It can run tests on demand in a test environment using a fixed network and CPU speed.
Because of this, lab data is a great way to identify how changes on a website impact its performance. As the environment is fixed, results between different test runs are relatively consistent.
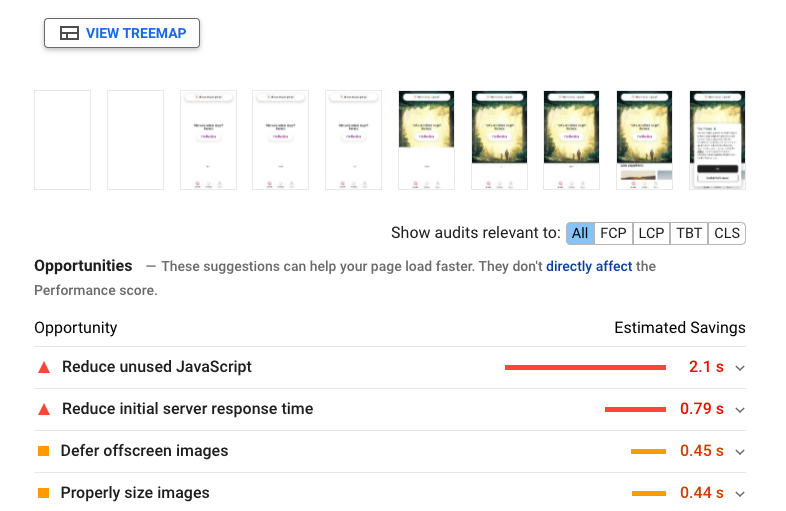
The lab environment is also able to capture detailed diagnostic data. Everything you see on PageSpeed Insights below the metric summary comes from the Lighthouse test.
How is field data collected for the Chrome User Experience Report (CrUX)?
Field data is collected by measuring the experience of real users. Google collects data on Core Web Vitals through Chrome and publishes it in the Chrome User Experience Report (CrUX).
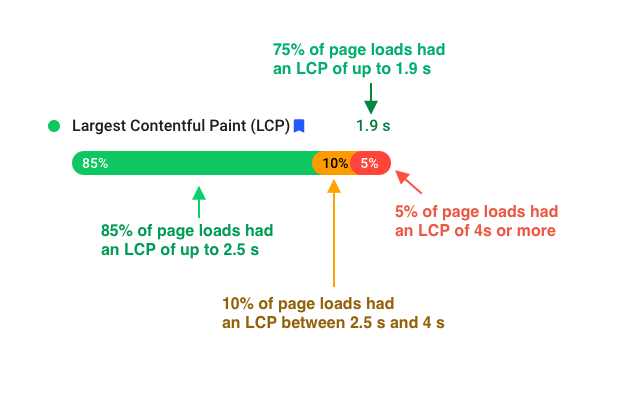
Real-user data aggregates the experiences of many different users, collecting data from different locations, devices, and networks. The result is a distribution of experiences.
Google focusses on the 75th percentile of experiences. In the example above, that means that in 75% of cases the Largest Contentful Paint took up to 1.9 seconds. Conversely, 25% of the time it took more than 1.9 seconds.
Google aggregates field data over a 28-day window, so changes to your website won't be reflected immediately. Often multiple URLs are grouped together, so the metrics you see in PageSpeed Insights are not necessarily for that particular URL.
What causes metric discrepancies between lab and field data?
Lab metrics are different from real user data because real users:
- Have faster or slower network connections
- Visit websites repeatedly and benefit from caching
- Have a faster or slower CPU in their device
- Interact with the page after the initial load
- Access your site from many different locations
Different network environments
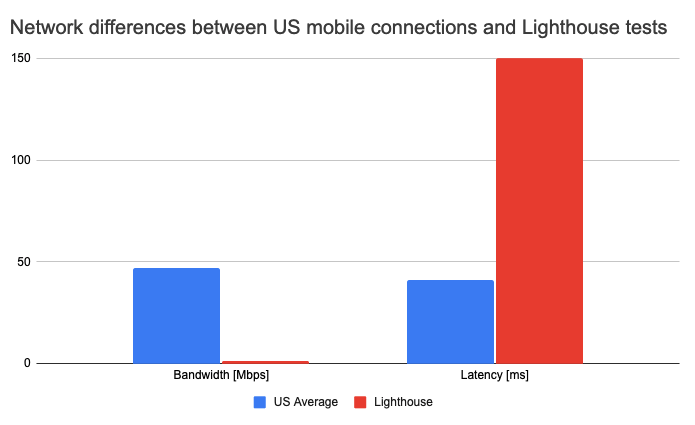
By default, Lighthouse tests on mobile are run using a network connection with a bandwidth of 1.6 Mbps and a latency of 150 ms. That means each request to a server without an existing connection will take at least 600 ms, and the maximum download speed is 200 KB/s.
These default settings are very slow. Average mobile download speed in the US is around 41 Mbps, with a latency of 47 milliseconds. When you compare the Lighthouse test result to real users in the US you'll see a big difference.
The different network environments often explain most of the differences in Largest Contentful Paint.
Different CPU speeds
While network differences are the main source of discrepancies between lab and field data, CPU speeds also differ. Lighthouse tests are run on powerful desktop machine or server, so Lighthouse throttles the CPU by a factor of 4 to approximate a mobile CPU.
This difference can impact Largest Contentful Paint and Interaction to Next Paint.
Caching
Lighthouse always tests a cold load where the user has never visited the page before. Accordingly, all resources used on the page need to be downloaded.
In contrast, real users often navigate from one page to the other, or visit the same website multiple times. For the first visit they need to download all resources used on the page. But for the second visit, many of those resources are saved in the browser cache and don't have to be fetched again.
Because some resources are cached, the load experience and Largest Contentful Paint will be better for the subsequent page visits. This will mostly improve the Largest Contentful Paint metric.
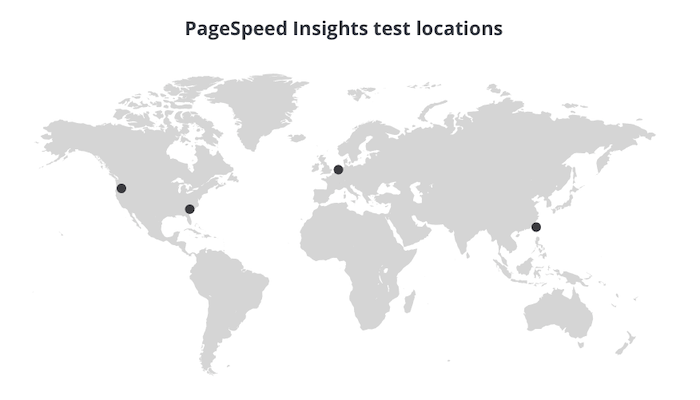
Test location
Lab-based data is based on a test result from a specific geographic location. In contrast, the field data on PageSpeed Insights aggregates the experience users had globally.
For example, if your server is based in the US, the lab data might look good. But if a significant percentage of your customers are based in Australia, then the real user metrics will look worse.
PageSpeed Insights runs tests in one of four different locations based on where you as the user are located.
Simulated throttling
Lighthouse runs tests in Chrome on a fast connection, then simulates how the page would have loaded on a slower connection. This process can introduce inaccuracies.
Sometimes simulated throttling result in a better Largest Contentful Paint than what real users experience. Often this indicates a particular browser behavior that is not accurately modelled in the simulation. Here are some examples where this can happen:
- Your site has many preload tags, making resource prioritization worse
- Extended Validation certificates causing OCSP requests when loading the document
- Single slow XHR/Fetch requests (or a small number of them)
Scrolling down the page
Lighthouse tests load the page, but unlike real users Lighthouse always waits patiently for the page to finish loading instead of starting to scroll down.
This commonly affects Cumulative Layout Shift. The top of your page might be fine, but there may be CLS issues further down the page. For example, a user on a slow connection might scroll down the page and run into images that are still loading. When the images finally load the rest of the page content may shift down.
Other user interactions
Lighthouse also doesn't use any interactive parts of your page, like forms and buttons. Real users therefore experience aspects of the page that are hidden from the simple lab test.
This is especially common with single-page apps, where users may interact with a page for hours. Largest Contentful Paint does not update once the user starts clicking or scrolling down the page. However, Cumulative Layout Shift does update if there is a larger shift later on.
A bad Lighthouse score doesn't always mean poor performance
Ultimately what matters is how fast your website is for real users. But sometimes you'll get a poor Lighthouse score even though your website provides a good experience.
In those cases you can ignore the Lighthouse Performance score and just go based on the real user data.
Final notes
This article referred to Lighthouse as used in PageSpeed Insights. However, note that it's possible to run Lighthouse with different settings for bandwidth, latency, and CPU throttling. It's also possible to run Lighthouse with alternative throttling methods that provide more accurate data.
Keep in mind that, even if 75% of users have a good experience, that still leaves 25% whose experience may be very poor. Lab data collected on a slower-than-average device and network may be able to highlight opportunities for improvement.
Field data is also subject to some amount of drift over time, as your audience changes, or as your audience start using better devices and network connections. Lab data in contrast keeps these values fixed, making it easier to compare test results over longer periods.
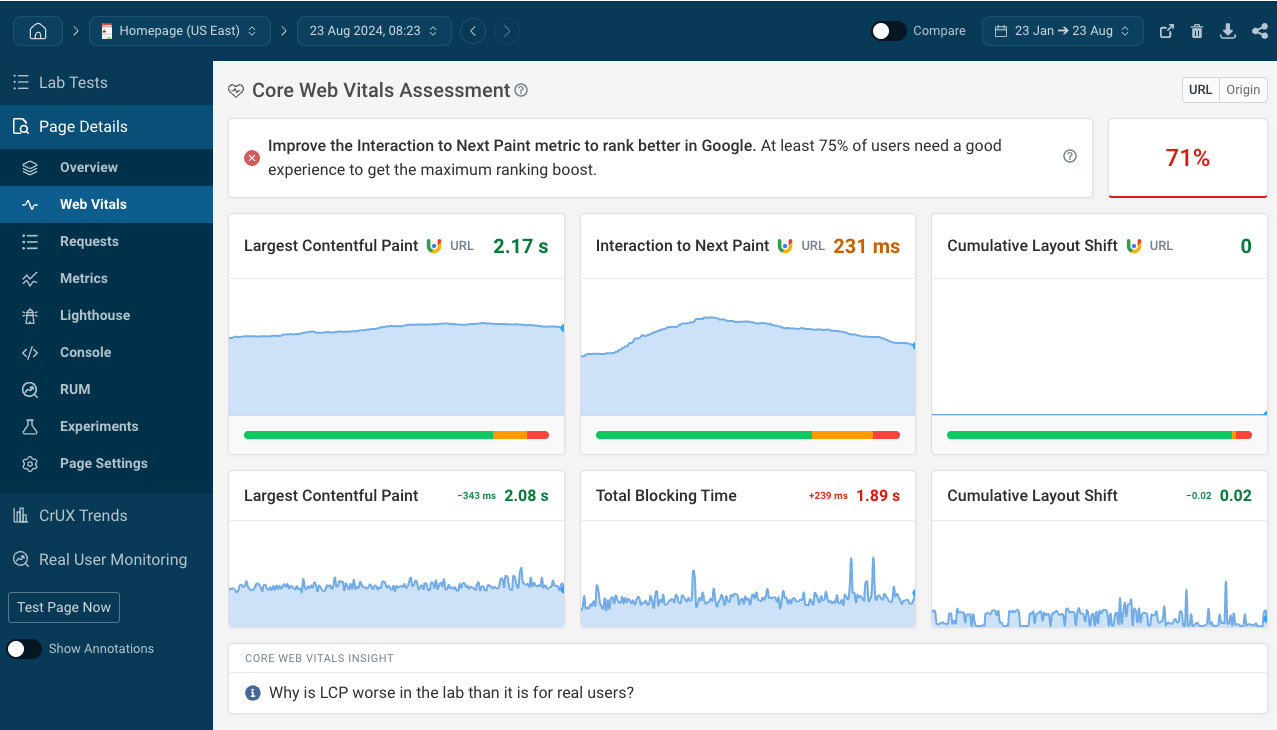
Lighthouse and CrUX data in DebugBear
DebugBear monitors the performance of your website in the lab, but the Web Vitals tab also shows field data from the Chrome User Experience Report.
Try DebugBear to track and optimize your site speed.


Monitor Page Speed & Core Web Vitals
DebugBear monitoring includes:
- In-depth Page Speed Reports
- Automated Recommendations
- Real User Analytics Data