Google will start using Core Web Vitals as part of their rankings in May 2021. This page goes through common questions about Core Web Vitals and how they affect rankings.
All answers to the FAQs are based on what John Mueller has said in the official Google Search Central office hours. Update: Answers from this Web Vitals Q&A are now also included.
The quotes in this article have been edited to make them easier to read and are not always direct quotes from the videos. Each answer links to the original video where the question was answered.
- Does Google use field data or lab data for rankings?
- How does Google determine the Core Web Vitals scores of a page?
- Why am I seeing different scores reported in different tools, such as Lighthouse and the Chrome User Experience Report?
- What are Web Vitals? What is the difference between Web Vitals and Core Web Vitals?
- How much real-user data is needed to be included in the CrUX dataset?
- Is the page experience ranking boost per country?
- Do Google rankings only use data for a specific page, or a combination of page and origin level data?
- Is page experience a binary ranking factor, or is there a gradation?
- How much will Web Vitals impact rankings?
- What if a metric doesn't accurately reflect page experience?
- Google currently aggregates 28 days of CrUX data. Could Google update Web Vitals data more quickly?
- How often is Web Vitals data updated?
- Do the ranking changes apply to both mobile and desktop?
- How does Google group pages?
- Is performance data shared between subdomains?
- Do noindex pages affect Web Vitals?
- Do pages that are behind login impact Web Vitals?
- Why does Google Search Console show big fluctuations in Web Vitals?
- Is the yellow "needs improvement" rating good enough to rank well, or does the rating need to be "good"?
- Why are AMP and non-AMP pages sometimes shown separately?
- Why do I see different values for the Web Vitals in CrUX and PageSpeed Insights?
Other Web Vitals FAQs:
Does Google use field data or lab data for rankings?
We use the field data, which is based on what users actually see. So it's based on their location, their connections, their devices. That's usually something that mirrors a lot closer what your normal audience would see.
You can read more about field vs lab data here.
How does Google determine the Core Web Vitals scores of a page?
The scores represent the 75th percentile of Google's field data, meaning 25% of users have a better experience than stated, and 25% have a worse experience.
We measure the the three Core Web Vitals in Chrome [...] for every page load. And then we take the 75th percentile of each of those separately. So if your 75th percentile of all your page loads meets Largest Contentful Paint's 2,500 millisecond threshold then your page meets Largest Contentful Paint. [...]
] And then either it meets the third threshold [for First Input Delay] or, since not every page has input, it doesn't have enough samples. [...]
[Meeting the Web Vitals means that] three out of four [visitors are going to be having a good experience.
Why am I seeing different scores reported in different tools, such as Lighthouse and the Chrome User Experience Report?
Metric discrepancies across tools are super common problem.
There's a lot to tease apart here, I'll take a stab at a few of the key points.
One of the first ones is that we have two fundamentally different sources of data here that we're dealing with. So we have our field data, which is [...] used for Core Web Vitals, this is "what are your real users experiencing?", this is people who are engaging with your content, and you are getting signals back from them as to how good their experience is.
But you need a way to debug and diagnose that before your user is engaging with that content. And so you want to have some more control and some more granular data there. And that's where simulated data comes in also called lab data.
So that's the first key point is that there are two different data sources. And so you're going to see different, you're going to see different values, because one is representing all of your users. And then the other is representing a simulated load.
The second point [...] is that there are also different runtime conditions depending on the tool that you're looking at. So for instance, if you're accessing lighthouse in the DevTools panel, then you are going to be operating locally on your own machine, it's going to represent conditions that are local to you. Whereas if you're using PSI (PageSpeed Insights), you are pinging servers and getting that response back. So there are going to be deltas there as well.
Philip Walton also highlights the importance of the difference between lab and field data.
Lighthouse is a lab based tool, meaning a real user is not interacting with it. It's running in a simulated environment, whereas the Chrome User Experience Report (CrUX) is where the Core Web Vitals data that you'll see in tools like Search Console or PageSpeed Insights is coming from, what we call field data. Sometimes it's called RUM (real-user monitoring) data. It's coming from real users that are actually going to those pages and interacting with them.
What are Web Vitals? What is the difference between Web Vitals and Core Web Vitals?
Web Vitals is the name of the initiative, or the program that we have here in Chrome. That covers everything, the whole Web Vitals program, where vitals is also a term that we use to describe the individual metrics that are part of the Web Vitals program.
The Core Web Vitals specifically are [...] the subset of Web Vitals that we feel like are the most important to measure, and they have to meet certain criteria to be qualified.
- They have to be measurable in the field by real users.
- They they have to be representative of user experience
- They have to generally apply to all web pages
If you are looking for just the minimal amount of things to focus on, the Core Web Vitals are a great place to start.
And then we have other Web Vitals that are often that are good performance metrics to care about. And they are useful in debugging [...] the Core Web Vitals.
For example, Time To First Byte is a Web Vital. And Time To First Byte is often useful in debugging your Largest Contentful Paint, it helps you know whether maybe your server code is slow or your browser code/front-end code is slow.
How much real-user data is needed to be included in the CrUX dataset?
No clear answer here:
At a high level, we just want to make sure that whatever we're actually sharing has reached a certain threshold for [proper anonymization]. That's kind of how we we determine [...] where that threshold is, in terms of what we're actually kind of publishing in the CrUX dataset.
We don't do any capping though. If you have more data than the the minimum sample size, there's just more data being used to calculate the CrUX scores.
Is the page experience ranking boost per country?
If your site is fast in the UK, but slow in Australia, will UK search result get a boost?
It's all Chrome users together. This is a part of the reason why we're using the 75th percentile, so in that example more than a quarter of your customers are in Australia, and they're getting slower times.
Ideally you'd be using a CDN (Content Delivery Network).
Do Google rankings only use data for a specific page, or a combination of page and origin level data?
Google uses page level data when enough data is available, and falls back to page groups or the whole origin if there's not much data.
This is, I think, a source of confusion because a lot of tools will report origin and page level data. I think that can sometimes make it more confusing than it needs to be where people might think that you get like a single score for your entire site. But that's not true, you get a score per page.
In some cases, in some cases, you get a score for page group. If you go into Search Console, you might see page groups that all have kind of a certain score. Depending on how much data the site has, you might then not have enough, it might be all pages in the same origin will be grouped together. [...]
For most of the ranking signals that we have, we don't have like one documentation page that says this is how exactly we use this signal in ranking, because there's just so many edge cases and also situations where we need to have the flexibility to adapt to changes that happen in the ecosystem.
Is page experience a binary ranking factor, or is there a gradation?
Do only pages meeting the "Good" threshold get a ranking boost? Or can site speed optimizations help even if you don't reach that threshold?
In the area from needs improvement to good, that's kind of the range where we would see a gradual improvement with regards to the ranking signal.
Once you've reached that "Good" threshold, then [you're at a] stable point. Micro optimizing things like extra milliseconds here and there, that's not going to do [anything specific to your rankings]. It might have an effect on what users see. And with that, you might have other positive effects. But at least when it comes to search ranking, that's not going to be something where you're going to see improvements would be like five milliseconds faster than the next one.
It is not the case that unless you reach the "Good" threshold for all of the Core Web Vitals metrics [you won't get a metrics boost], like you have to reach that threshold to get a ranking boost, that is not the case.
It's kind of the opposite. Once you reach the mean, you will get a ranking boost for reaching the good threshold for all pages. But beyond that point, you don't get additional boost for reaching an even better [level], like if [you get your LCP] all the way down to one second. [That] will not increase your ranking.
However, if you have a very, very slow page, like maybe LCP is 20 seconds, and you improve it to 10 seconds, that could potentially boost your ranking.
Now we get a lot of [people saying meeting the Core Web Vitals is really hard for them]. Yes, it is. It's supposed to identify the best content on the web, and that you don't really necessarily [...] need to improve beyond that. You might see additional benefits from your users, but we don't take that into account.
How much will Web Vitals impact rankings?
Page Experience will be an additional ranking factor, and Web Vitals will be a part of that.
Relevance is still by far, much more important. So just because your website is faster with regards to Core Web Vitals than some competitors, that doesn't necessarily mean that come May (this has now been postponed to mid-June) you'll jump to position number one in the search results.
It should make sense for us to show this site in the search results. Because as you can imagine, a really fast website might be one that's completely empty. But that's not very useful for users. So it's useful to keep that in mind when it comes to Core Web Vitals.
It is something that users notice, it is something that we will start using for ranking, but it's not going to change everything completely. So it's not going to, like destroy your site or remove it from the index if you have it wrong. It's not going to catapult you from page 10 to number one position, if you get it right.
What if a metric doesn't accurately reflect page experience?
Automated performance metrics try to assess the user experience of a page, but don't always match the experience of real user. Google is working on improving metrics over time – you can find a changelog for the core web vitals here.
John suggests contacting the Chrome team if the browser is misinterpreting the page experience.
I think for things where you feel that the calculations are being done in a way that doesn't make much sense, I would get in touch with the Chrome team. Especially Annie Sullivan is working on improving the Cumulative Layout Shift side of things.
Just make sure that they see these kinds of examples. And if you run across something where you say, oh, it doesn't make any sense at all, then make sure that they know about it.
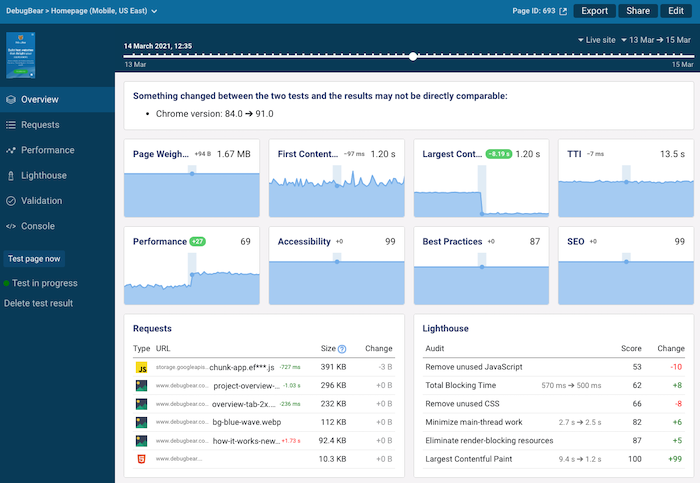
You can see an example of a change in the Largest Contentful Paint definition here. Originally, a background image was dragging down the Performance score of the DebugBear homepage, but this was then fixed in a newer version of Chrome.
You can expect the page experience signals to be continuously updated, with some advance warning.
Our goal with the Core Web Vitals and page experience in general is to update them over time. I think we announced that we wanted to update them maybe once a year, and let people know ahead of time what is happening. So I would expect that to be improved over time.
Google currently aggregates 28 days of CrUX data. Could Google update Web Vitals data more quickly?
After making improvements to a site's performance it can take a while for those changes to be reflected in the Search Console. Can Google speed up the process?
I don't know. I doubt it. The data that we show in Search Console is based on the Chrome User Experience Report data, which is aggregated over those 28 days. So that's that's the primary reason for that delay there.
It's not that Search Console is slow in processing that data or anything like that. The way that the data is collected and aggregated just takes time.
So how can you catch regressions early and track performance improvements?
What I recommend, when people want to know early when something breaks, is to make sure that you run your own tests on your side in parallel for your important pages. And there are a bunch of third party tools that do that for you automatically.
You can also use the PageSpeed Insights API directly. Pick a small sample of your important pages and just test them every day. And that way, you can tell if there are any regressions in any of these setups you made fairly quickly.
Obviously a lab test is not the same as the field data. So there is a bit of a difference there. But if you see that the lab test results are stable for a period of time, and then suddenly they go really weird, then that's a strong indicator that something broke in your layout in your pages somewhere.
DebugBear is one tool you can use to continuously monitor web vitals in a lab environment.
How often is Web Vitals data updated?
The Chrome UX Report is updated daily, aggregating data from the last 28 days. If you make an improvement, after one day you're 1/28th of the way to seeing the results.
What if you fix performance a few days before the page experience ranking update is rolled out?
Probably we would not notice that. If you make a short term change, then probably we would not see that at the first point. But of course, over time, we would see that again. It's not the case that on that one date, we will take the measurement and apply that forever.
If you need a couple more weeks before everything is propagated and looks good for us as well, then, like, take that time and get it right and try to find solutions that work well for that.
The tricky part with the lab and the field data is that you can incrementally work on the lab data and test things out and see what works best. But you still need to get that confirmation from users as well with the field data.
Do the ranking changes apply to both mobile and desktop?
Both mobile and desktop from February 2022.
The rollout first started with mobile in June 2021.
[Mobile is where] the harder barriers are, where users really see things a lot slower than on desktop. Because on desktop, you tend to have a really powerful computer, and you often have a wired connection.
On mobile, you have this much slimmed down processor with less capabilities, and a smaller screen and then a slow connection sometimes. And that's where it's really critical that pages load very fast.
How does Google group pages?
Google doesn't have real user performance data for every page that's in the search index. So how are pages categorized?
We use the Chrome User Experience Report data as the baseline. We try to segment the site into parts, what we can recognize there from the Chrome User Experience Report, which is also reflected in the Search Console report.
Based on those sections, when it comes to specific URLs, we will try to find the most appropriate group to fit that into. So if someone is searching, for example, for AMP pages within your site, and you have a separate AMP section, or you have a separate amp template that we can recognize, then we'll be using those metrics for those pages.
It's not so much that if there's some slow pages on your site, then the whole site will be seen as slow. It's really, for that group of pages where we can assume that when a user goes to that page, their experience will be kind of similar, we will treat that as one group.
So if those are good, then essentially pages that fall into those groups are good.
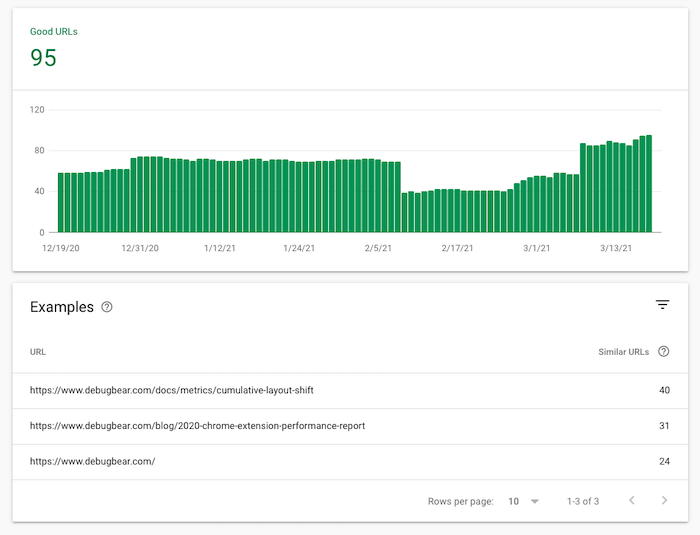
Here's an example of Google Search Console showing different page categories with many similar URLs.
Regarding Accelerated Mobile Pages (AMP), John points out that the AMP report does not take traffic into account. A site where the vast majority of users have a good experience might look slow if there are also a large number of slower pages that are accessed less frequently.
The tricky part with the AMP report is that we show the pages there, but we don't really include information on how much traffic goes to each of those parts.
So it might be that you have, let's say 100 pages that are listed there, and your primary traffic goes to 10 of those pages. Then it could look like you have like those 90% of pages that are slow, and those 10 that people go to are fast. But actually the majority of your people will be going to those fast pages. And we'll take that into account.
Is performance data shared between subdomains?
As far as I recall, the CrUX data is kept on an origin level. So for Chrome, the origin is the hostname, which would be kind of on a sub domain and protocol level. So if you have different subdomains, those would be treated separately.
Do noindex pages affect Web Vitals?
Many websites have slower, more complex pages that are not included in the search index. Will performance on these pages affect rankings?
This depends on whether Google categorizes the pages together with pages that are in the search index. Especially if there's not a lot of other data Google might draw on the performance data collected for the noindex pages.
If it's a smaller website, where we just don't have a lot of signals for the website, then those no index pages could be playing a role there as well. So my understanding, like I'm not 100% sure, is that in the Chrome User Experience Report we do include all kinds of pages that users access.
There's no specific "will this page be indexed like this or not" check that happens there, because the index ability is sometimes quite complex with regards to canonicals and all of that. So it's not trivial to determine, kind of on the Chrome side, if this page will be indexed or not.
It might be the case that if a page has a clear no index that will then we will be able to recognize that in Chrome. But I'm not 100% sure if we actually do that.
Do pages that are behind login impact Web Vitals?
Pages often load additional content and functionality for logged in users. This additional content can slow down the page – will these logged-in pages impact rankings?
If you have the same URL that is publicly accessible as well, then it's it's very likely that we can include that in the aggregate data for Core Web Vitals, kind of on the real user metrics side of things, and then we might be counting that in as well.
If the login page exists in a public forum, that we might think some users are seeing this more complicated page, we would count those metrics.
Whereas if you had separate URLs, and we wouldn't be able to actually index the separate URLs, then that seems like something that we will be able to separate out.
I don't know what exact guidance here is from the Core Web Vitals side, though. I would double check, specifically with regards to Chrome in the CrUX help pages to see how that would play a role in your specific case.
Why does Google Search Console show big fluctuations in Web Vitals?
Why would ratings for a group of pages go up and down repeatedly? What do I do if my page ratings keep switching between green and yellow?
What sometimes happens with these reports is that if a metric is right on the edge between green and yellow.
If for a certain period of time, the measurements tend to be right below the edge, then everything will swap over to yellow and look like oh, green is completely gone. Yellow is completely here. And when those metrics go up a little bit more back into the green, then it's swapped back.
Those small changes can always happen when you make measurements. And to me this kind of fluctuation back and forth, points more towards, well, the measurement is on the edge. The best way to improve this is to provide a bigger nudge in the right direction.
Is the yellow "needs improvement" rating good enough to rank well, or does the rating need to be "good"?
Aim for a "good" rating marked in green:
My understanding is, we see if it's in the green, and then that counts as it's okay or not. So if it's in yellow, that wouldn't be kind of in the green.
But I don't know what the final approach there will be [based on the question above it seems like a full "Green" rating is less important]. Because there are a number of factors that come together. I think the general idea is if we can recognize that a page matches all of these criteria, then we would like to use that appropriately in search for ranking.
I don't know what the approach would be when some things are okay and some things that are not perfectly okay. Like, how that would balance out.
The general guideline is that we would like to use these criteria to also be able to show a badge in the search results, which I think there have been some experiments happening around. For that we really need to know that all of the factors are compliant. So if it's not on HTTPS, then even if the rest is okay that wouldn't be enough.
Why are AMP and non-AMP pages sometimes shown separately?
What if Search Console shows a slow URL on the website, but the AMP version of the page is shown as fast?
We don't focus so much on the theoretical aspect of "this is an AMP page and there's a canonical here". But rather, we focus on the data that we see from actual users that go to these pages.
So that's something where you might see an effect of lots of users going to your website directly, and they're going to the non-AMP URLs, depending on how you have your website set up.
And in search, you have your AMP URLs, then we probably will get enough signals that we track them individually for both of those versions. So on the one hand, people going to search going to the AMP versions and people maybe going to your website directly going to the non-AMP versions. In a case like that we might see information separately from those two versions.
Whereas if you set up your website in a way that you're consistently always working with the AMP version, that maybe all mobile users go to the AMP version of your website, then we can clearly say "this is the primary version – we'll focus all of our signals on that".
But in the theoretical situation that we have data for the non AMP version and data for the AMP version, and we show the AMP version in the search results, then we would use the data for the version that we show in search as the basis for the ranking.
Why do I see different values for the Web Vitals in CrUX and PageSpeed Insights?
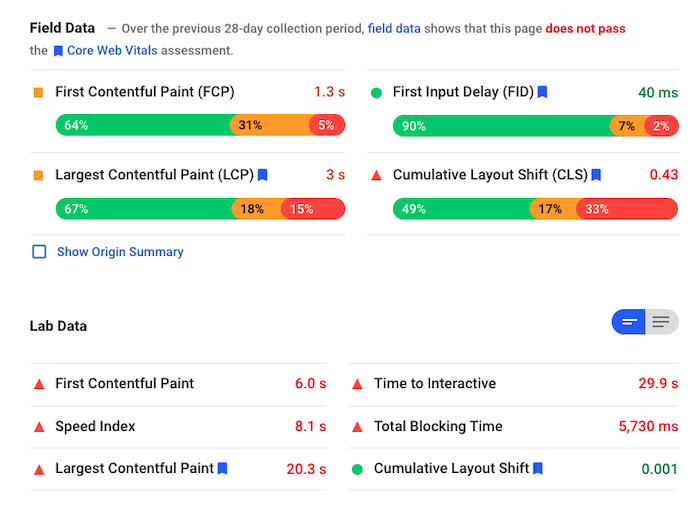
Lab data from PageSpeed Insights will often be different from the field data. Usually the lab data will be slower, as Lighthouse simulates a very slow device with a bandwidth of 1.6Mbps and 150ms of roundtrip network latency.
Here's a typical example from the BBC homepage.
John also notes that PageSpeed Insights tries to compress all performance metrics into a single score:
In PageSpeed Insights we take the various metrics and we try to calculate one single number out of that. Sometimes that's useful to give you a rough overview of what the overall score would be. But it all depends on how strongly you weigh the individual factors.
It can be the case that one user see a page that's pretty fast and sleek, but when our systems test it they find some theoretical problems that could be causing issues.
The overall score is a really good way to get a rough estimate. And the the actual field data is a really good way to see like what people actually see and usually
How do you use lab data and field data together?
What I recommend is using field data as a basis to determine "should I be focusing on improving the speed of the page or not?" Then use lab testing tools to determine the individual metric values and for tweaking them as you're doing the work.
Use lab data to check that you're going in the right direction, because the field data is delayed by about 30 days. So for any changes that you make, the field data is always 30 days behind and if you're unsure if you're going in the right direction then waiting 30 days is kind of annoying.