
Chrome's render-blocking label doesn't always fully illustrate which resources are impacting a page's First Contentful Paint (FCP), Largest Contentful Paint (LCP) or H1-visible metrics. We recently introduced our website bottleneck finder tool to help you find resources on your page that might be impacting these metrics but are not considered blocking by Chrome.
Normal Core Web Vitals tools highlight resources that completely block rendering. However, there are other ways that a request can delay the FCP and LCP values that the browser can't detect as part of a normal page load. That is exactly what this tool seeks to uncover for you.
Before reading any further you can go ahead and try it yourself!
What is the Website Bottleneck Finder?
The website bottleneck finder analyzes the requests made on your site, then re-runs the page load process over and over, delaying a different resource each time to discover which ones have a significant impact on your FCP and LCP values.
It answers "which of my requests are actually slowing down rendering?" not just "is this request render-blocking by Chrome's definition?"
Did I mention that the tool is free to use? Once you have a result, you can then go further and do a full Lighthouse analysis of the page via the website speed test, which gives holistic recommendations, or sign up for continuous monitoring and alerting via synthetic tests or real user metrics.
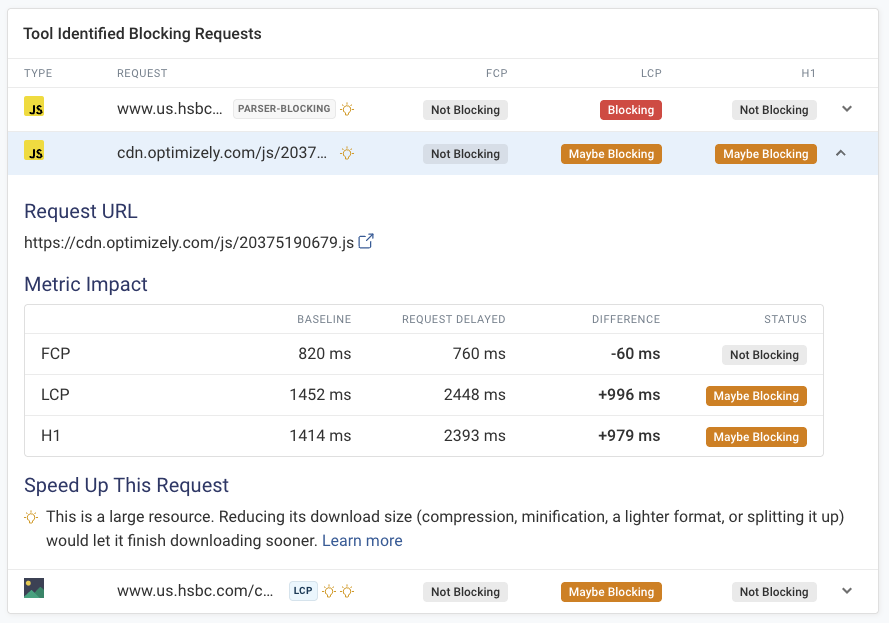
The problem: Chrome's "render-blocking" label is too narrow
Chrome does classify some requests as render-blocking (renderBlockingBehavior: "Blocking" in the DevTools protocol), but that only covers synchronous, parser-blocking <head> resources: <link rel=stylesheet> and non-async/defer <script> tags encountered before first paint.
Lots of requests delay rendering without ever earning that label:
- The LCP image itself: Chrome doesn't call an image "render-blocking," but if it loads late, LCP is late.
- Async/deferred scripts that fetch data before the page shows real content (e.g. an SPA's initial data fetch).
- JS bundle chunks loaded after the main bundle (code-splitting) that gate rendering a component.
The outcome of relying solely on DevTools' render-blocking flags is that developers can miss the real bottlenecks, and fix the wrong requests.
These aren't the only gaps, either. Even within Chrome's own render-blocking labels, there's in_body_parser_blocking, which is only genuinely blocking if it happens to sit before your visible content in the body. Move the same script lower down the page, and it keeps the identical label while having zero impact on rendering.
The classification tells you what Chrome calls the request, not what it's actually doing to your page. That is why we still run in_body_parser_blocking URLs in the tool whilst other render-blocking items are not included.
How the tool works
The bottleneck finder measures how delaying each resource on the page impacts page speed metrics. Our test goes through 5 steps to analyze your website:
- Baseline load: loads the real page once, records FCP/LCP/H1-visible timings, and caches every response plus the LCP element/image.
- Candidate list: picks resources worth testing, skipping the main document, resources DevTools has already marked as render-blocking (as we can already see they are render-blocking without having to test them further), non-network URLs, and non-LCP images.
- Repeat, cache-replayed, with contention control: replays the page from the cached responses, so network variance doesn't skew results, to get a stable "optimum" baseline.
- Delay one request at a time: for each candidate we select, we replay the page again holding back just that one request by a fixed 2 second delay to measure how far FCP/LCP/H1-visible move.
- Verdict: if delaying a request pushes a metric back by half the delay or more, it's flagged as blocking rendering - regardless of what Chrome's own classification said.
Anything Chrome already calls "Blocking" is reported as blocking without needing a delayed run. The LCP image gets the same "confirmed" treatment if delaying it visibly delays LCP.
This is a controlled (we rely heavily on cached responses to keep it fast) but causal test of "what happens if this request is slower?" It is not a guess from static analysis, which is what lets it find bottlenecks Chrome's own checks can miss.
If your website makes a lot of requests it might take 2-3 minutes for the tool to finish running.
What can you do with the analysis result?
The test turns "is this on the critical path?" from a guess into a measured answer, ranked by actual impact on FCP, LCP, or the H1 timing. This helps prioritize optimization work: you can focus on the requests proven to matter first and ignore ones that only look suspicious in a waterfall.
The tool can be particularly useful for third-party scripts, SPA data-fetching patterns, and code-split bundles which all fall under the banner of being invisible to Chrome's render-blocking flag.
Once you know which requests slow down your website here's what you can do:
- Check if they are actually needed: could you tweak your A/B testing settings to not hide all page content? Could your SPA start rendering content before all data is available?
- If the request is needed, try to optimize it. Make sure the resource is as small as possible and ensure there's no delay on when it starts loading.
A Real-life Example
Here's an example of an analysis run on www.virginatlantic.com.
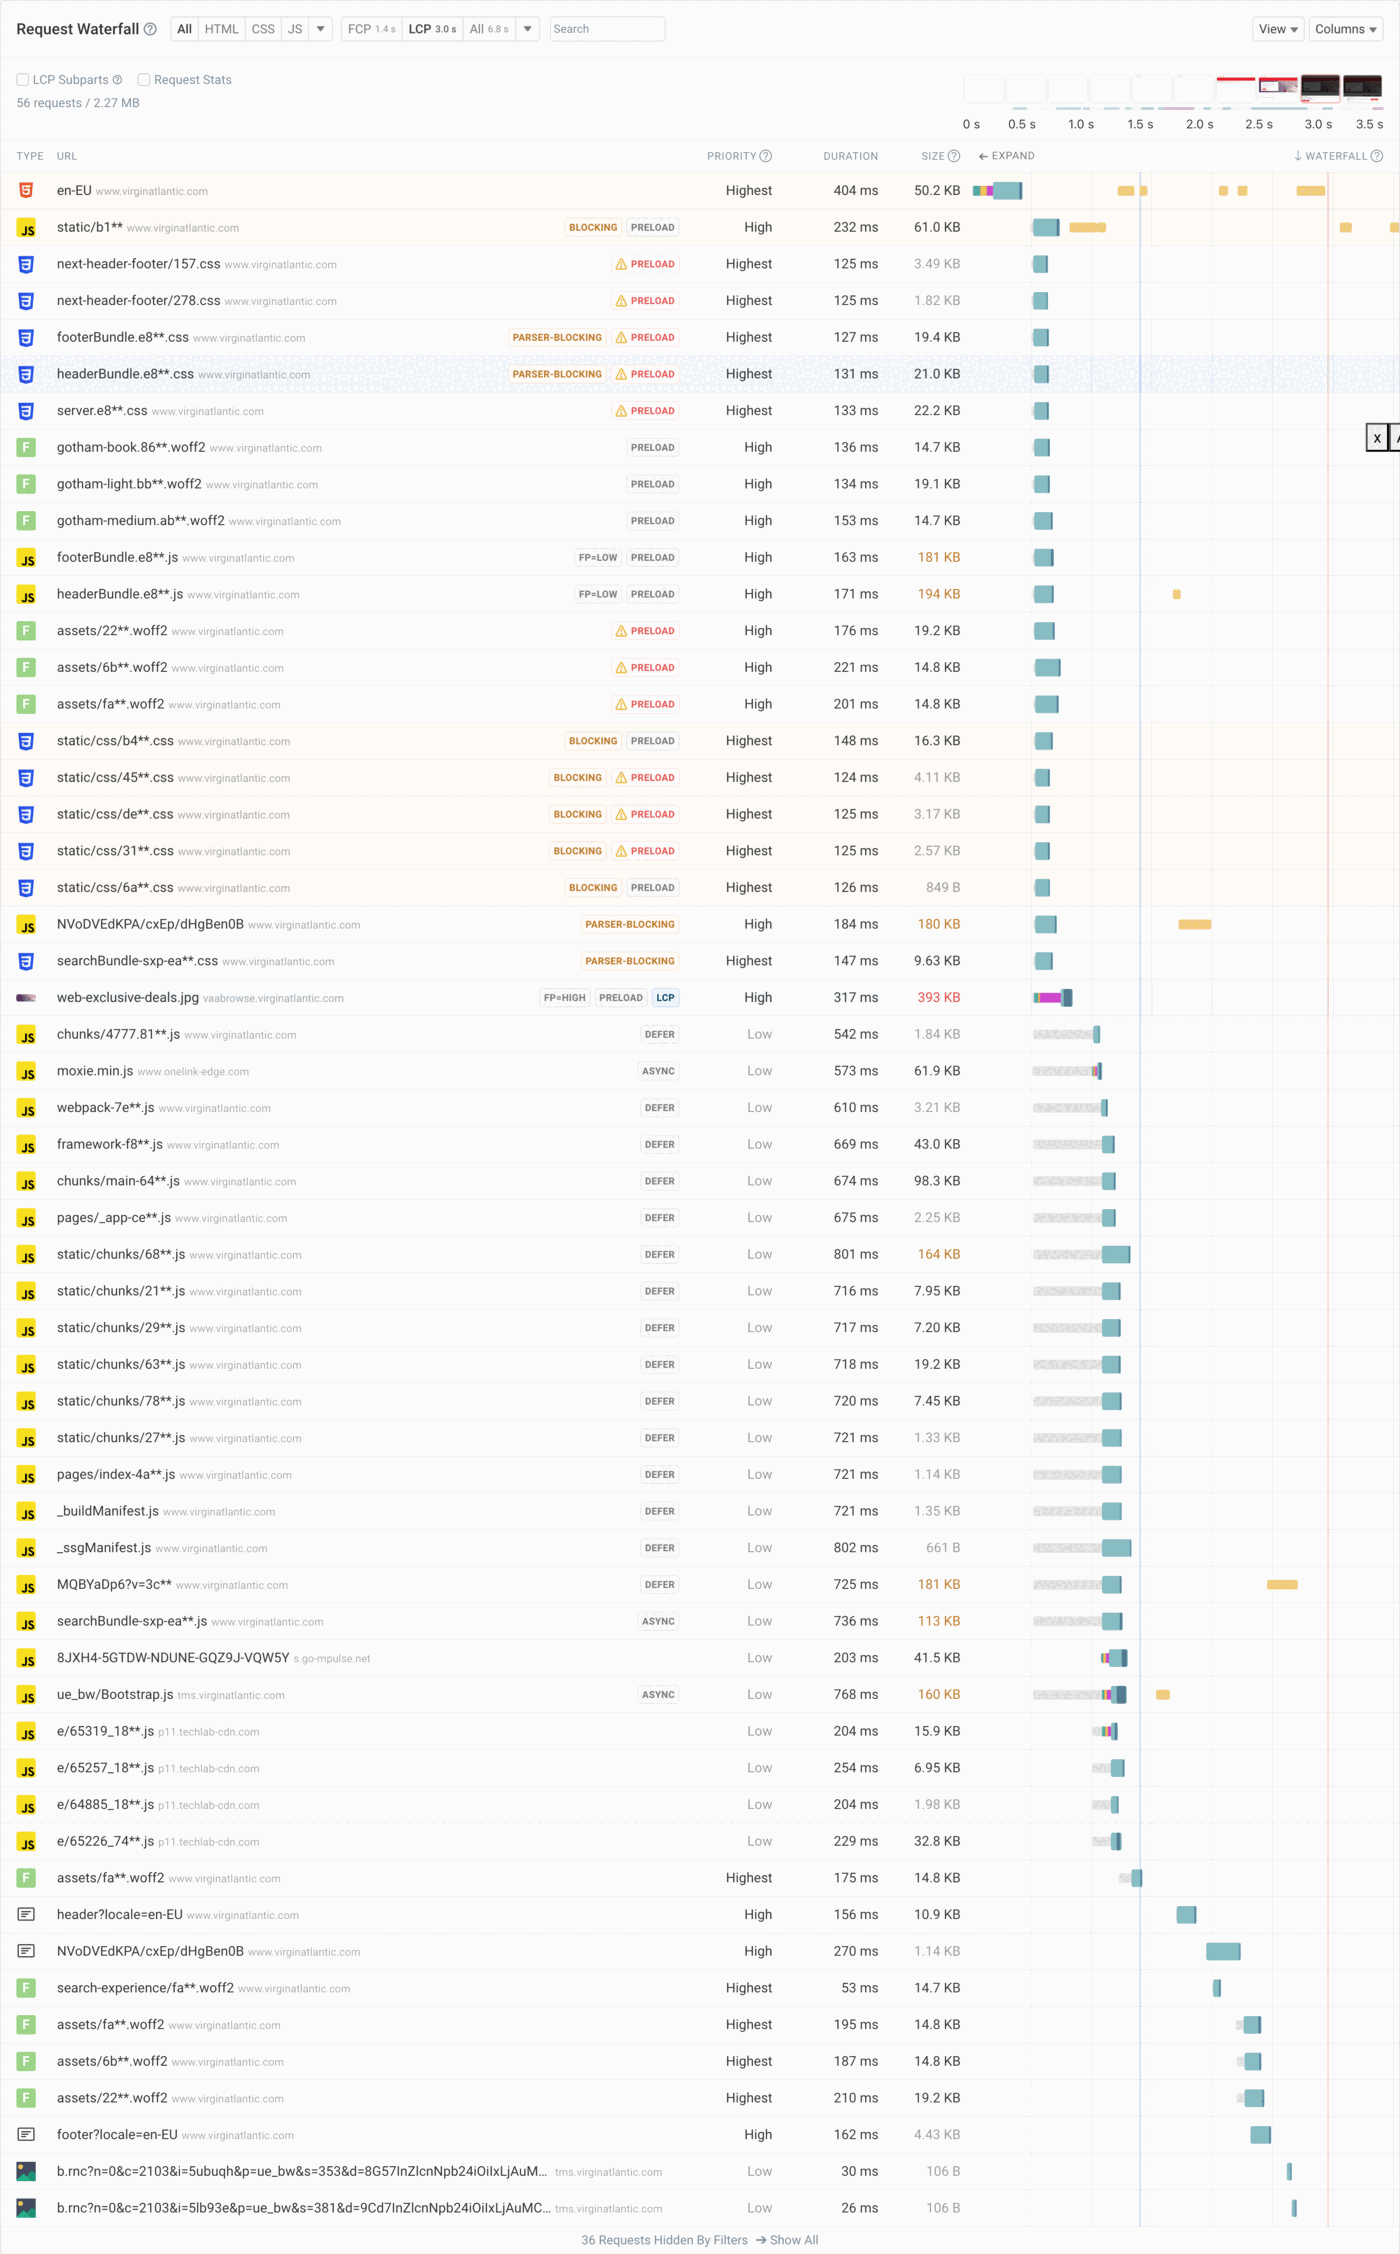
You can see in the request waterfall that there are many requests marked as blocking or parser-blocking. Only 2 of those requests are JS files.
The other JS files are loaded with the defer attribute set so are not blocking, but you can see that the LCP only occurs after they have all loaded so despite not being considered render-blocking at least one of those scripts is affecting the LCP. But which one(s)?
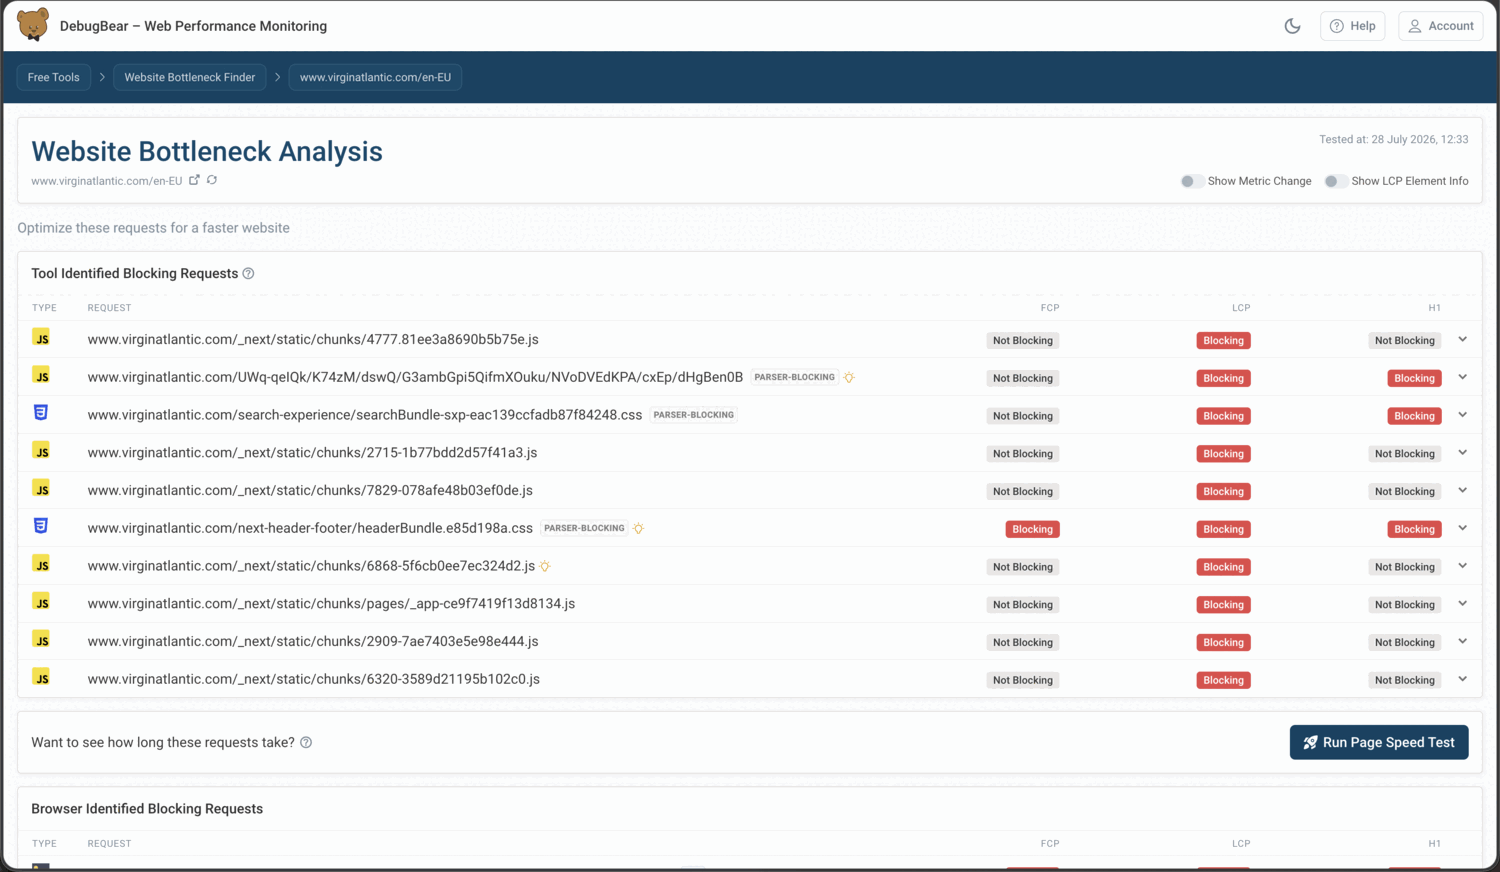
If we look at an analysis from the website bottleneck finder below we can immediately identify which of those 23 JS scripts above look to have an impact on the LCP.
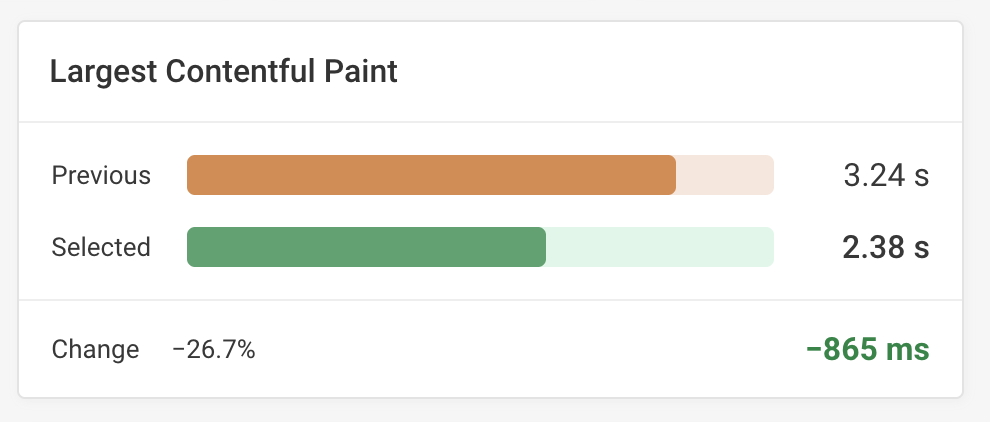
Using that data we can quickly take those script URLs that seem to impact the LCP and see what happens if we run an experiment to preload them so that they can start loading before they are encountered/added to the page.
We tried it out with the DebugBear experiments feature and noticed a significant performance boost which resulted in the LCP occurring over 25% faster. This is on a typical desktop format synthetic test (8 Mbps bandwidth, 40ms round-trip latency, 1x CPU throttling).
Have a look at the website bottleneck finder and see if you can uncover anything critical to the LCP or FCP that might not be considered as a blocking request according to traditional methods.
Go beyond one-off performance checks
The bottleneck finder can help you speed up your website, but if you want it to stay fast you can use DebugBear monitoring to identify slow pages, get alerted to performance regressions, and get more insights to optimize your website.
Monitor Page Speed & Core Web Vitals
DebugBear monitoring includes:
- In-depth Page Speed Reports
- Automated Recommendations
- Real User Analytics Data