
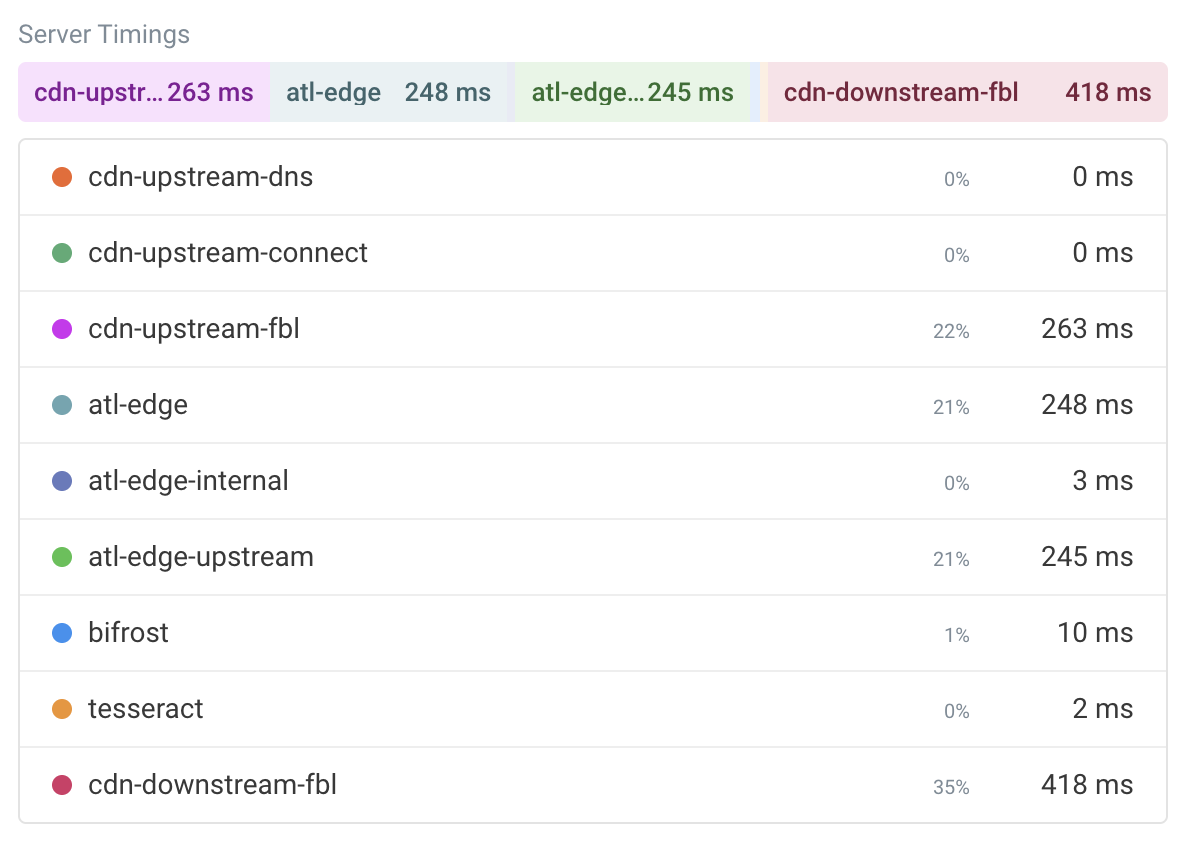
Server Timings provide a way to see what’s happening on the server while an HTTP request is processed. These metrics can be useful for uncovering bottlenecks in APIs, caches, or specific parts of your application.
In this post, we’ll look at what Server Timings are and why they’re useful, how they work through the Server-Timing header, how to check them, and how to track them over time.
What are Server Timings?
The Server-Timing header is an HTTP response header that a server can use to expose performance metrics about the request.
These timings can be viewed in the browser and collected via JavaScript, allowing you to better understand how a server contributes to page performance.
Server Timings can report a variety of server-side work, such as database queries, API calls, caching, and CPU time.
Many Content Delivery Networks can also be configured to report data on caching and request processing via Server-Timing headers. That makes it possible to see whether a request was served from a CDN edge node or forwarded to the origin.
By understanding where time is being spent, you can identify backend issues that may be contributing to poorer experiences for users. A slow Time to First Byte tells you the server took a long time to respond, but not which part of your infrastructure was responsible. Server Timings fill in that detail.
How do Server Timings work?
The format of a Server Timing is typically made up of three parts: name, duration, and description.
Only the name is required, as shown in the example below.
Server-Timing: db
You can also add a duration using the dur parameter and a description using the desc parameter. Either or both of these parameters can follow the name, separated by a semicolon.
In this example, the db metric has a duration of 35 ms and a description of "response".
Server-Timing: db;dur=35;desc="response"
Multiple metrics can be included in a single header by separating them with commas:
Server-Timing: db;dur=35, app;dur=42
How to check Server Timings
There are different ways to view Server Timings. Let’s look at three options: Chrome DevTools, JavaScript, and DebugBear.
Checking Server Timings with Chrome
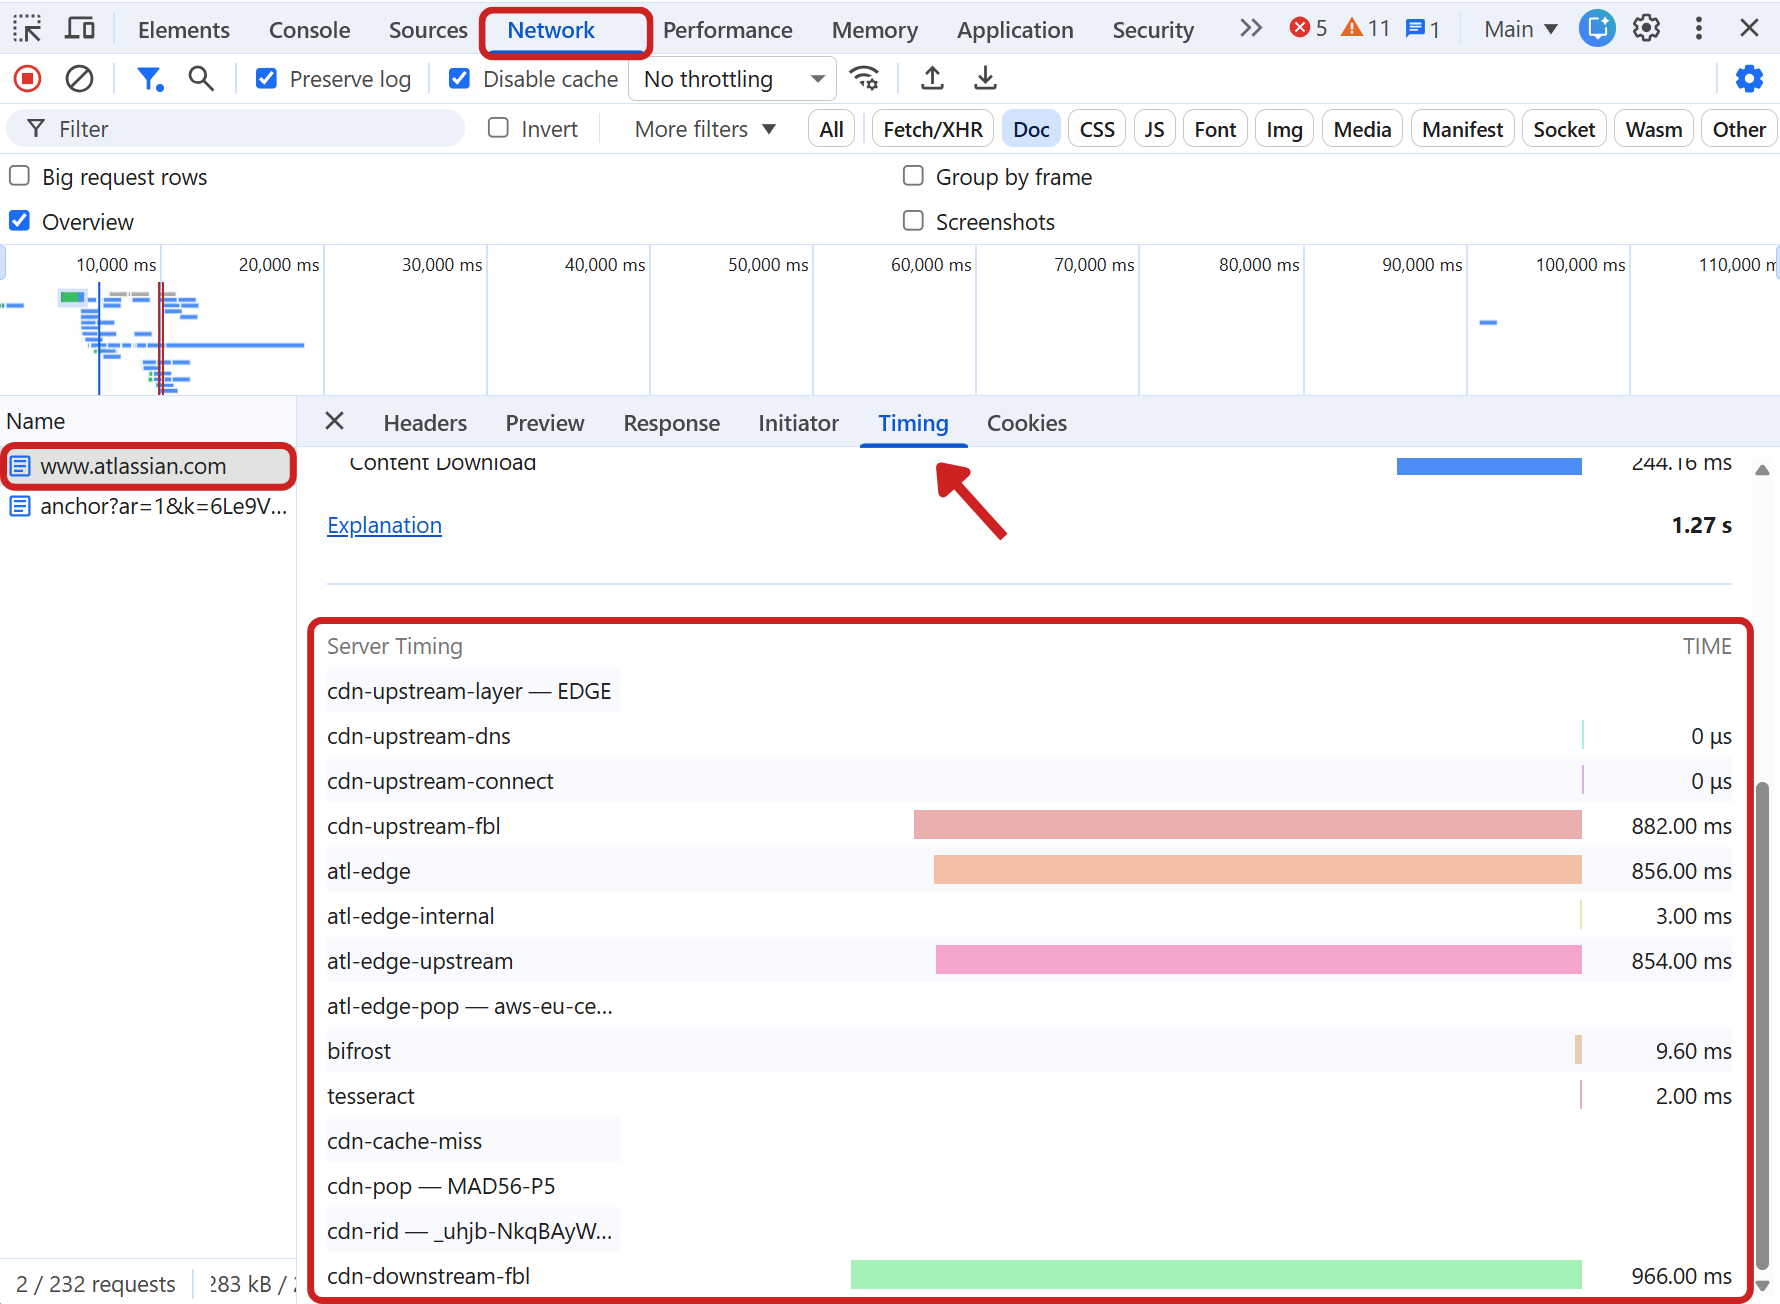
To check Server Timings in Chrome, open DevTools. Then go to the Network tab and reload the page.
Select the request that you want to inspect and search for the Server Timing section in the Timing tab.
Checking Server Timings with DebugBear
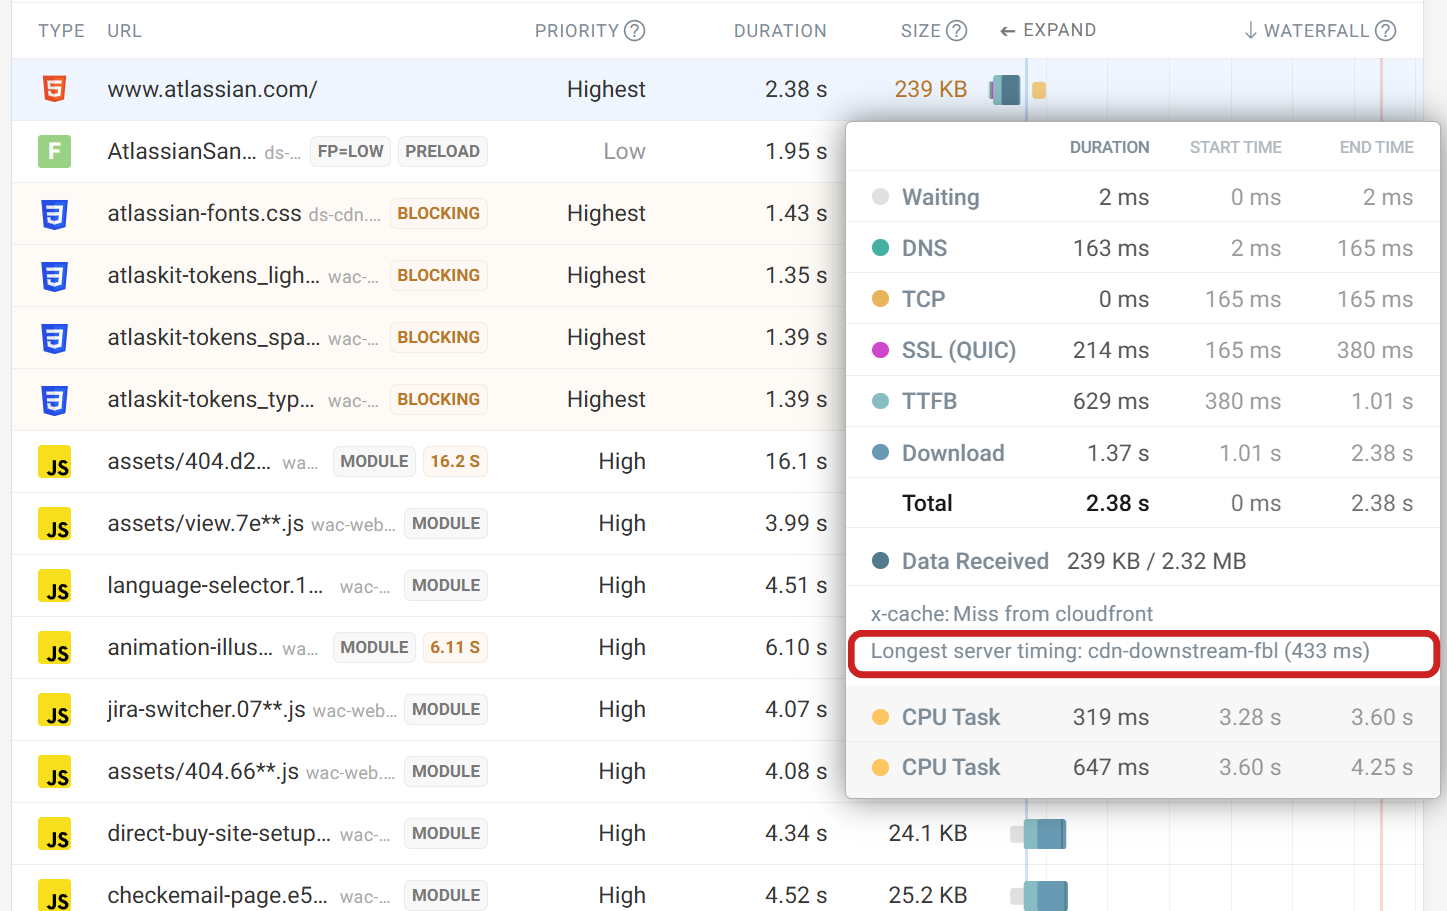
You can also check Server Timings with a DebugBear Free Website Speed Test. After running a test, open up the request waterfall and hover over the HTML request. The longest Server Timing metric will be listed in the tooltip.
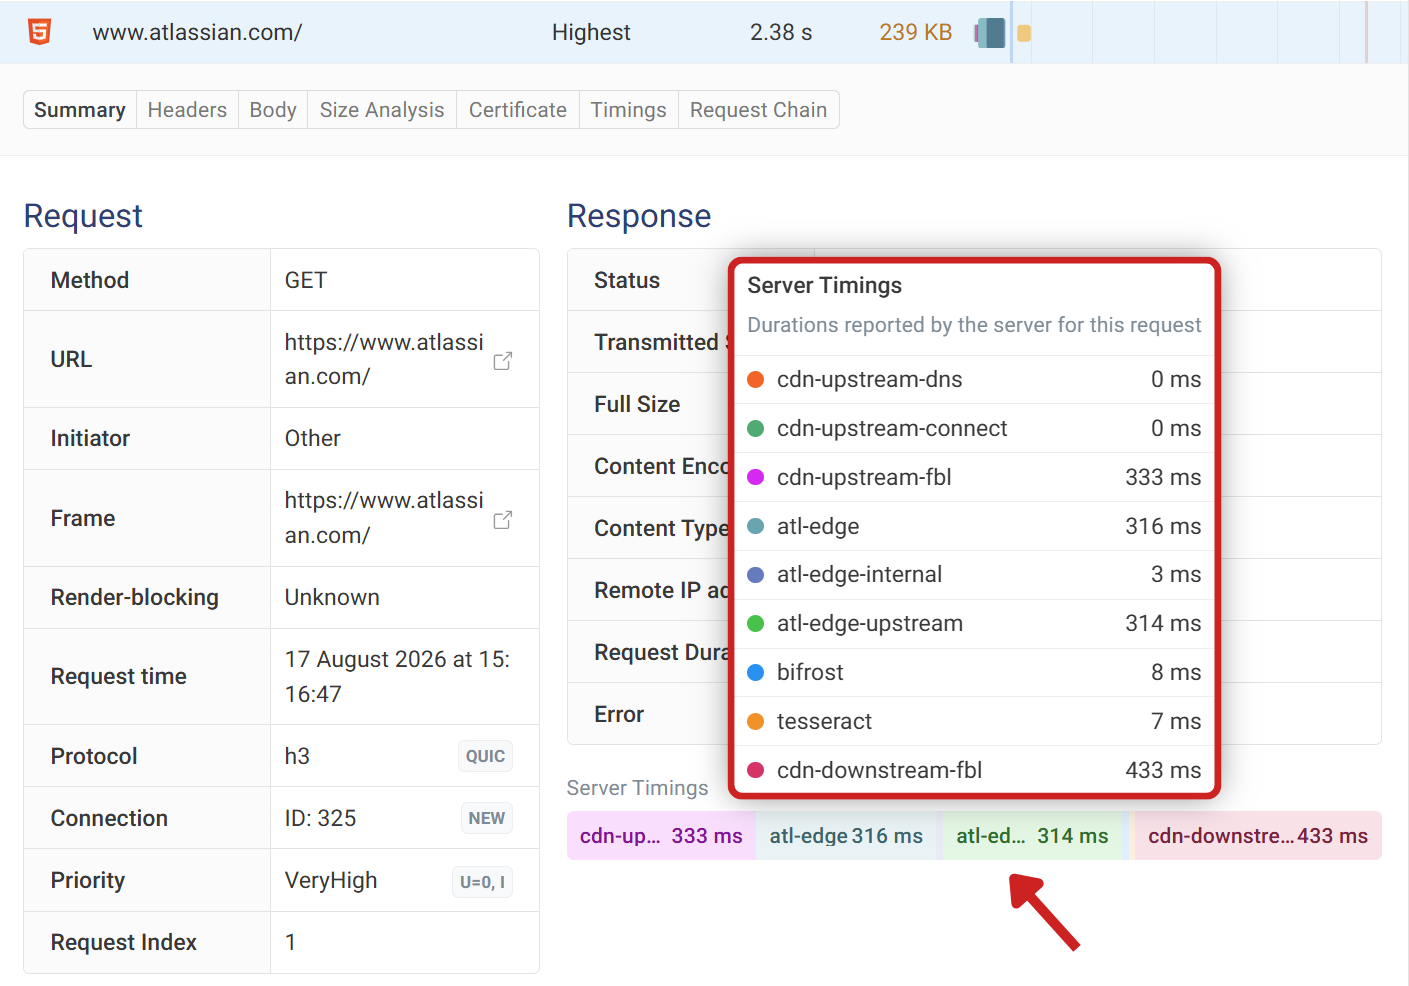
To inspect further, click into the request. A Server Timing breakdown will be listed in the Response section on the right. Hovering over the chart will list each timing and its value.
Reading Server Timings with JavaScript
Server Timings are also exposed to JavaScript through the Performance API, which is how real user monitoring tools collect them. Each performance entry has a serverTiming array containing the metrics reported for that request.
const [navigation] = performance.getEntriesByType("navigation");

for (const timing of navigation.serverTiming) {
  console.log(timing.name, timing.duration, timing.description);
}
This example reads the timings for the page's own HTML document. You can do the same for any other request by looking at the resource entries instead.
Timings for requests served from a different origin are only visible to JavaScript if that server also sends a Timing-Allow-Origin header. Without it, the serverTiming array comes back empty even though the values are still visible in DevTools.
How to track Server Timings
DebugBear can monitor Server Timing performance using both scheduled lab tests and Real User Monitoring, so you can track the metrics in a controlled environment as well as for real visitors.
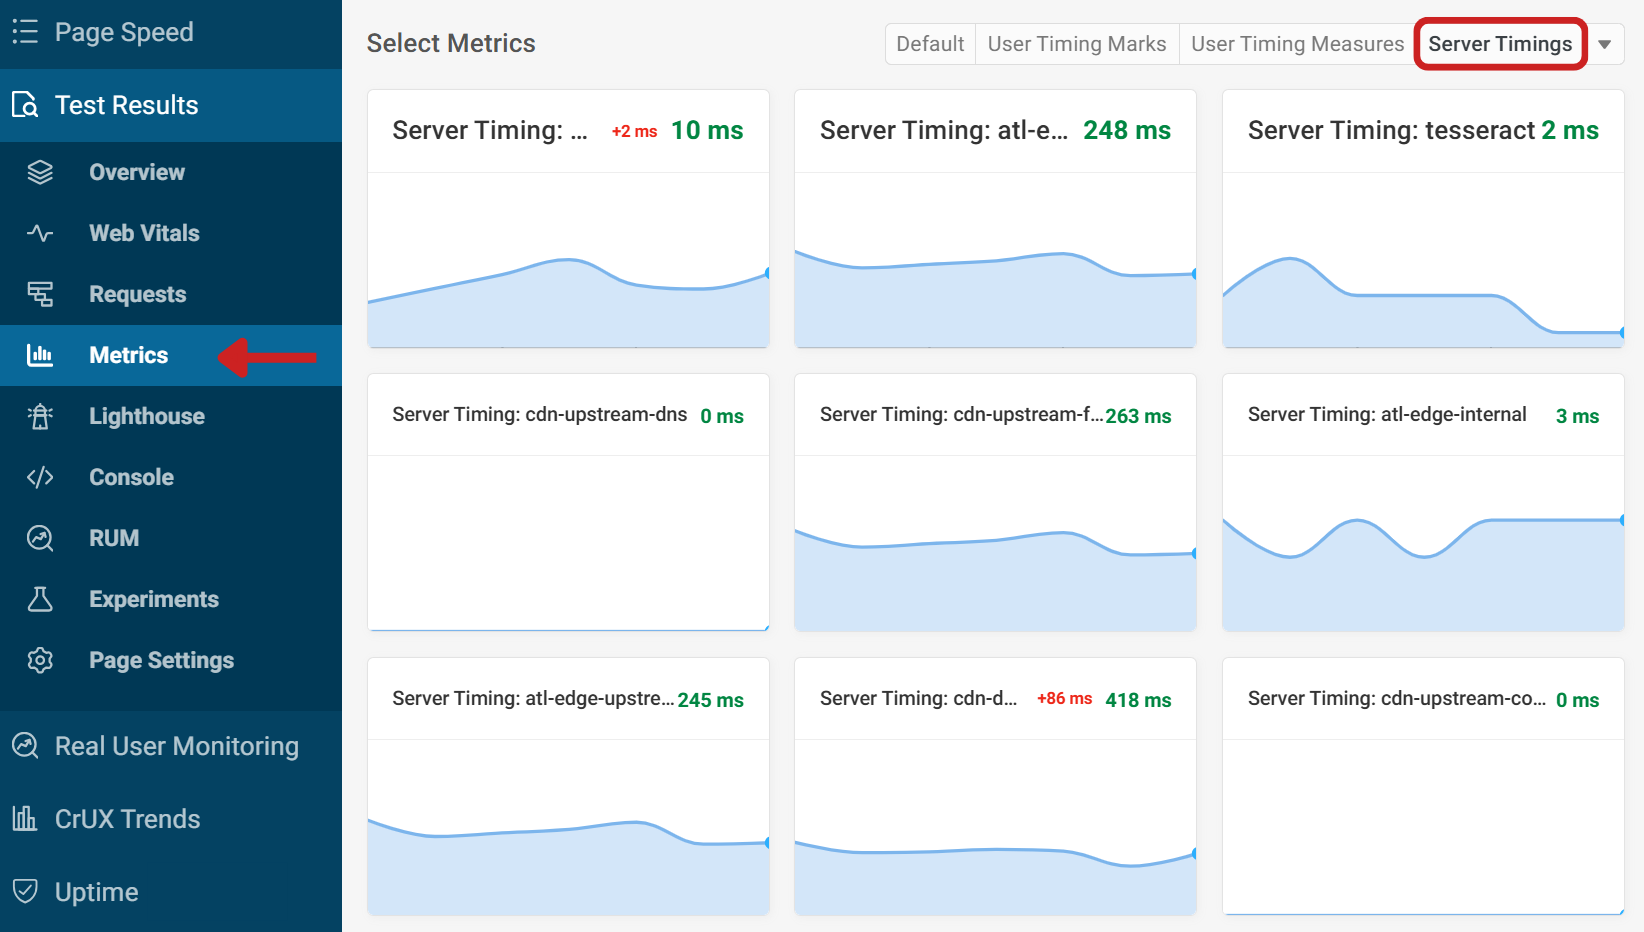
After setting up the Server Timings on your server, you can find the metrics in the Metrics tab of the lab test result. Select Server Timings from the metric group selector in the top right of the page.
Each Server Timing metric is then listed below, showing the performance from the selected time period. Below the individual metric section is a chart highlighting each metric, allowing you to see directly how they perform relative to each other and giving insight into how a regression in one Server Timing could impact others.
Server Timings can also be tracked for real visitors to your website using Real User Monitoring. Because the values arrive as text and numbers rather than standard performance metrics, DebugBear collects them as custom tags and metrics, which you configure from the Tags and Metrics section of the RUM settings tab.
Which one you need depends on what your server reports. A description like desc="cache-hit" is a label you'll want to segment your data by, so it belongs in a custom tag. A duration like dur=35 is a number you'll want to chart over time, so it belongs in a custom metric. If your header includes both, set up one of each.
To capture a description, click Create Tag.
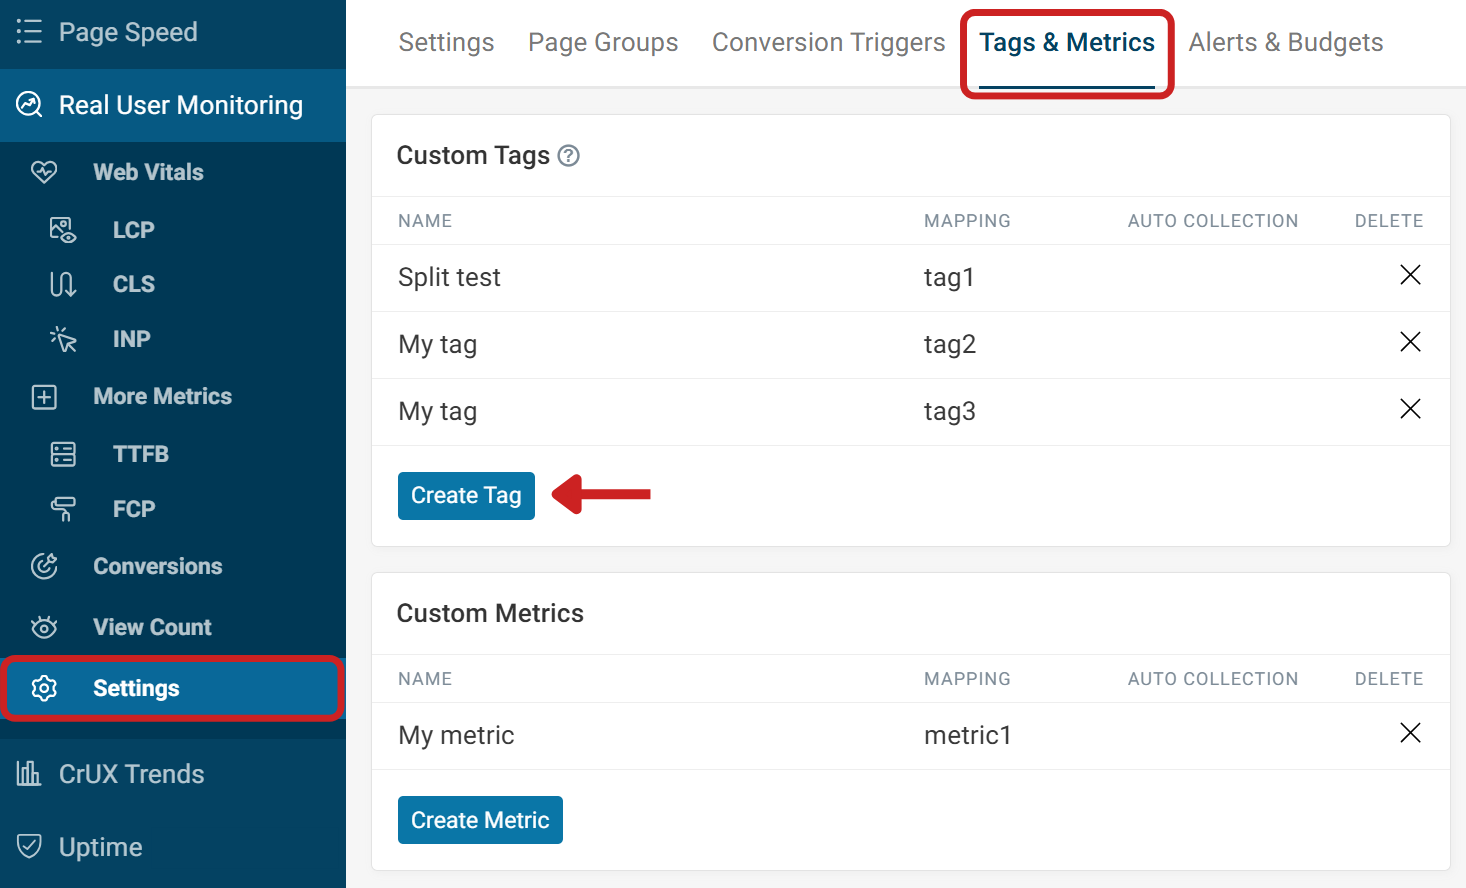
Select a tag ID from the dropdown, then add a name and description for the new tag. Up to five custom tags are available. Next, choose Server Timing Description from the data collection options and enter the Server Timing name. That name is the first part of the Server-Timing header, so for our earlier example it would be db.
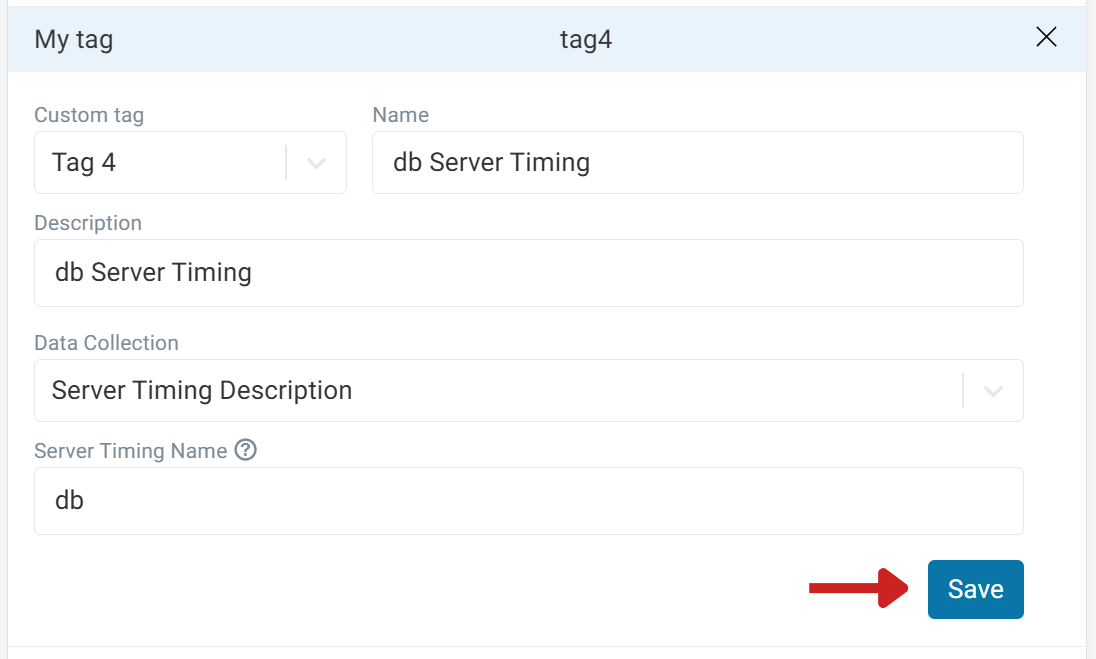
Capturing a duration works the same way, except you create a Custom Metric instead. Be sure to use the same name as the Server-Timing metric itself so the value can be matched to the correct timing.
Conclusion
The Server-Timing header gives you visibility into what's happening on the backend during a request. Monitoring these metrics over time lets you spot regressions before they affect visitors.
If you haven't set up Server-Timing on your site yet, add it to a few key endpoints and run a DebugBear Free Website Speed Test to see the metrics in action.
Monitor Page Speed & Core Web Vitals
DebugBear monitoring includes:
- In-depth Page Speed Reports
- Automated Recommendations
- Real User Analytics Data