
Modern web applications are rarely built by a single team. They often combine first-party code with third-party scripts, analytics, images, videos, and embedded applications. While each component may perform well individually, together they can compete for network resources and significantly slow down page loads.
To help developers identify these issues, Microsoft recently introduced Network Efficiency Guardrails: an experimental browser feature that automatically detects common resource-loading patterns that negatively impact performance for real users.
This guide explains what performance issues you can detect, how to enable it in Microsoft Edge, how to implement it in Nuxt 4, and how to inspect reports in DevTools.
What are Network Efficiency Guardrails?
Network Efficiency Guardrails are an experimental browser feature designed to detect inefficient resource-loading patterns automatically.
Instead of manually reviewing every network request in DevTools, the browser continuously watches how your application loads resources and reports potential problems through the Reporting API.
Currently, the browser reports three types of issues:
- Text resources served without HTTP compression
- Images larger than 200 KB
data:URLs larger than 100 KB
These thresholds were chosen based on real-world usage patterns and common web performance best practices.
Network Efficiency Guardrails are still an experimental feature. Currently:
- Only Microsoft Edge supports them
- Browser flags must be enabled
- The list of detected issues is intentionally small
- Thresholds may evolve over time as Microsoft gathers developer feedback
Expect additional guardrails to be introduced as the API matures.
Why this matters
Most performance audits happen before deployment. However, production applications evolve over time:
- Marketing uploads larger images
- New third-party integrations are added
- Another team deploys an embedded widget
- Compression is accidentally disabled after an infrastructure change
Without continuous monitoring, these regressions can easily go unnoticed.
Network Efficiency Guardrails provide another layer of protection by allowing the browser itself to report inefficient loading patterns as users browse your application.
How Network Efficiency Guardrails work
The feature combines two existing web platform APIs:
- Document Policy
- Reporting API
The flow looks like this:
- Your application opts into Network Efficiency Guardrails using a
Document-Policyresponse header. - You specify where reports should be sent using the
Reporting-Endpointsheader. - While users browse your application, Edge monitors network requests.
- If the browser detects an inefficient loading pattern, it generates a report.
- Reports can be viewed locally in DevTools or collected by your backend.
Unlike Lighthouse, this mechanism works while users are actually interacting with your application rather than during a synthetic audit.
What gets reported?
At the time of writing, Network Efficiency Guardrails detect three common performance issues.
Large images
Images larger than 200 KB generate a report.
Large images remain one of the biggest contributors to slow page loads, especially on mobile networks.
Instead of shipping oversized assets, consider:
- AVIF
- WebP
- Responsive images
- Image CDNs
- Proper compression
Uncompressed resources
Text-based resources should almost always be compressed using Brotli or Gzip.
Examples include:
- HTML
- CSS
- JavaScript
- JSON
- SVG
If these resources are transferred uncompressed, the browser reports a violation.
Large data URLs
Embedding large assets directly inside HTML or CSS using data: URLs can dramatically increase transfer size and delay parsing.
Network Efficiency Guardrails currently report data: URLs larger than 100 KB.
Enabling Network Efficiency Guardrails
The feature is currently experimental and available in Microsoft Edge 146 or newer.
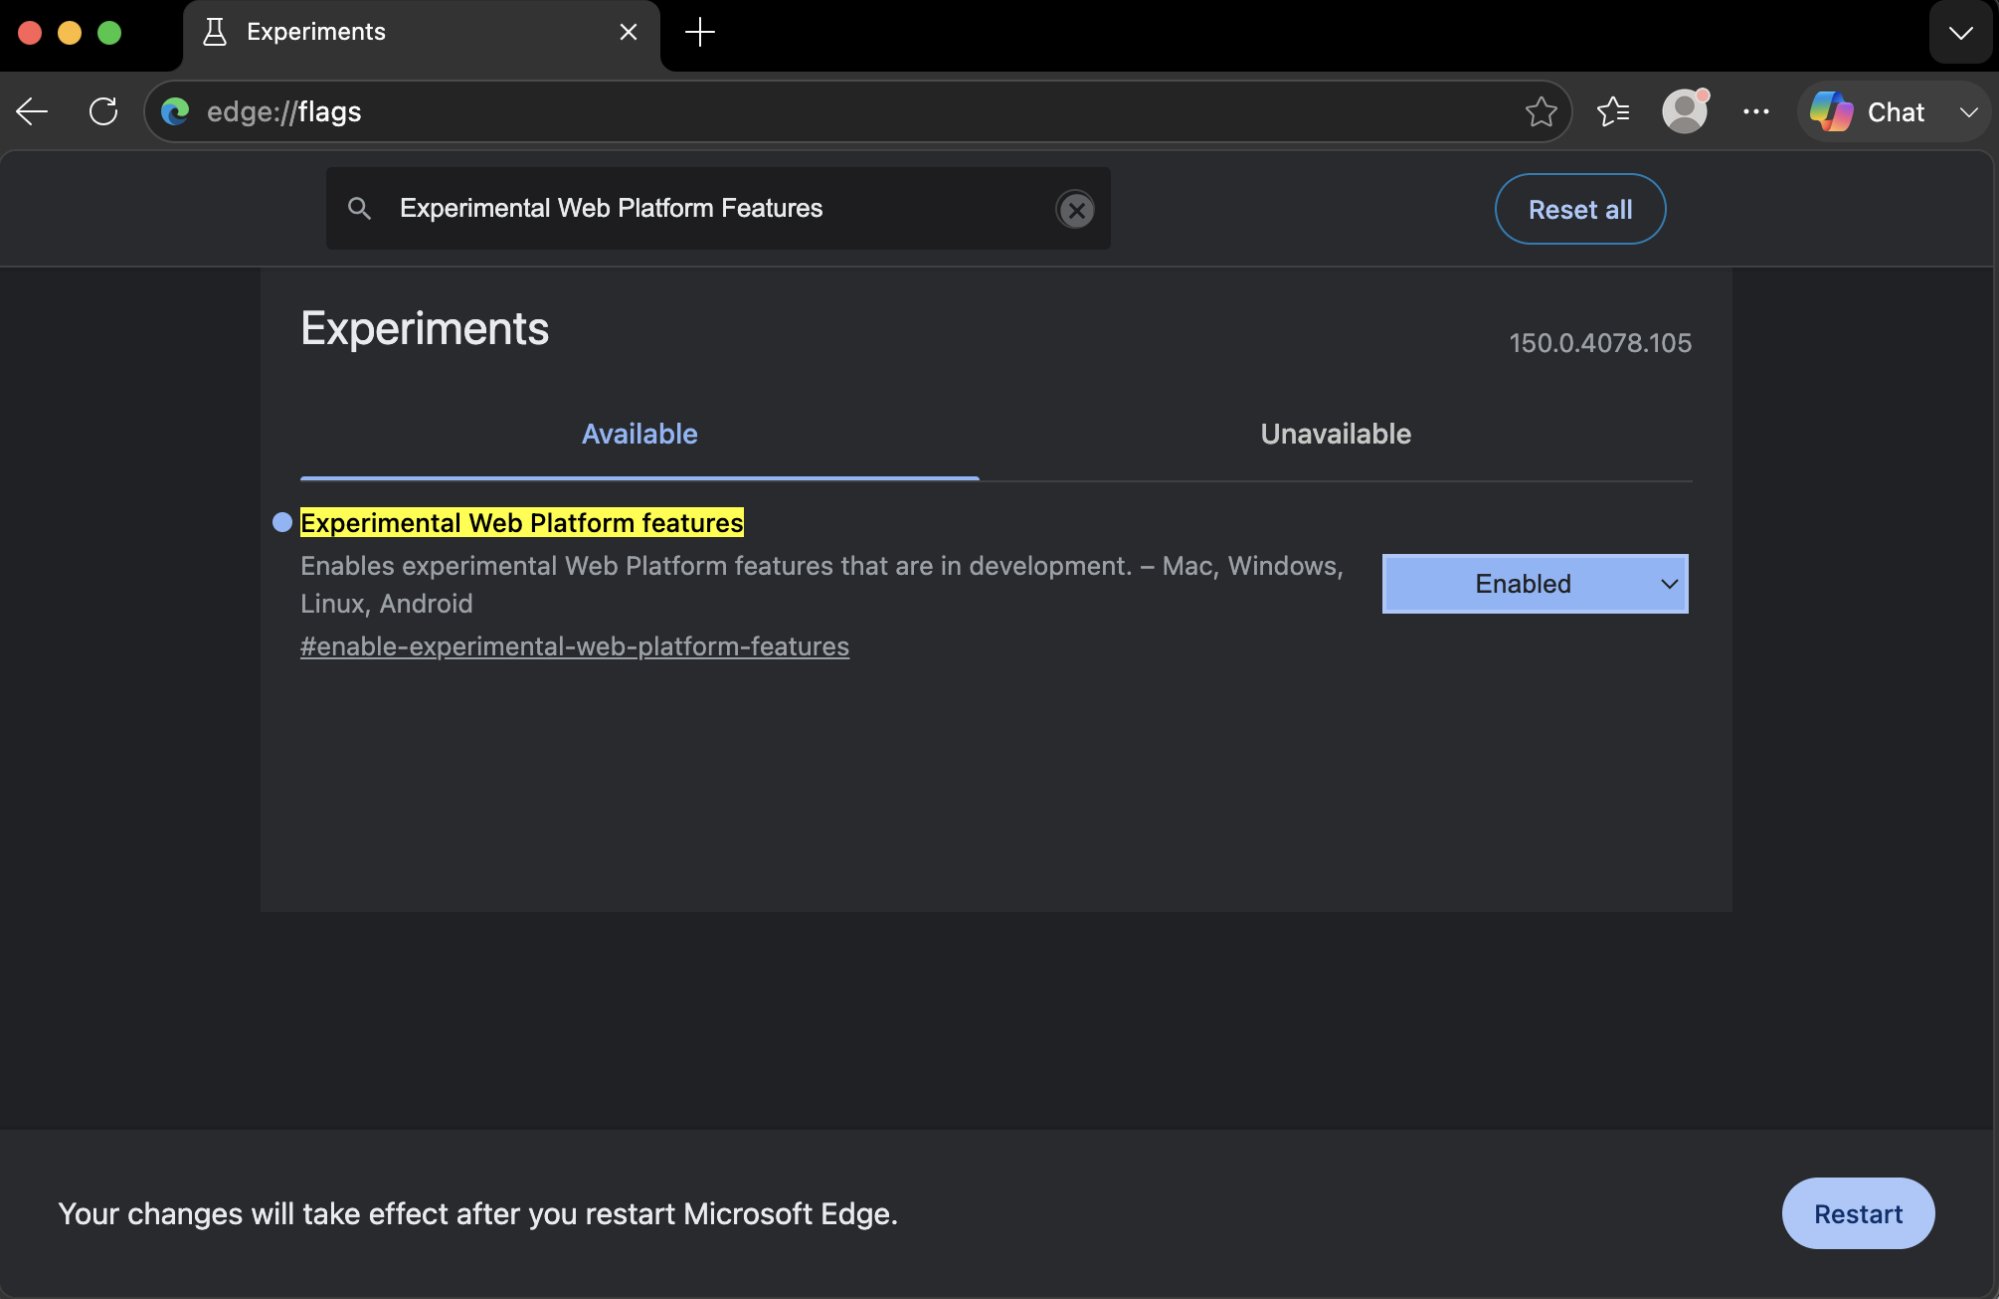
First, enable the required browser flag:
- Open
edge://flags - Search for Experimental Web Platform Features
- Enable the flag
- Restart Microsoft Edge
Opting your website into Network Efficiency Guardrails
Once the browser supports the feature, your application needs to opt in using two response headers.
Document-Policy: network-efficiency-guardrails; report-to=neg-endpoint
Reporting-Endpoints: neg-endpoint="/neg-reporting/"
The first header enables the feature. The second tells the browser where Reporting API violations should be sent.
Initially, you don't even need to implement the reporting endpoint if you're only interested in viewing reports locally in DevTools.
Configuring response headers in Nuxt 4
If you're using Nuxt 4 with Nitro, you can configure these headers globally. One option is using a Nitro server middleware.
// server/middleware/network-efficiency.ts

export default defineEventHandler((event) => {
  setResponseHeaders(event, {
    "Document-Policy":
      "network-efficiency-guardrails; report-to=neg-endpoint",
    "Reporting-Endpoints":
      'neg-endpoint="/neg-reporting/"',
  });
});
Because middleware runs for every request, all HTML documents automatically opt into Network Efficiency Guardrails. If you only want to enable the feature for specific routes, you can instead add the headers inside an individual server route.
export default defineEventHandler((event) => {
  setResponseHeader(
    event,
    "Document-Policy",
    "network-efficiency-guardrails; report-to=neg-endpoint"
  );
  setResponseHeader(
    event,
    "Reporting-Endpoints",
    'neg-endpoint="/neg-reporting/"'
  );

  return {
    hello: "world",
  };
});
This allows you to gradually roll out the feature while evaluating the generated reports.
Viewing reports in DevTools
Once everything is configured, simply use your application normally.
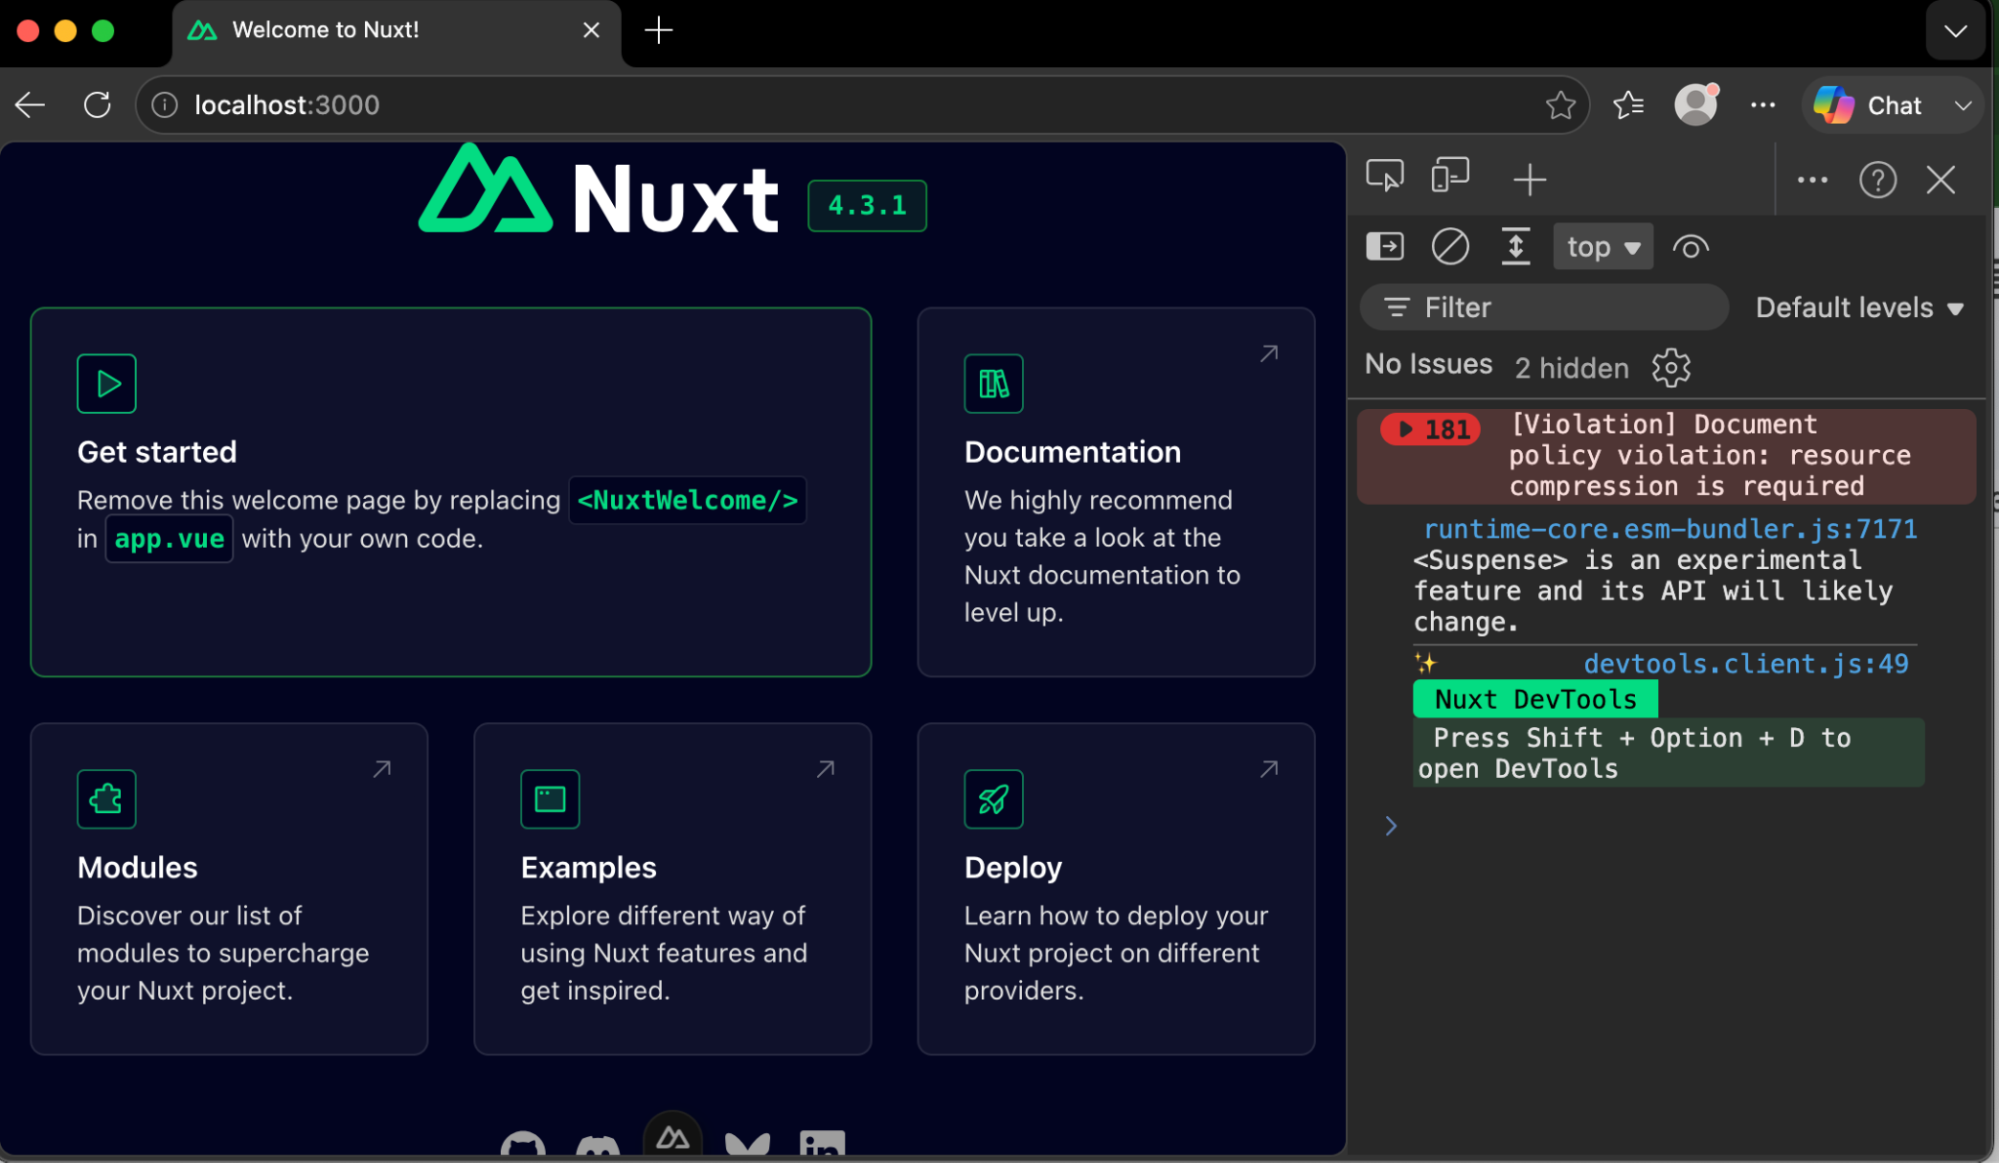
As the browser detects inefficient loading patterns, reports begin appearing inside DevTools. You'll find them in the Console tab.
More detailed reports can be found under Application → Reporting API.
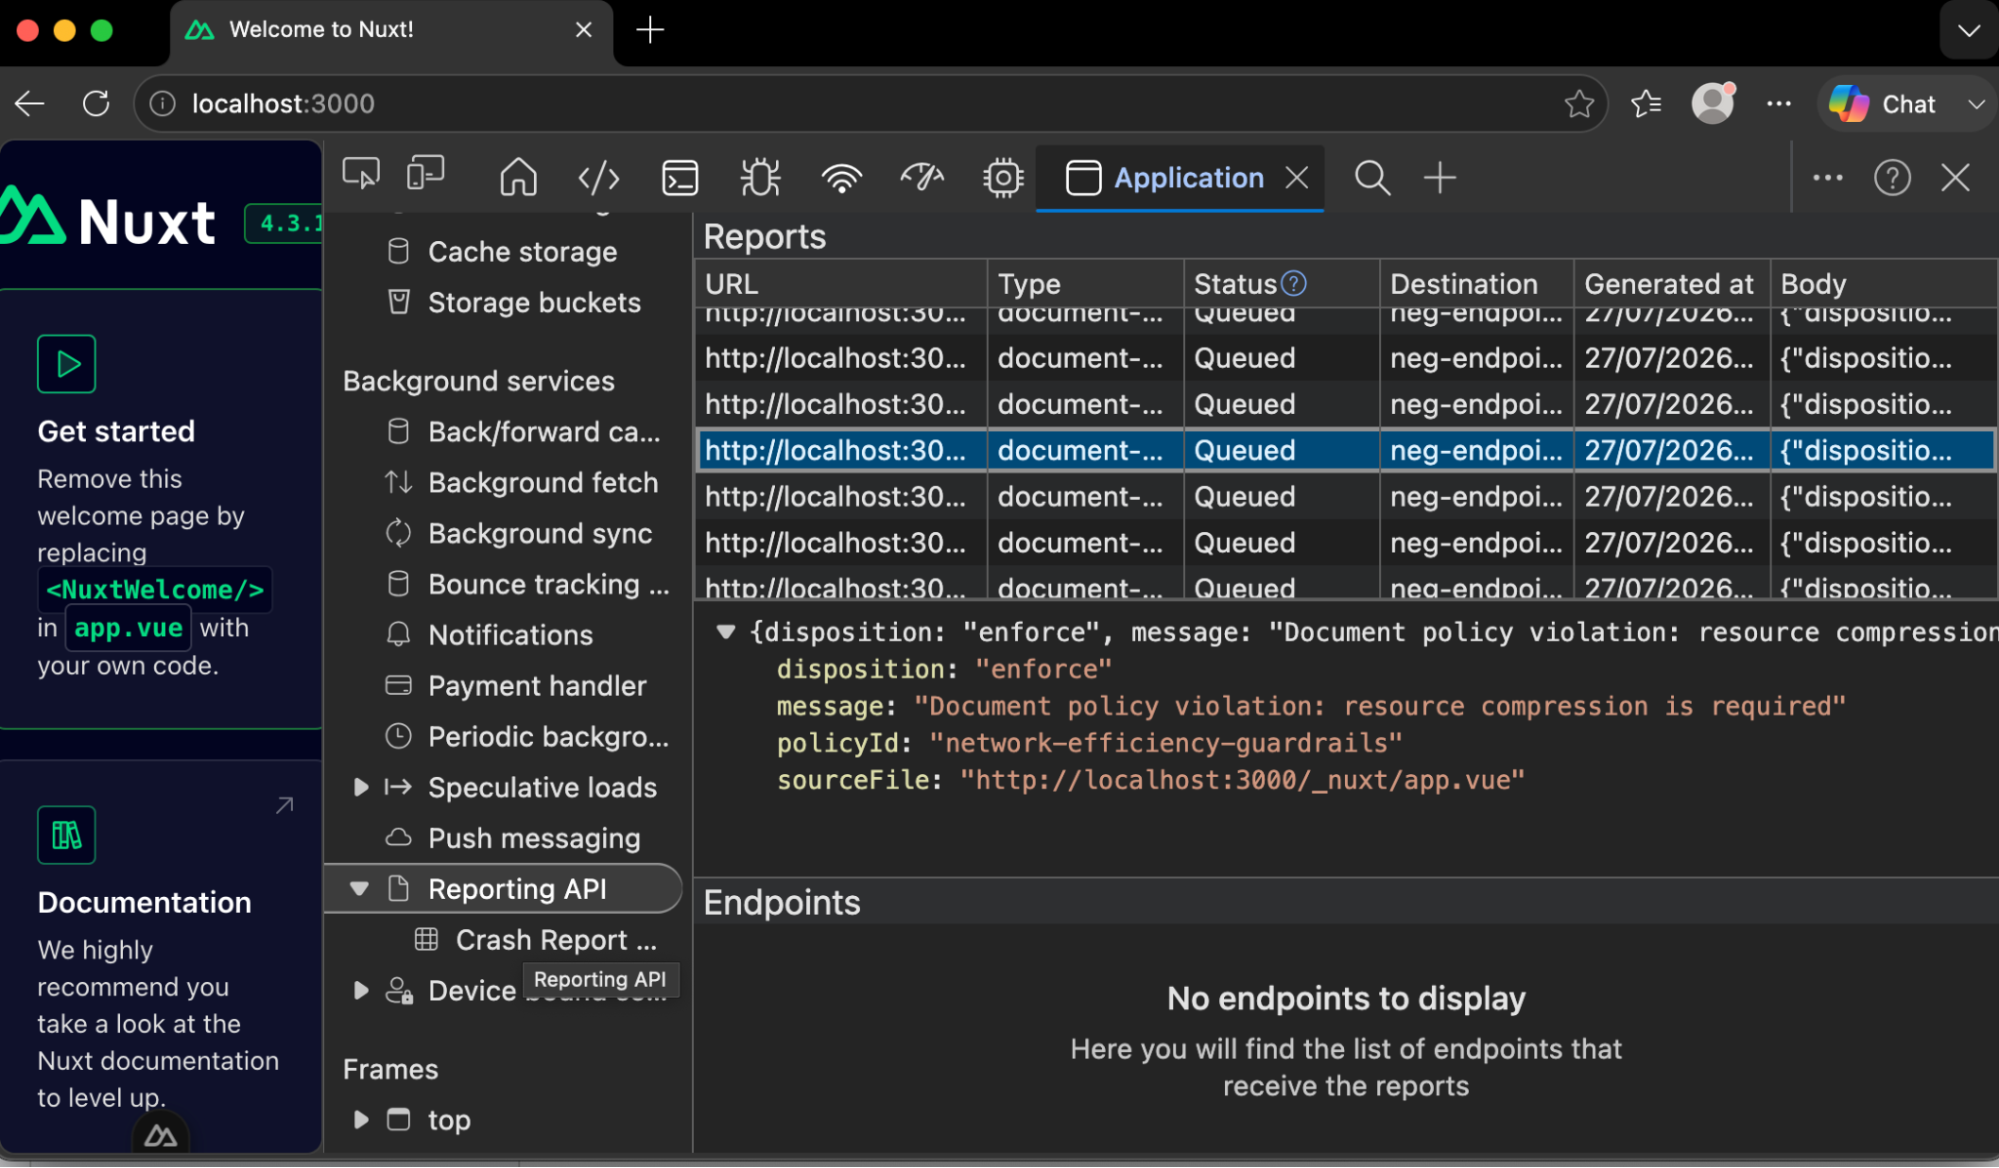
Each report includes details about:
- The offending resource
- The violated guardrail
- Additional metadata describing the issue
This makes it much easier to identify regressions without manually inspecting every network request.
Collecting reports in production
Viewing reports in DevTools is great during development. For production monitoring, configure the endpoint specified in your Reporting-Endpoints header. For example:
Reporting-Endpoints: neg-endpoint="https://example.com/reporting/network-efficiency"
Your backend can then receive structured Reporting API payloads from users' browsers. The body of such a report could look like the following:
{
  "disposition": "enforce",
  "message": "Document policy violation: resource compression is required",
  "policyId": "network-efficiency-guardrails",
  "sourceFile": "${PATH_TO_YOUR_PROJECT}.nuxt%2Fnuxt-fonts-global.css"
}
This makes it possible to detect performance regressions happening in real user environments rather than relying solely on synthetic testing.
Summary
Performance regressions are often introduced gradually as applications evolve.
Network Efficiency Guardrails help detect common resource-loading issues automatically by combining Document Policy with the Reporting API.
After opting your application into the feature, Edge can report:
- Oversized images
- Uncompressed resources
- Large
data:URLs
These reports appear directly in DevTools during development or can be collected from real users in production.
While still experimental, Network Efficiency Guardrails provide an interesting glimpse into a future where browsers actively help developers identify performance problems before they become costly.
Monitor web performance with DebugBear
DebugBear monitors your website using Lighthouse lab tests and real user monitoring, alerting you when Core Web Vitals regress and helping you pinpoint the change that caused it.
Sign up for a free trial!
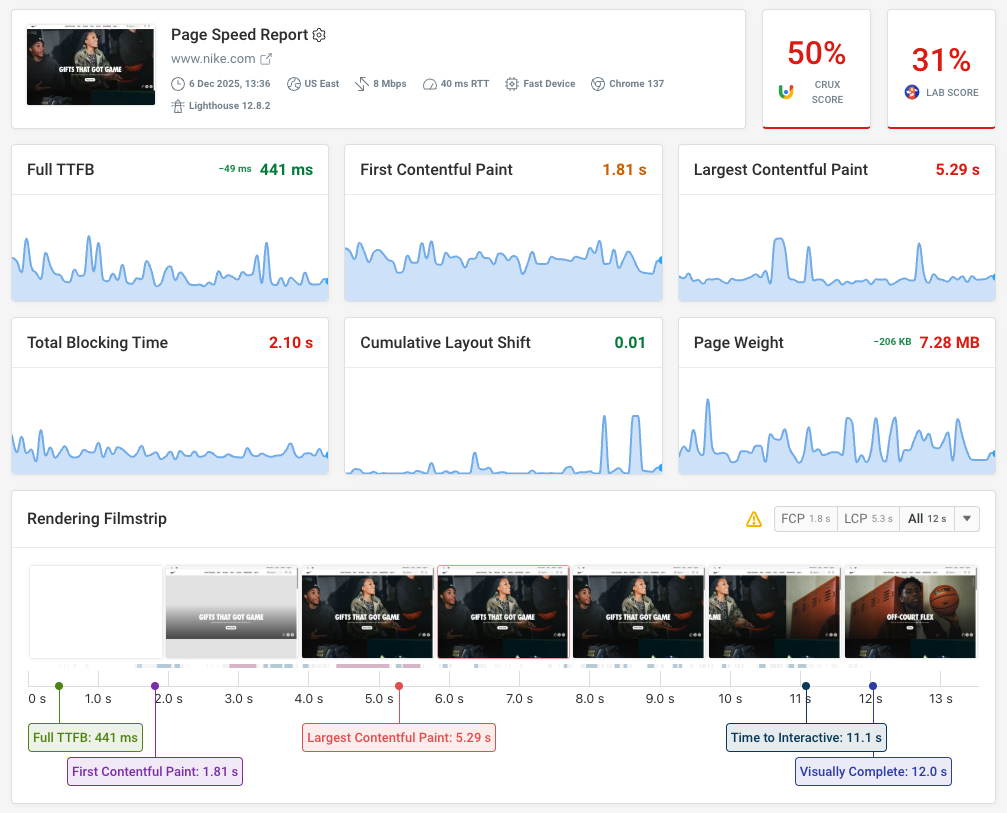
Monitor Page Speed & Core Web Vitals
DebugBear monitoring includes:
- In-depth Page Speed Reports
- Automated Recommendations
- Real User Analytics Data