
A fast marketing website is important for making a good first impression on potential new customers. Often marketers are in charge of this part of the visitor experience, but developers are the ones actually making the technical changes.
In this article, I'll explain how marketing and development teams can work together to deliver a great user experience.
The division of responsibility between marketing and development
Who owns what aspect of website optimization will vary across companies, but here's a typical breakdown:
- Marketing: Assessing high-level UX and SEO performance
- Together: Identifying page speed problems, discussing solutions, and monitoring for regressions
- Development: Implementing technical solutions
Sometimes you might also need help from IT and infrastructure teams to change how your website is served to customers.
While development teams usually own the core of the website, marketing teams can also have an impact on performance through content changes, ad campaigns, or third-party scripts.
A workflow for working through performance problems together
Let's take a look at how your company can use web performance monitoring data to help different teams work together effectively.
Get a high-level overview of Core Web Vitals on your website
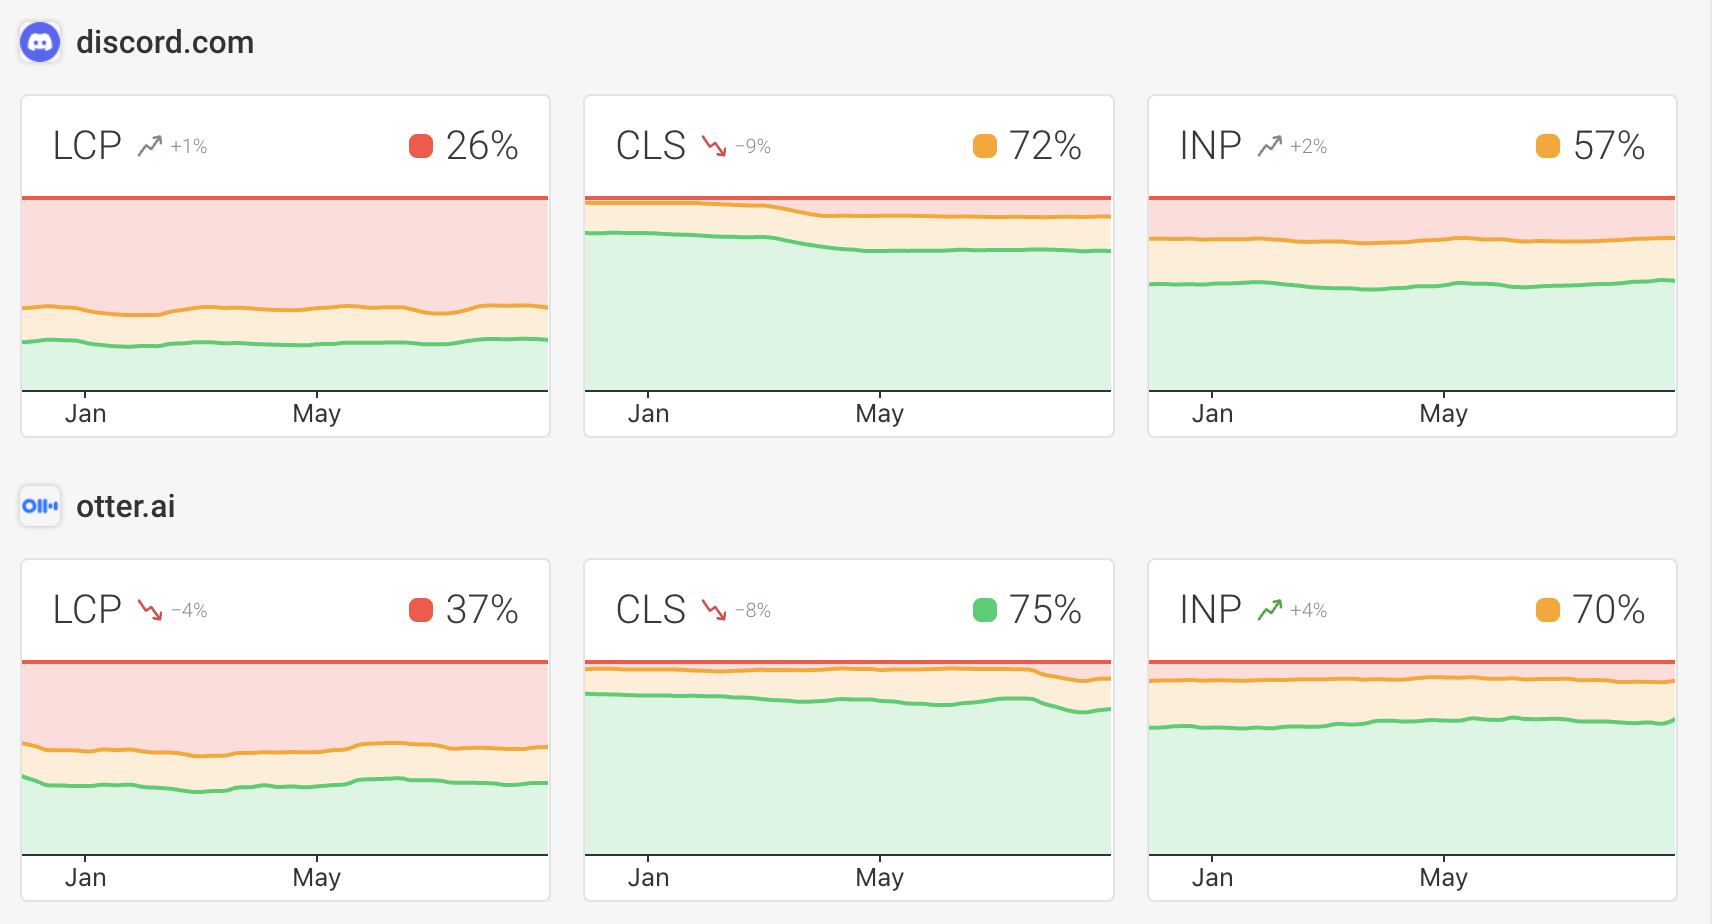
When your marketing team first investigates performance on your website, data from Google's Chrome User Experience Report (CrUX) is a great place to start:
- It covers the Core Web Vitals metrics that impact rankings
- It tells you how fast your website is for real users
The DebugBear page speed tests provide CrUX metrics alongside the detailed page speed report. You can also use our CrUX Trends dashboard to see how your website is doing and how you compare to the competition.
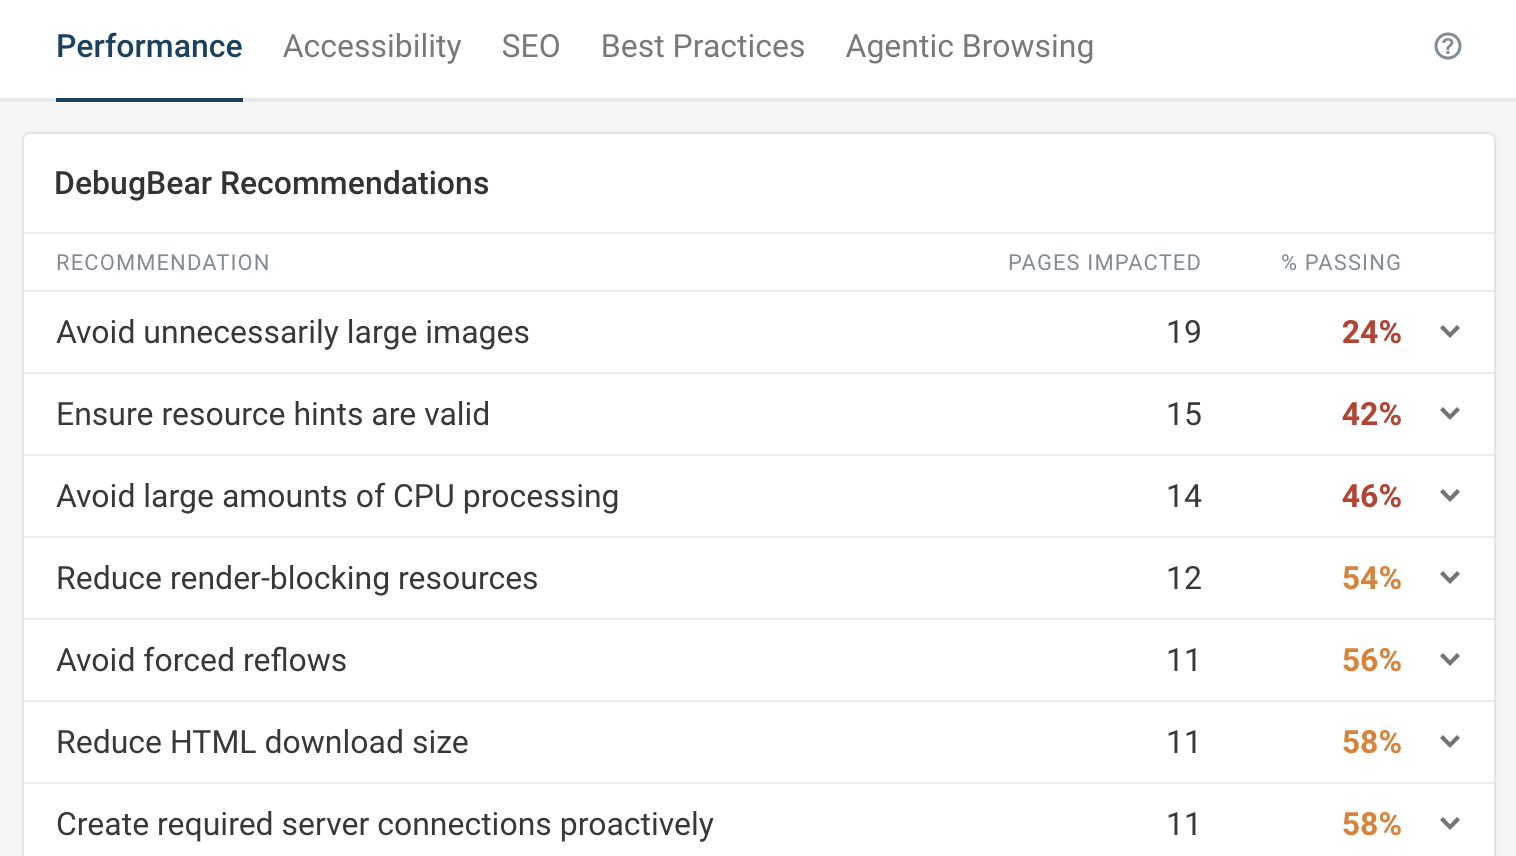
Another good way to get a site-wide assessment is the audits dashboard. This report includes all the pages you're monitoring and highlights the most common issues with performance and Lighthouse scores across your website.
You can also run a website scan to pick pages to monitor and to find high-traffic pages where Google provides URL-level CrUX metrics.
Identify and prioritize solutions
Once you know where users are having a poor experience you can start to investigate further. What part of the page is actually slow, and what can you do about it?
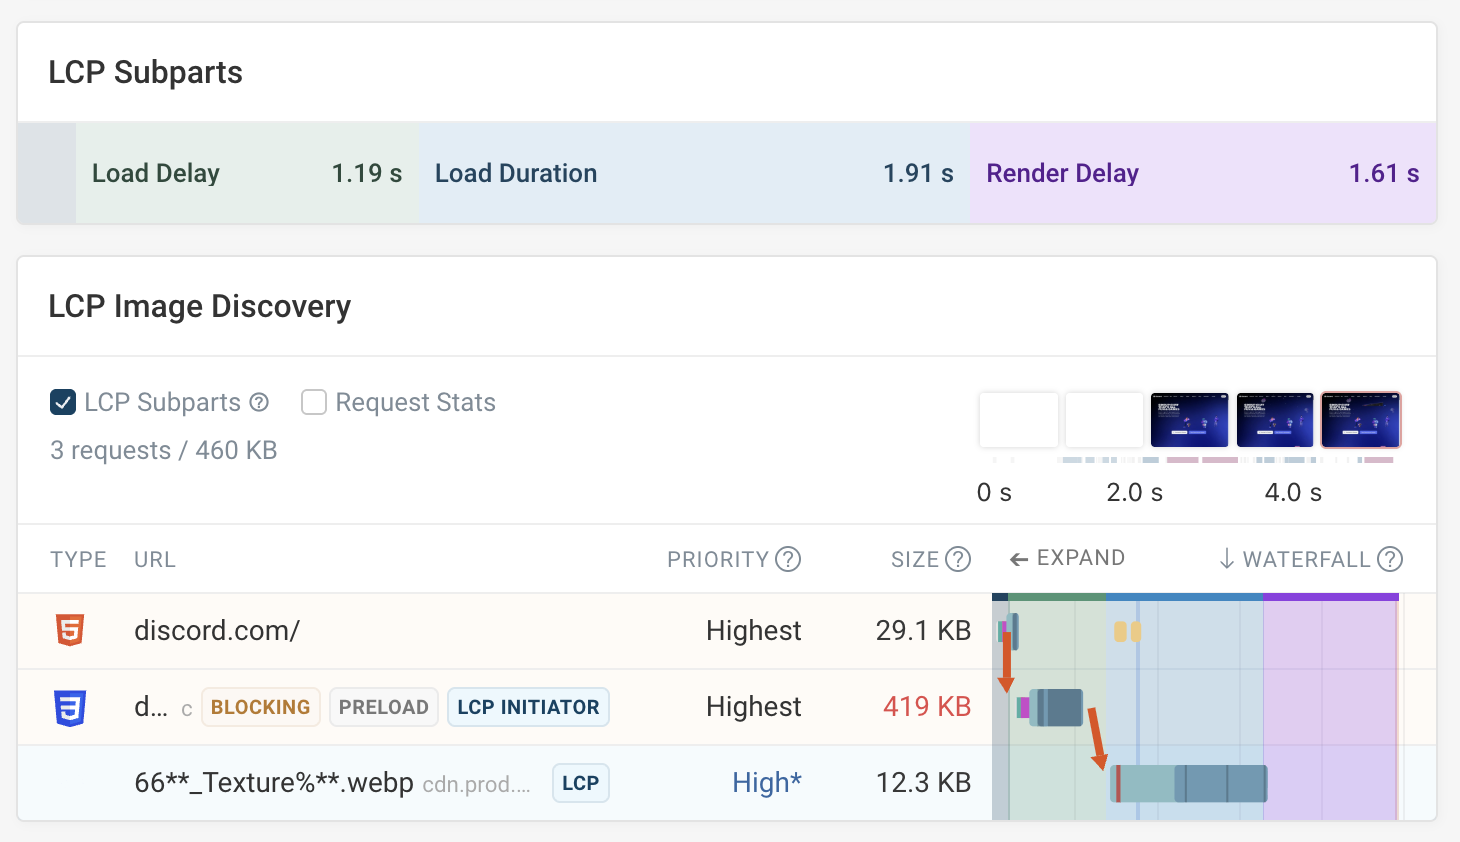
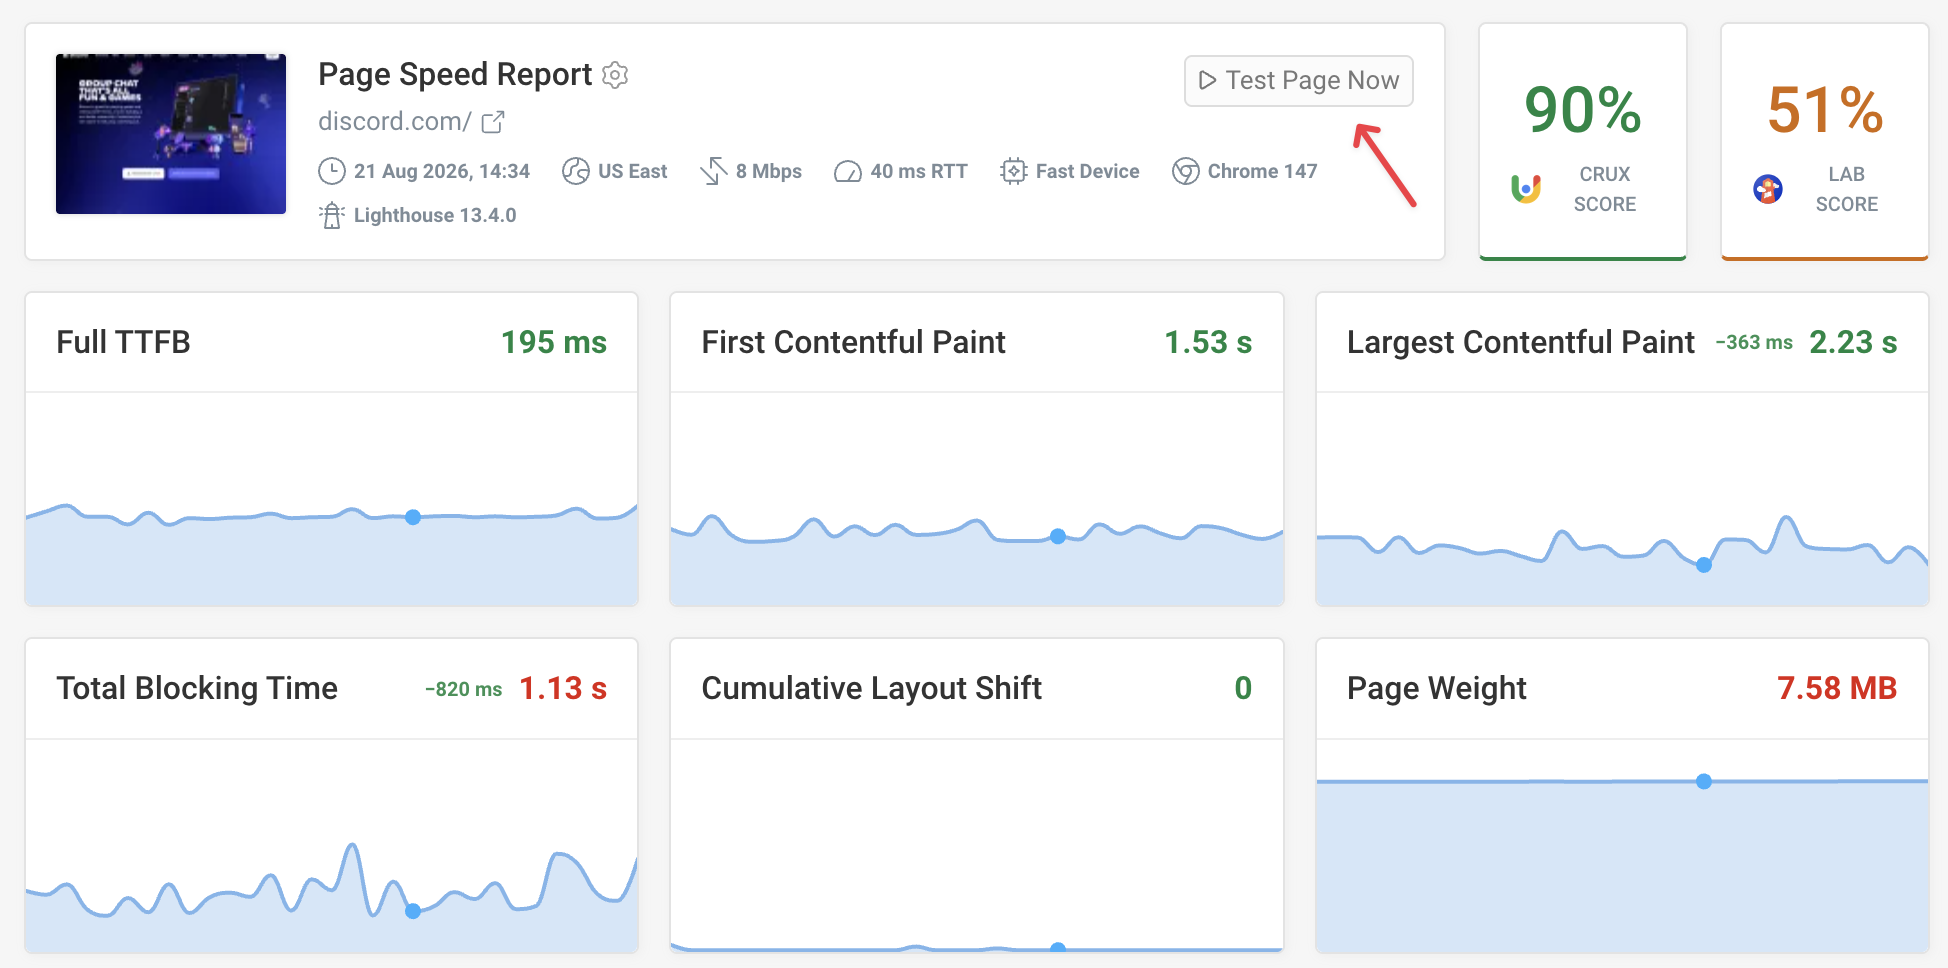
The DebugBear page speed report shows you what page elements impact metrics and user experience. From there you can deep dive into the technical factors that cause delays.
For example, the request waterfall shows you what resources the page is loading and how long they take to load.
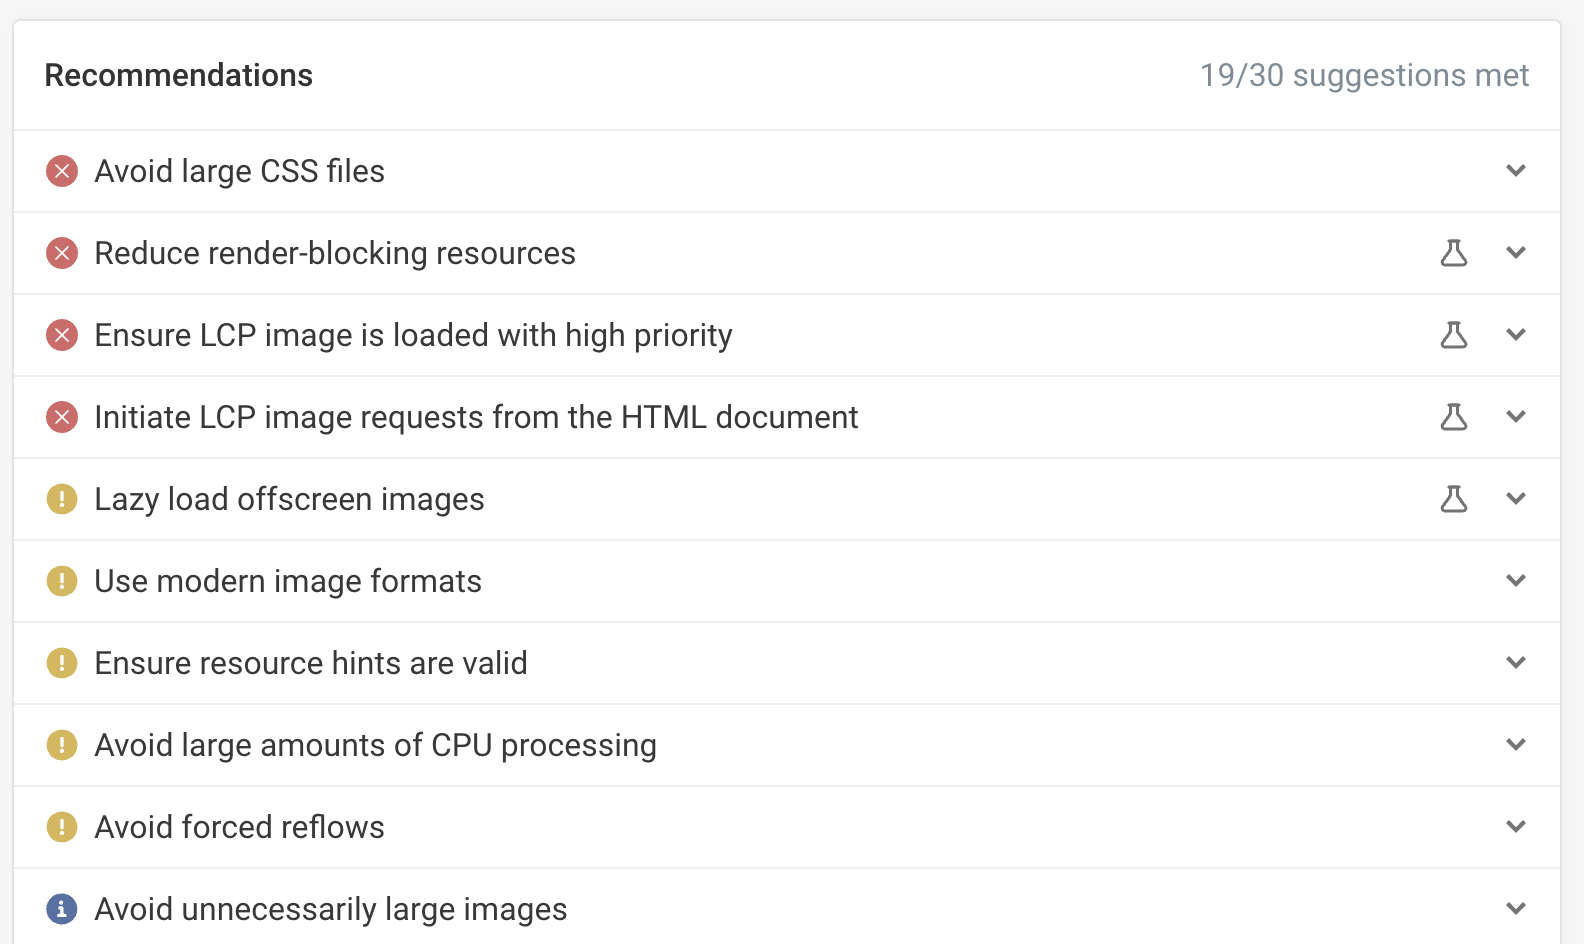
Each page speed report also includes a prioritized list of recommendations to make your site faster.
Marketing and development teams can discuss these together to identify which changes will have the biggest impact on user experience while also not being too complex to implement and maintain.
Implement and validate optimizations
Once you've made a change on your website you need to check that it's actually having the desired effect on your metrics.
You can click the Test Page Now button in the UI or trigger a test through our API. It's also possible to run performance tests as part of your Continuous Integration setup.
Tips for effective collaboration
The workflow above only runs smoothly if both teams are on the same page regarding your performance goals, and are looking at the data that matters most to them. These tips cover how to set that up.
Get your teams aligned on what the problem is
It's important for everyone on the team to understand how page speed is impacting end users. Here are two great ways to communicate issues:
- Video recordings: show how page content actually loads for users on a slow connection
- Real user metrics: show how actual visitors are impacted by performance issues
Here's a video from a DebugBear page speed report, showing how content renders gradually as the user is waiting.
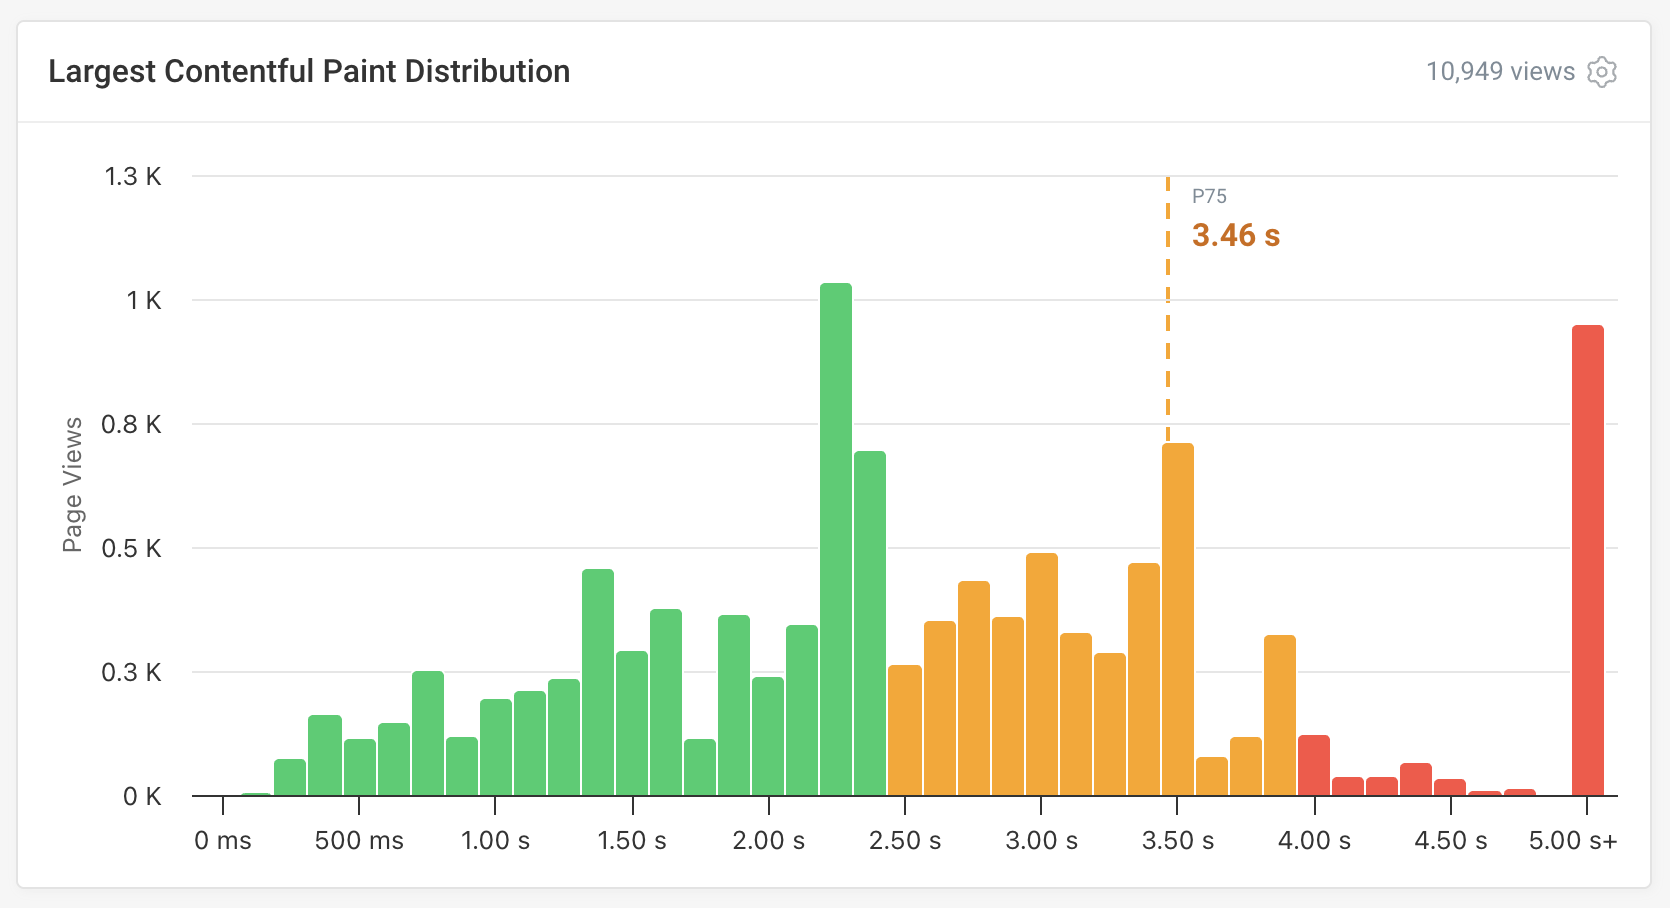
While synthetic tests just show user experience for one defined scenario, real user monitoring can surface how real visitor experiences are distributed. Usually your website will be fast for at least some visitors, while others struggle with delays.
Histograms break down how common different page load times are. CrUX focuses on the 75th percentile of experiences. But even if you provide a good experience for those users, 25% of visitors could still run into page speed issues.
You can also set up conversion tracking to demonstrate how web performance impacts your business.
Share data with all team members
Add team members across marketing and development to your DebugBear account. That way everyone has access to data and can get alerted to issues.
You can also generate shareable links that grant view access to your project. That way you can simply link to your dashboards from documentation pages or chat communication channels, and users without an account will be able to see your data.
Use experiments to validate changes before getting developers involved
Development teams are often busy working on product functionality, limiting the resources available to fix issues on the marketing website.
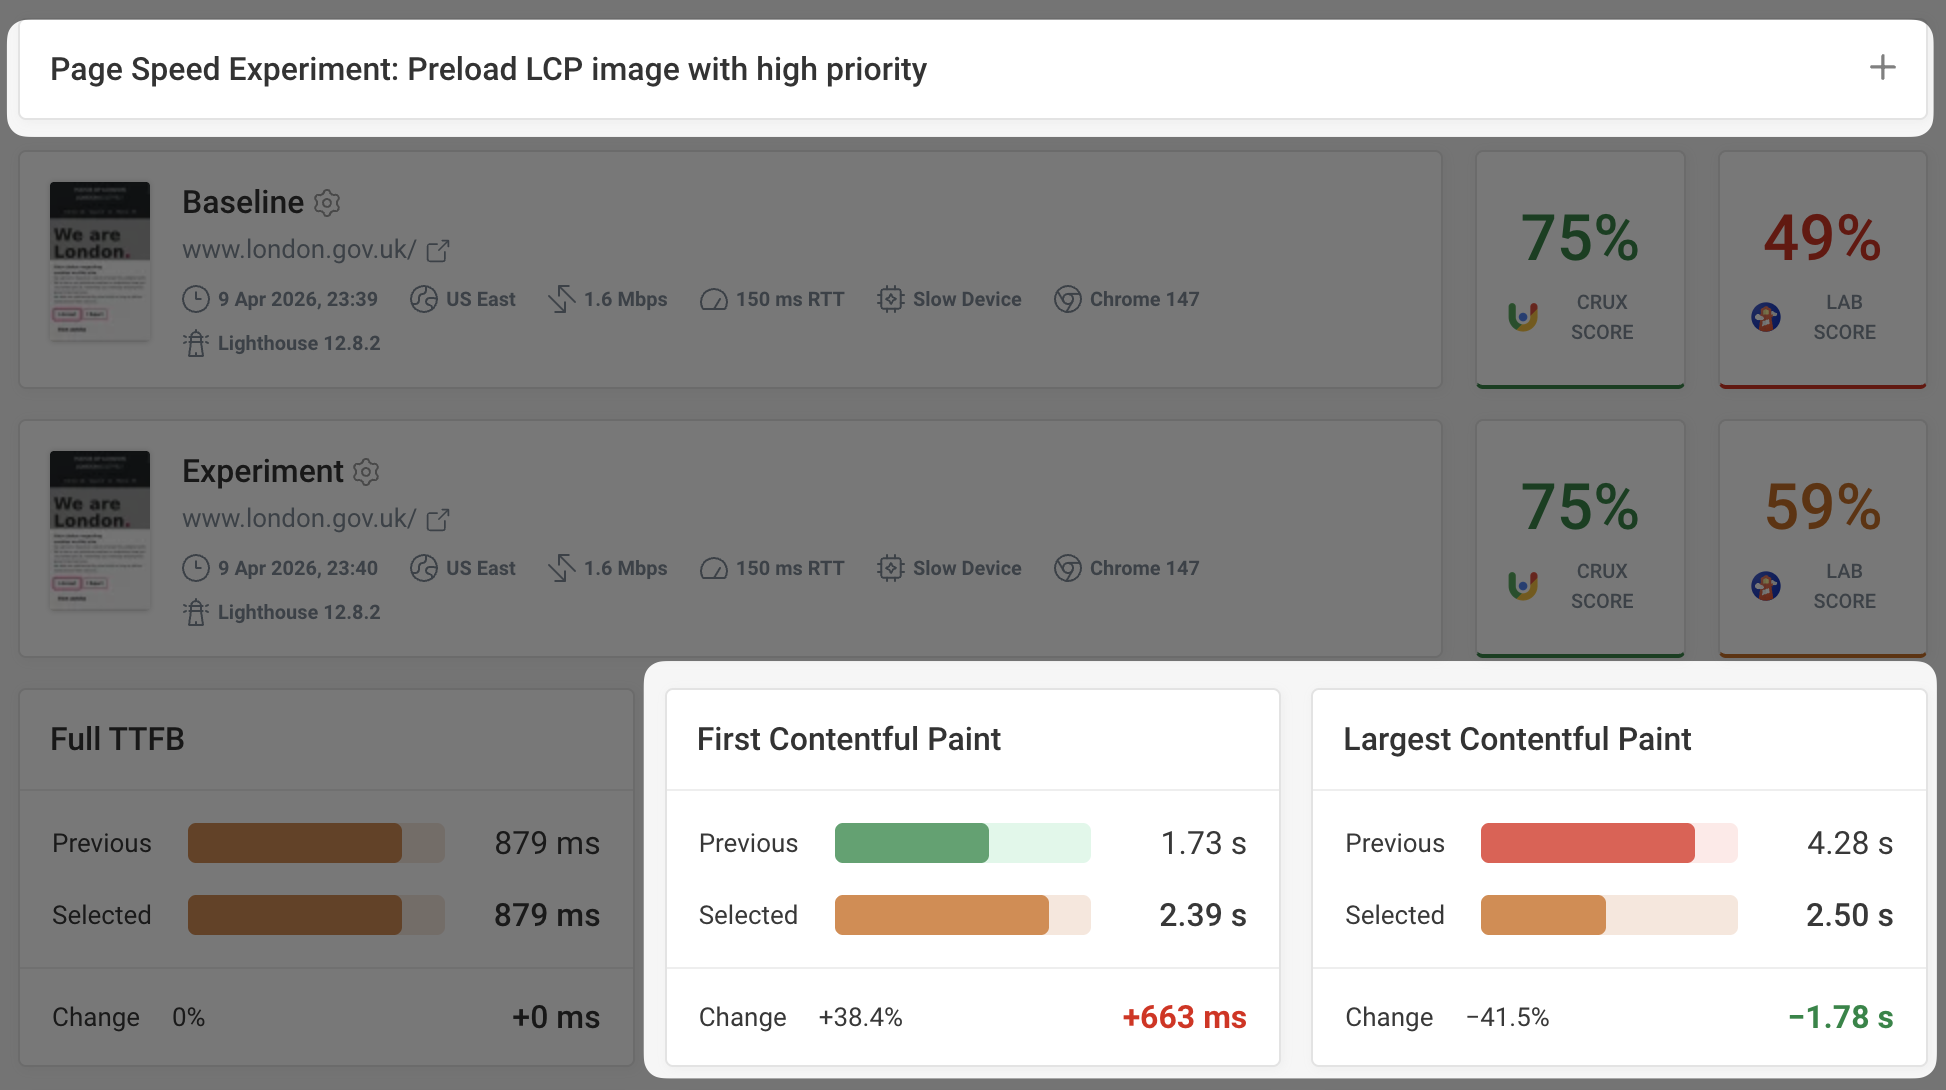
Instead of having a general discussion about how to improve performance, experiments make it easy to try out potential fixes and quantify their impact. That way your marketing team can provide more specific requests, like "Can we prioritize the main image on the product listing page?" And you'll have the data to show that this will have a meaningful impact on your metrics, rather than just being a nice-to-have.
DebugBear offers automatic experiments for some performance recommendations, but you can also manually make changes to the page HTML to try and apply optimizations.
Keep in mind that:
- After running an experiment, check that your website still renders correctly and that there are no new issues in the Console errors report
- Not every optimization that is easy to make in principle will necessarily be easy to apply consistently in your production system
Communicate website changes with chart annotations
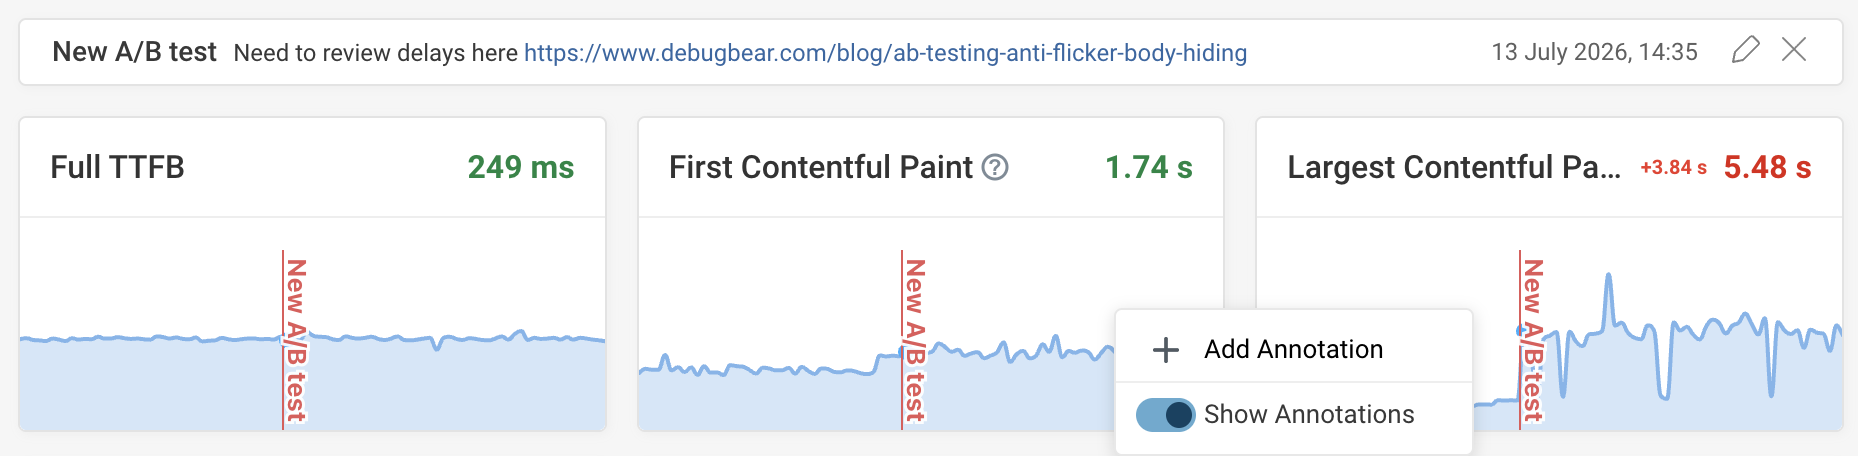
Your performance metrics will change as you make changes to your website. Use chart annotations to keep the rest of your team informed, so they don't waste time investigating regressions.
For example, when you launch a new version of your website or start a new ad campaign, you can add a note to your chart so everyone knows this could be the cause of any changes.
Include URLs in the description to link to tickets in your issue tracking software or to explanations of performance issues.
Set up purpose-built dashboards
Not everyone in your company needs the same information:
- Your management team only needs to know about high-level metrics and conversion rates
- Your SEO team might care about Core Web Vitals and Lighthouse scores
- Your development team might care about JavaScript bundle sizes or CPU tasks
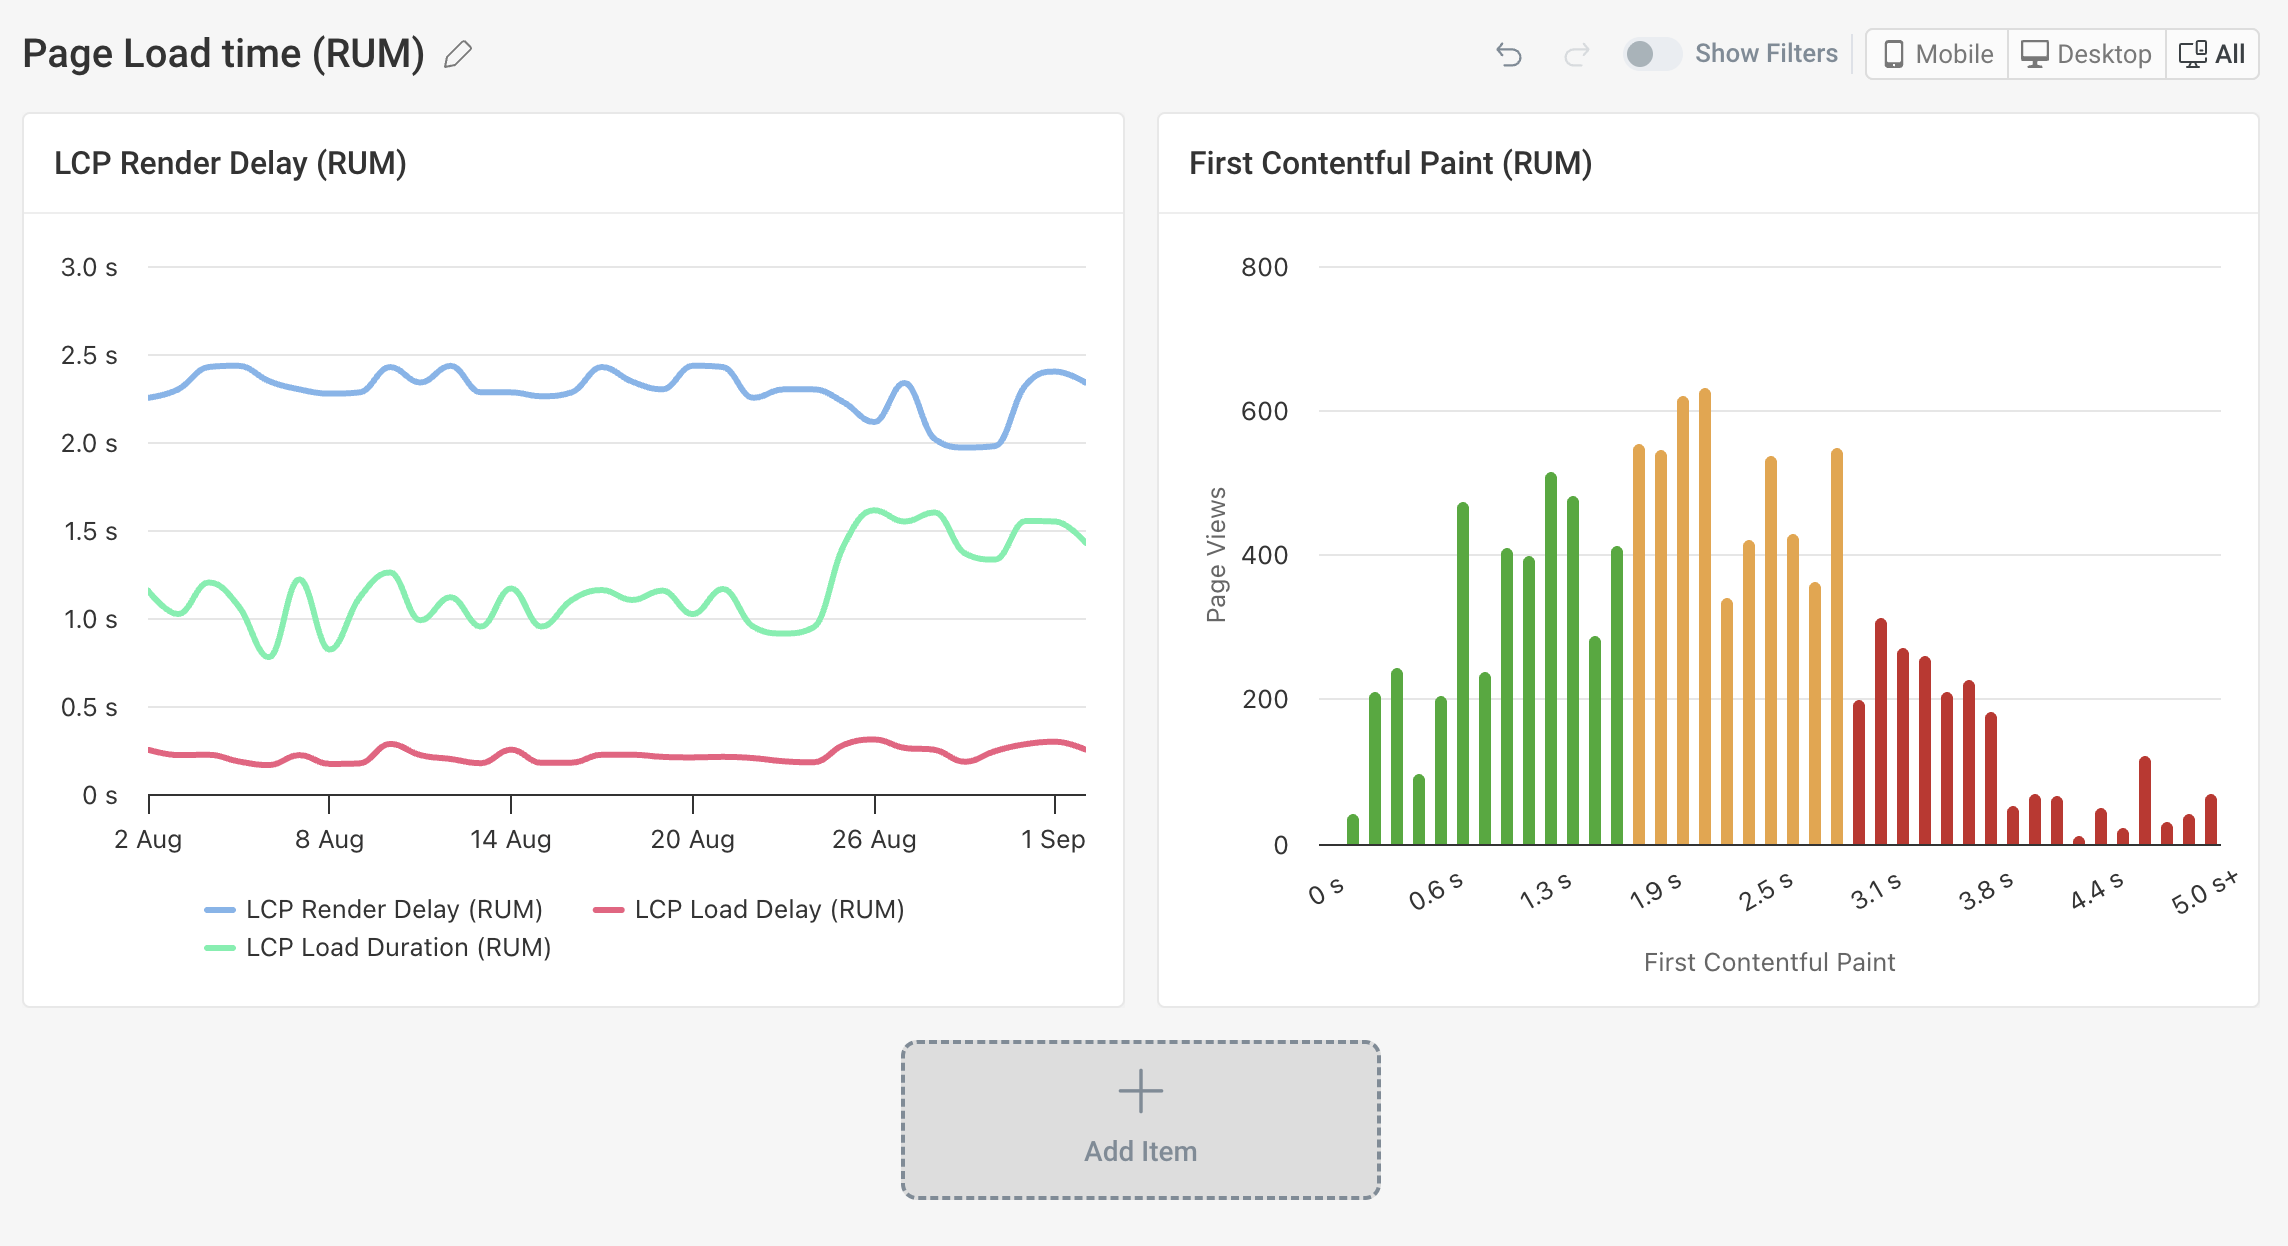
Custom dashboards make it easy to show just the data each team needs, and help team members focus on the metrics that matter to them. You can also include explanatory notes with your quarterly goals or context on current performance challenges.
Get notified about new page speed problems
When your metrics change you need to find out:
- Is there a new issue you need to investigate?
- Can your team celebrate a win?
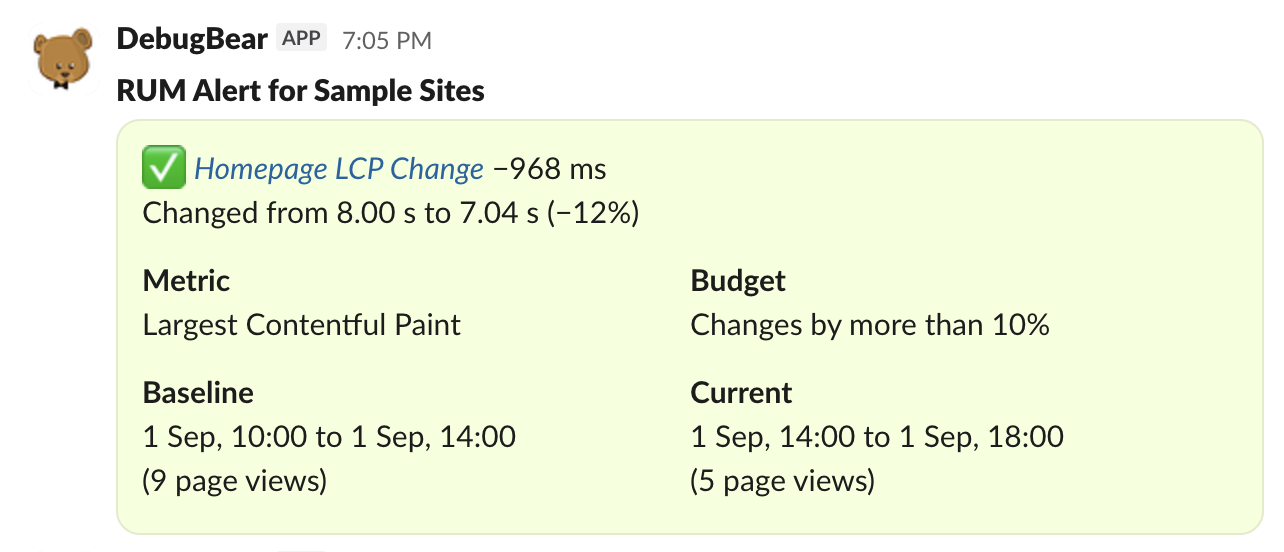
You can set up notifications for your performance data and customize alert criteria with budgets.
Different notification triggers let each team get just the alerts it needs. For example, if you monitor competitor websites along with your own, you might want to configure the alerts sent to your development team to just notify them of issues related to your own website.
DebugBear can send notifications by email, in Slack, or in Microsoft Teams. Chat messages make it easy for your team to start a discussion around the issue that's been reported.
Get comprehensive web performance insights
DebugBear is built to help teams optimize their website performance. It gives you one place to keep track of synthetic page speed tests, Google CrUX metrics, real user data, and website availability.
Monitor Page Speed & Core Web Vitals
DebugBear monitoring includes:
- In-depth Page Speed Reports
- Automated Recommendations
- Real User Analytics Data