
Ads often have a big negative impact on web performance. They frequently require large downloads and heavy CPU processing.
Yesterday, Google introduced new performance metrics to surface how ads impact user experience. You can find real-user data for these metrics in the Chrome User Experience Report, or check them yourself in Chrome DevTools.
New ad metrics in Google's CrUX report
The Chrome User Experience Report provides real-world performance data for millions of websites, based on aggregated Chrome user data. Most prominently, CrUX reports the three Core Web Vitals metrics that tell you how fast your website loads, how quickly it responds to user interactions, and whether the page layout is stable.
Google has now introduced four additional metrics focusing on ad performance:
- Ad Count: How many ads are displayed at once?
- Ad Density: On average, how much of the page is covered by ads?
- Ad CPU Weight: How much CPU processing time is caused by ad frames?
- Ad Network Weight: How much data is loaded by ad frames?
You can use tools like our website speed test or Google's CrUX Vis tool to access this data.
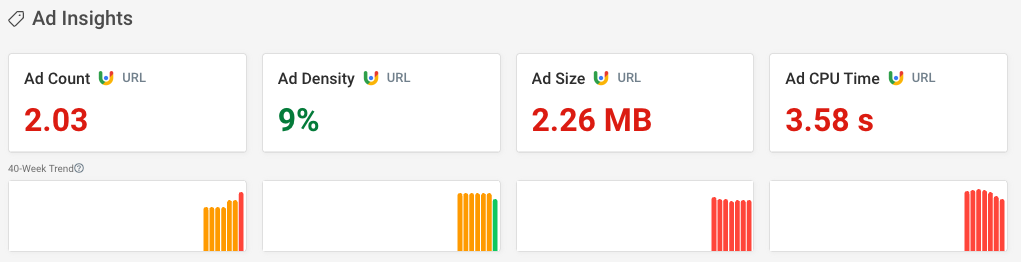
These new metrics provide insights into the impact of ads that previously weren't available. Publishers and ad networks can use this data to assess and reduce web performance issues caused by online adverts.
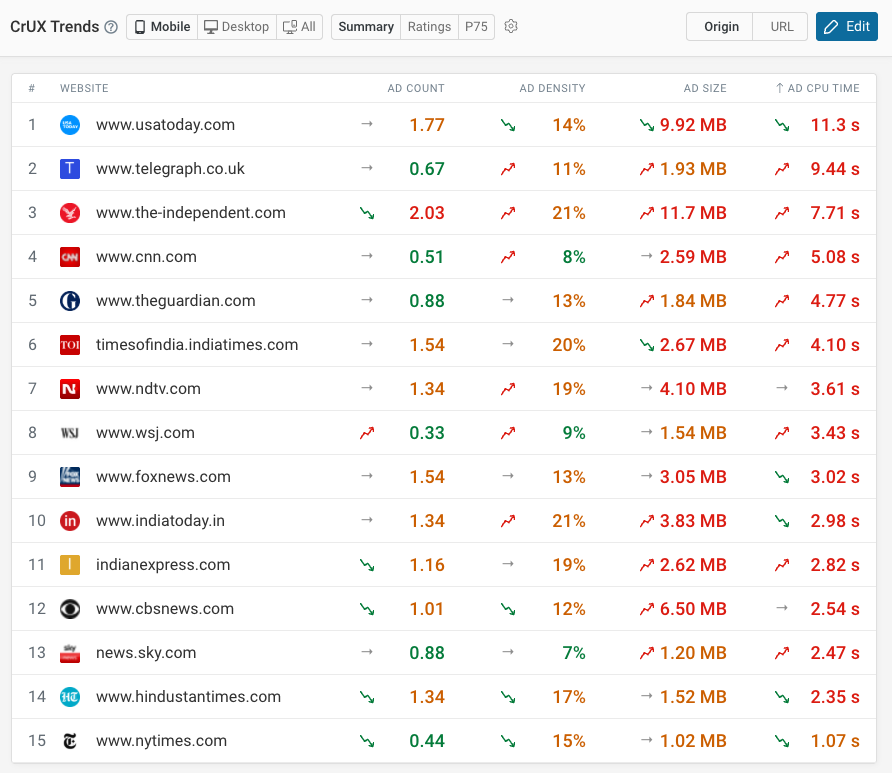
We can also use these metrics to create rankings showing how much the performance cost of ads varies across websites. For example, this dashboard shows a ranking of news websites based on how much extra CPU processing ads are causing.
What are the new metrics?
Let's take a closer look at the new metrics and what each one measures.
Ad Count
This metric tells you how many ad elements are visible on the page. An ad element could be an iframe, an image, or a video. Chrome checks this count every second and reports the average.
For example, we can see 4 ads in this screenshot:

So if a user sees 1 ad for 10 seconds and then 2 ads for 30 seconds, the ad count for that visit would be (1 * 10 + 2 * 30) / (10+30) = 1.75.
Ad Density
While the number of ads on a page is interesting, for the user it's more important how much of the page consists of ads and how much consists of the content they are interested in.
Ad Density measures what percentage of the page is covered by ad frames. For example, here 27% of the viewport is covered in ads.

Like ad count, this information is sampled every second and Chrome then reports an average.
Ad Weight: CPU
Ads don't just take up space but also require CPU processing to load and update. The CPU weight metric reports how much time the page spends running JavaScript code in ad frames. JavaScript execution of ad scripts in the main frame is not counted.
If we collect a CPU profile on a news website, we can see that the page consists of a large number of iframes. Most of them load and execute a meaningful amount of JavaScript code.
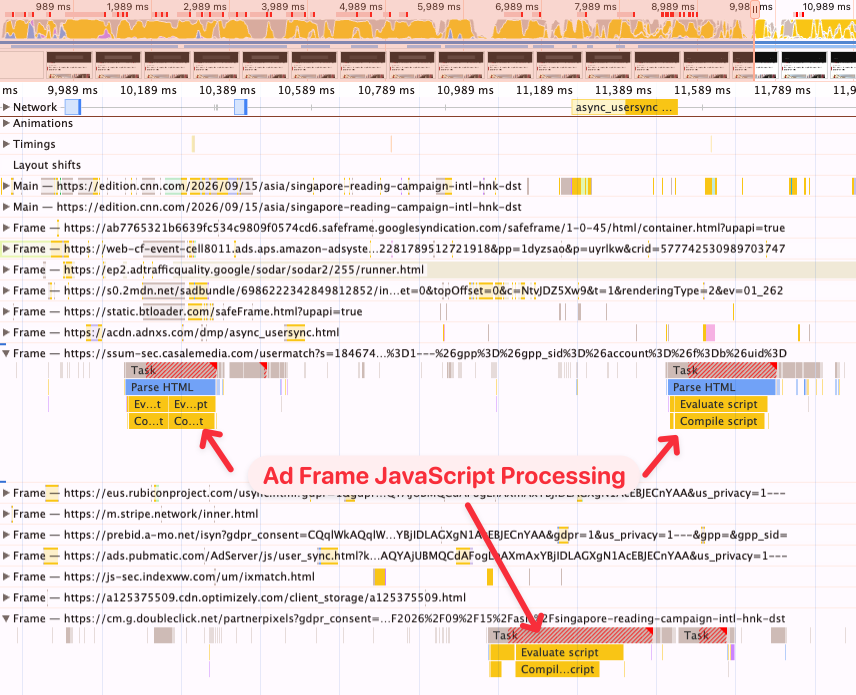
Unlike ad count and density, ad CPU weight is reported across the entire lifetime of the page, rather than looking at an average.
Ad Weight: Network
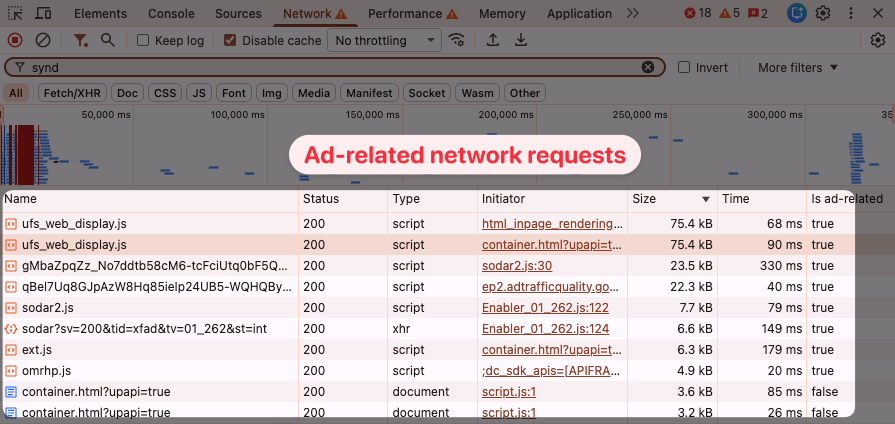
Finally, the network ad weight metric reports how much data ads are loading. You can see how many kilobytes or megabytes need to be transferred.
Like CPU weight, network weight is aggregated throughout the lifetime of the page.
This screenshot of the Chrome DevTools Network tab shows which ad-related resources are downloaded on the page.
How do the ad performance metrics work?
Google's CrUX report is based on data from logged-in Chrome users who have opted in to analytics reporting. Chrome measures these ad performance metrics and reports them back to Google servers.
If a website receives enough data reports to preserve user privacy, Google then makes aggregate metric data for the website publicly available.
There are three important factors to keep in mind when interpreting the final reported value:
- Google reports the 75th percentile value. Most visitors have a better experience, but 25% of visitors experience a worse impact than shown by the metric.
- Only visits with ads are considered. A user with an ad blocker would be excluded from aggregated scores.
- CrUX data is aggregated over a 28-day period. Any changes you make will take some time to show up in the metrics.
What websites are included?
CrUX only reports ad metrics for websites that show third-party ads and have an ads.txt (Authorized Digital Sellers) file.
In general, websites need to be indexable and somewhat popular before they are included in the CrUX dataset.
How does Google detect ad frames and resources?
Chrome detects whether an iframe is an ad by looking at the document URL. It uses a subset of EasyList to decide if the URL belongs to an ad network.
Individual resources outside of an ad frame can also be detected as ad-related. They will then contribute to the ad network weight metric.
In addition to checking the URL of requests, Chrome also looks at the JavaScript stack to decide if an ad script is requesting an additional ad-related resource.
Ad performance reporting in Chrome DevTools
In addition to the CrUX metrics, Google is also introducing a new Ads reporting panel in Chrome DevTools.
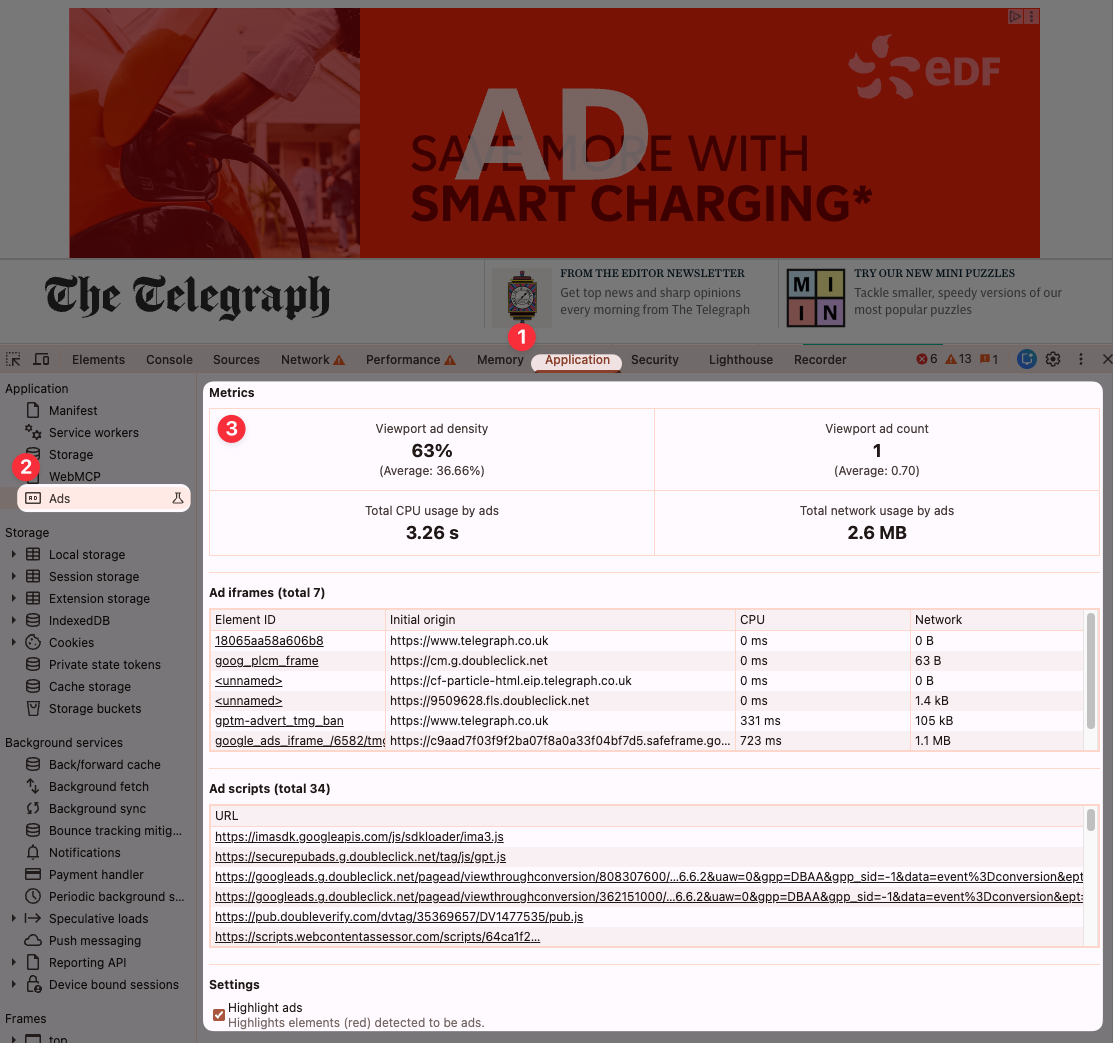
You can try it in Chrome Canary right now. Just open DevTools, select the Application tab and then open the Ads UI from the sidebar.
Here you can see the values of the four ad performance metrics as well as a list of iframes and scripts that impact the page.
I've also ticked the Highlight ads checkbox to add the red highlight for each ad frame.
What makes this new CrUX data especially interesting?
Publishers can use real user monitoring tools to get insight into the performance of content that's hosted on their own domain. But for security and privacy reasons, these tools can't access performance data from within iframes, which is how ads are most commonly embedded on websites.
Google's new data changes that: it's now possible to view real user data on how ads impact user experience. Lab tests with tools like Lighthouse can provide some insights on this, but they don't correctly reflect real-world usage and interaction patterns or the types of devices visitors are using.
How do ads impact Core Web Vitals?
Google's ad performance metrics show whether ads are using CPU and network resources. But does this extra activity actually take resources away from the main page content and cause worse Core Web Vitals scores?
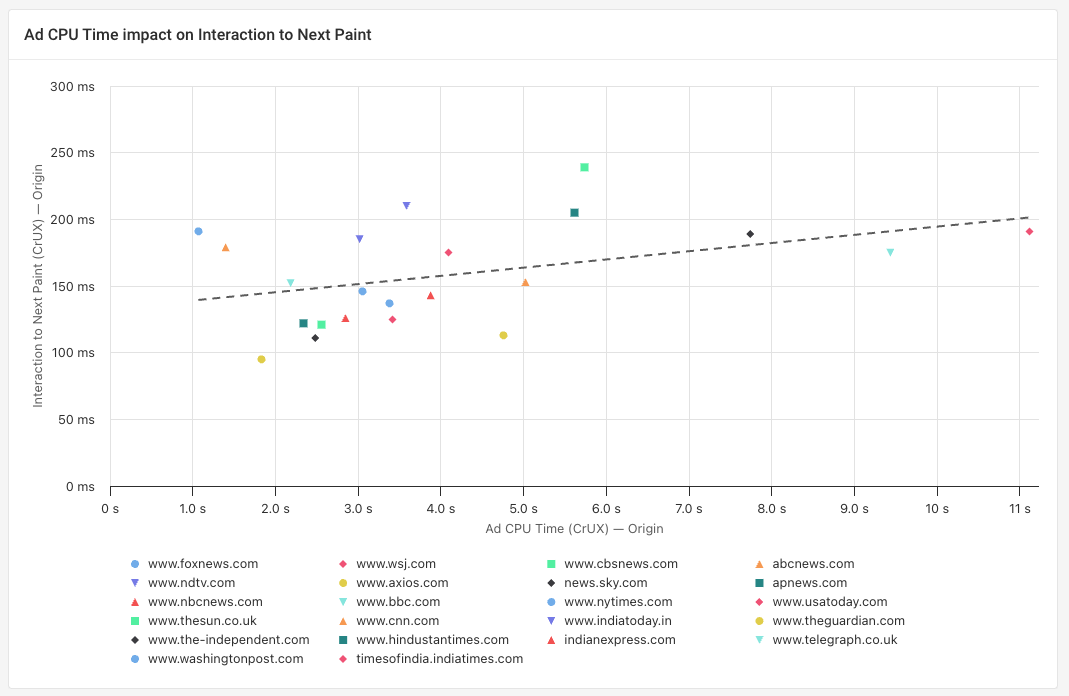
We can set up a custom dashboard in DebugBear and add a scatter plot to find out.
This screenshot shows that websites with more ad activity tend to have worse Interaction to Next Paint scores.

Monitor Page Speed & Core Web Vitals
DebugBear monitoring includes:
- In-depth Page Speed Reports
- Automated Recommendations
- Real User Analytics Data