Running web performance experiments
DebugBear experiments allow you to run a site speed test with modified page HTML.
For example, you can:
- Remove render-blocking scripts (or make them async)
- Add or remove preload hints
- Add or remove priority hints
- Add a
styletag setting amax-widthto reduce layout shift - Change the URL of an image
How to run an experiment
- Open the results of the page you want to test
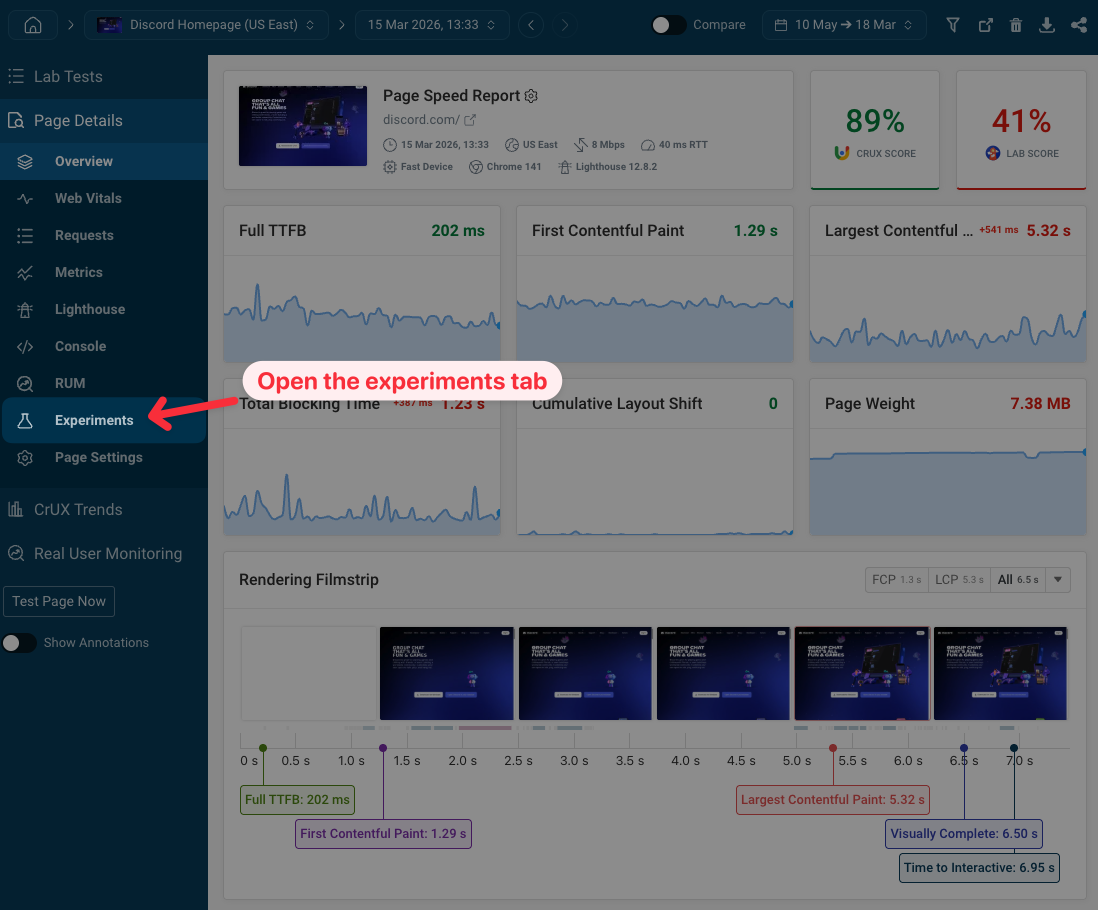
- Select the Experiments tab
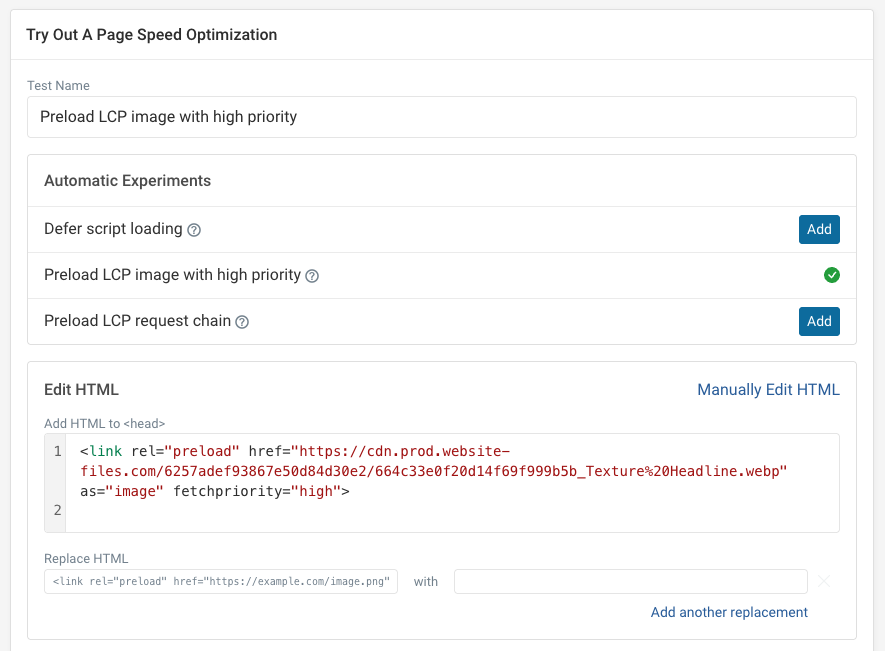
- Add new HTML to the head or insert suggested change automatically by clicking Add
-
Name the experiment based on the change you're testing
-
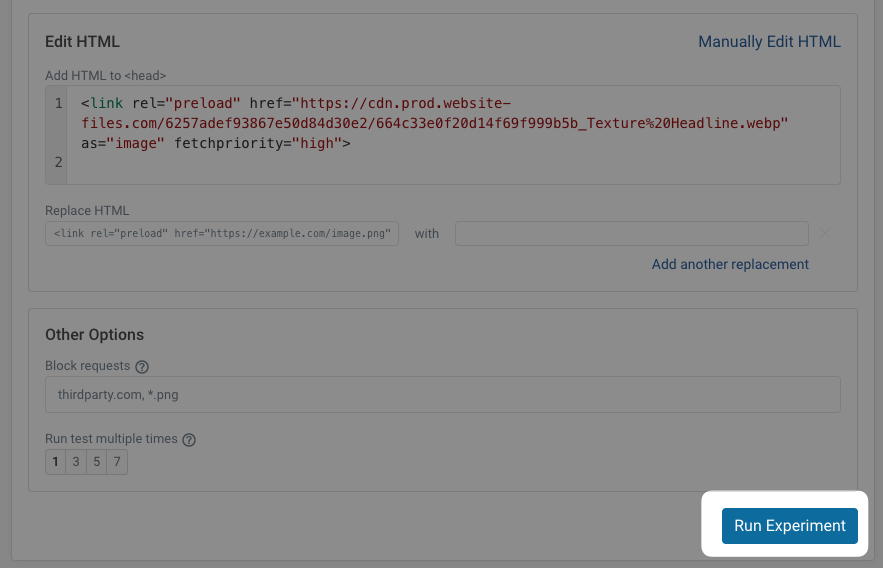
Click Run Experiment
- Wait for the test to complete
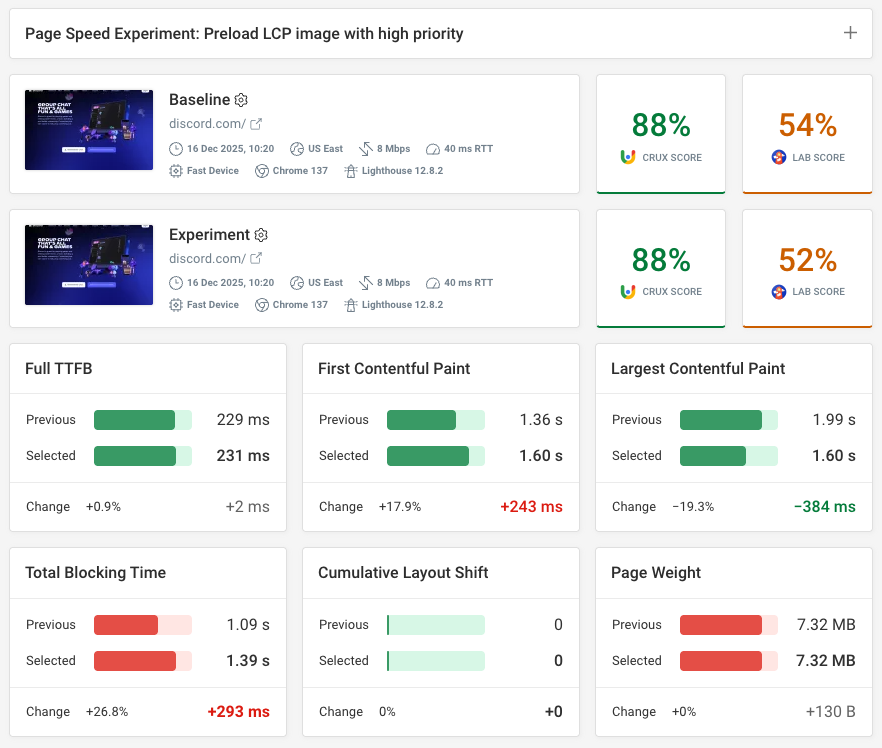
You can then see the impact of the change. In this example, the LCP score was improved as the image was preloaded with a fetchpriority="high" attribute.
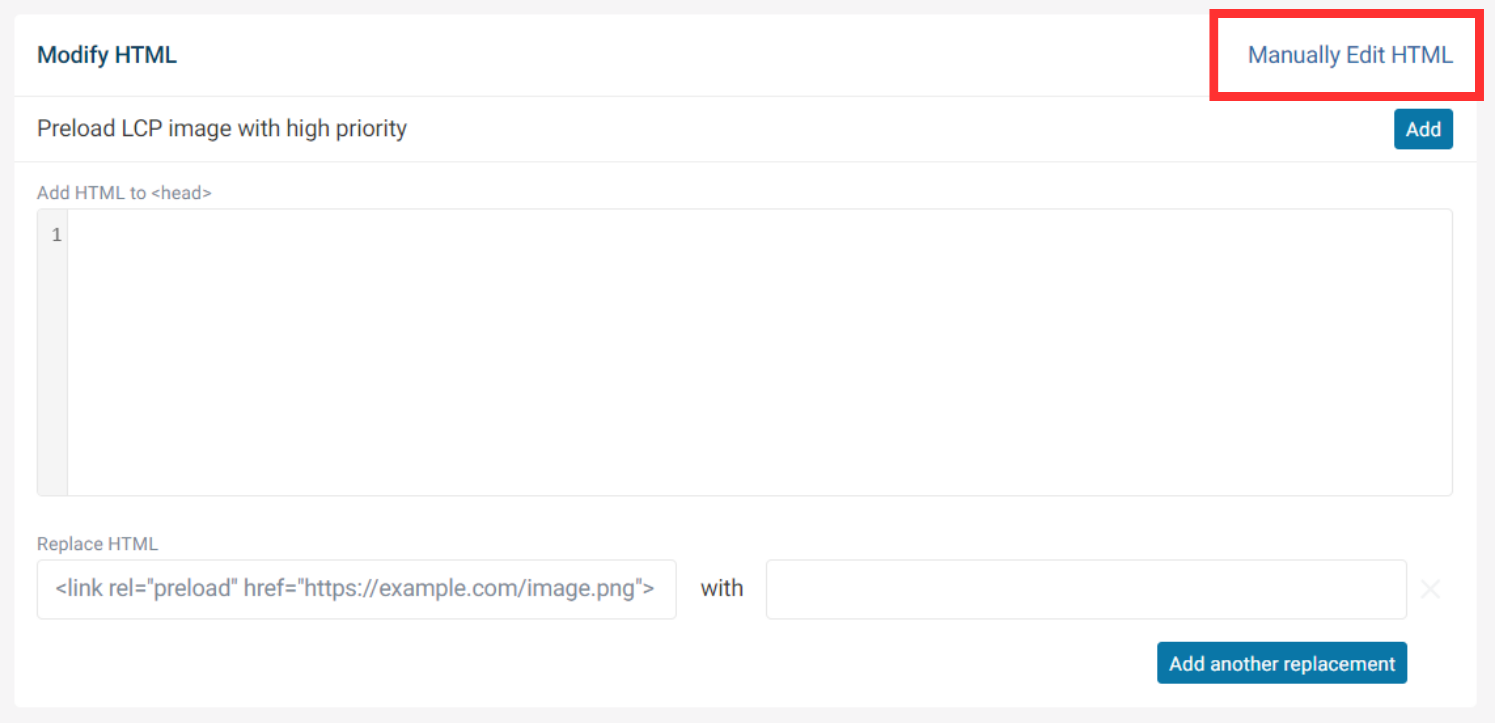
Manually Edit HTML
Clicking the Manually Edit HTML button will show the entire HTML document and allow you to make changes to it.
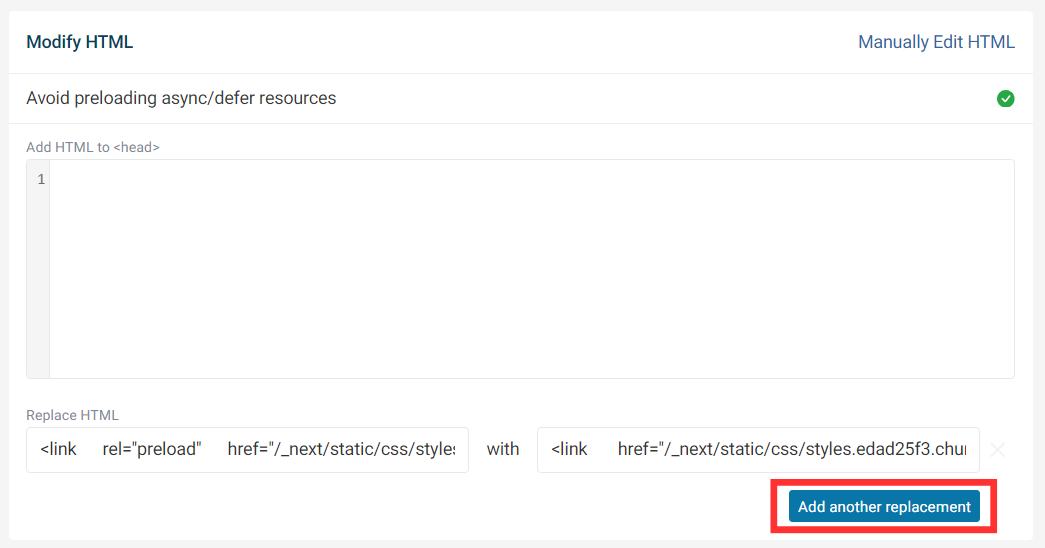
Replace HTML
If you want to replace a single line of HTML, paste the element alongside the desired change. You can add more changes in this way by clicking Add another replacement.
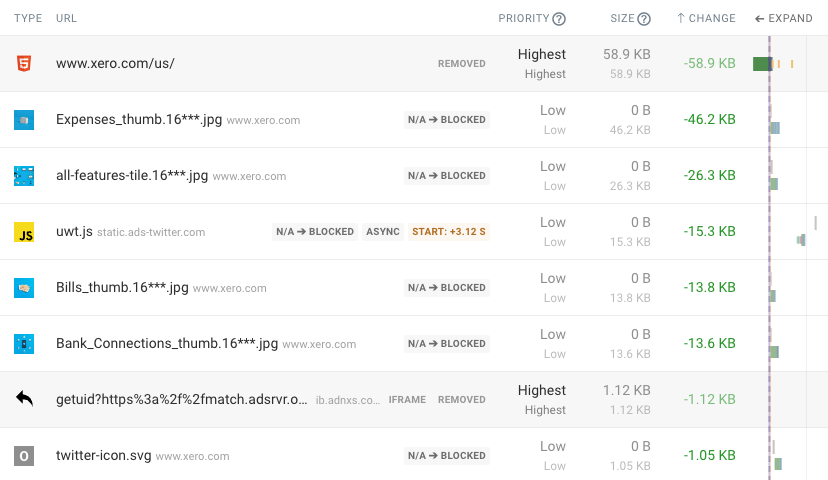
Blocking network requests
In addition to modifying the page HTML you can also block network requests that match a certain pattern, for example a file extension or a domain name.
Use commas to apply multiple URL patterns.

The relevant requests will then show up as blocked in the results and the page weight will be lower.
Suggested experiments
If there are suggested experiments available they will appear above the HTML head. Just click Add on the change you want to make to set the experiment up.
Preload LCP image with high priority
This suggestion will add a preload link with a fetchpriority="high" attribute for the LCP image to the HTML head.
Avoid preloading async/defer resources
This suggestion will place all async and defer links individually for you to remove the preload attribute in the replacement box.
Examples of site speed experiments you can run
Adding priority hints
Priority hints can tell the browser which resources are important and should be loaded early. For example, images responsible for the Largest Contentful Paint should be loaded with high priority.
You can use the request waterfall to identify the URL of the LCP image, and then modify the image tag to add a fetchpriority="high" attribute.
Removing render-blocking resources
Render-blocking resources have a big impact on website performance as no content will show up until they are loaded.
Modify the page HTML to remove these resources or add async attributes to script tags to make them no longer render-blocking.
Adding or removing resource hints
Resource hints like preload and preconnect can tell the browser about resources that it wouldn't otherwise discover until later.
For example, let's say you load a Google Fonts CSS file that references a font file. Normally the browser wouldn't discover the font file until after the CSS has loaded.
Adding a preconnect hint to the <head> of the page HTML could establish a server connection to fonts.gstatic.com as soon as the page starts loading, so the connection can be used immediately when the font file is discovered.
<link rel="preconnect" href="https://fonts.gstatic.com" />
Resource hints can slow down your website if used incorrectly, so you can also try removing them to see how that impacts performance.
Adding CSS styles
Cumulative Layout Shift issues can often be addressed by adding a min-height to elements that change size when content is loaded, for example images.
Simply insert a style tag into the HTML to try out your optimization.
<style>
  #my-container {
    min-height: 200px;
  }
</style>
Interpreting the results of experiments
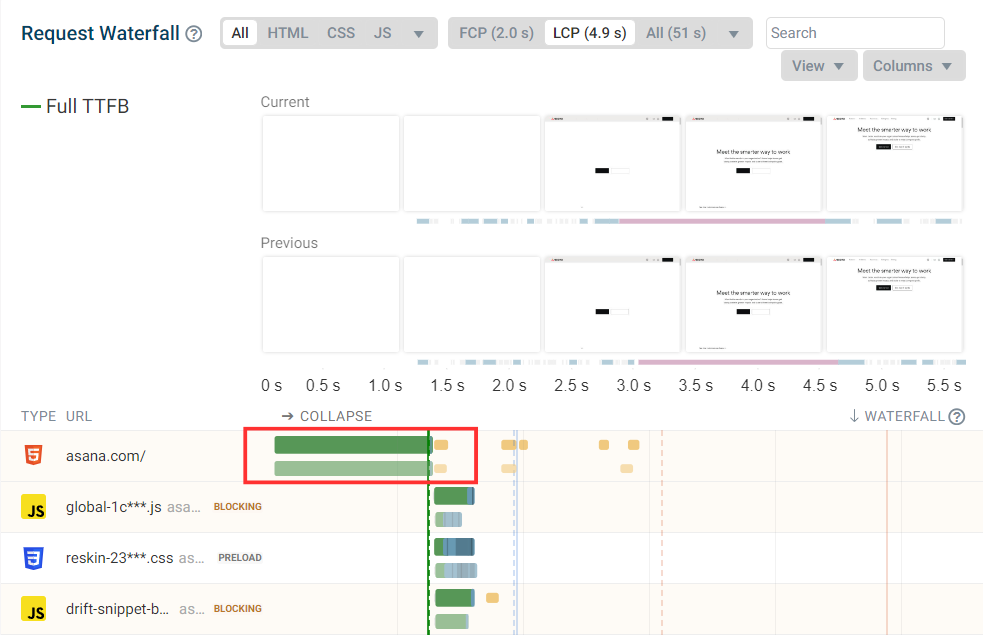
When an experiment is run you will not see a breakdown of the document request. Instead of showing a server connection only a single long HTTP request will be shown.
Your website likely experiences a significant amount of background performance variation. If the performance impact of a change is small, it may not be noticeable.
Re-run Experiment
If you wish to continue experimenting with a page, you can make changes to the HTML and test again.
On the results page, open up the experiment details.

Scroll down and click Re-run experiment.

This will open up the experiments page where you can customize your HTML and click Run experiment to re-run the experiment again.
Experiments not working as expected
Sometimes pages may not render correctly when running an experiment. For example, no styling may be applied.
This sometimes happens when CSS files used by the page are no longer hosted on the website, for example after a new deployment. In that case, simply run a new test on the live site and then try running an experiment again.
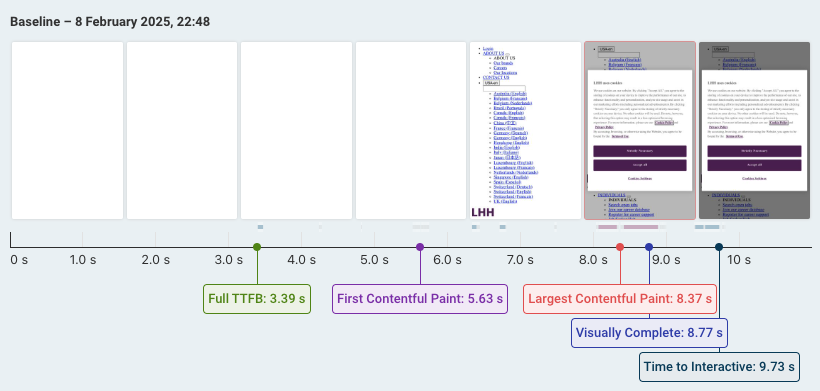
If tests aren't working as expected you can also check the Console tab for any JavaScript errors. For example, JavaScript hydration may not work if the DOM has been modified.