Better web vitals data and easier request waterfall analysis.
Web Vitals tab
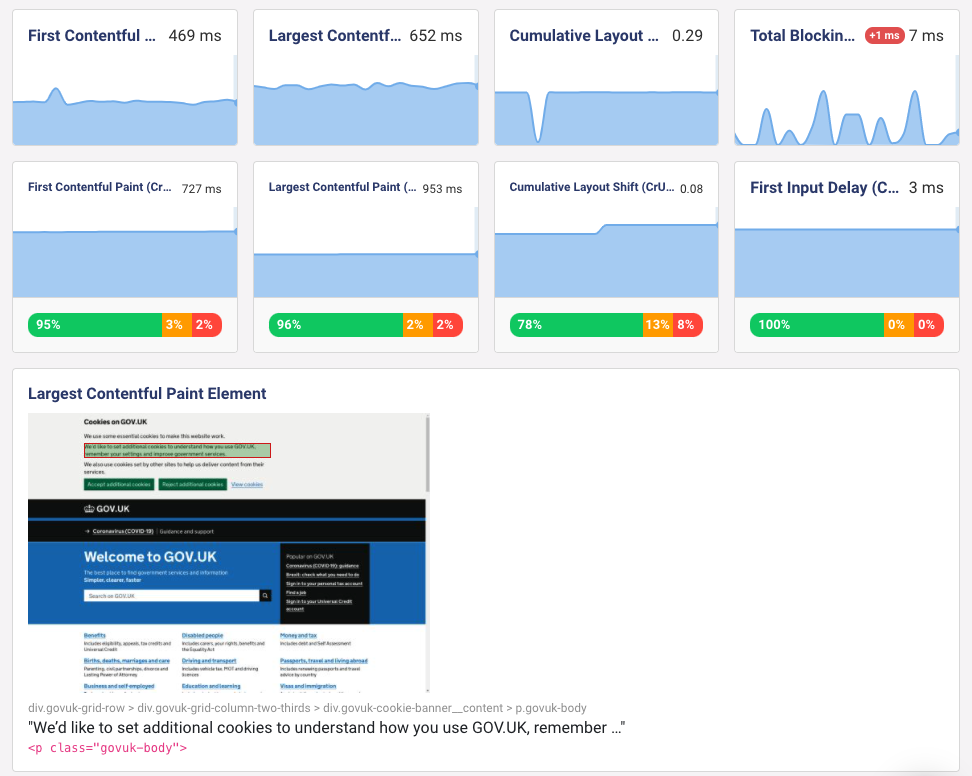
If you want to optimize Web Vitals DebugBear now provides all the metrics in one place. You can also see the DOM element that caused the Largest Contentful Paint, and a list of the layout shifts that occurred on the page.
In addition to the DebugBear lab data, the tab also shows real user metrics from the Chrome User Experience Report.
Improved request waterfall
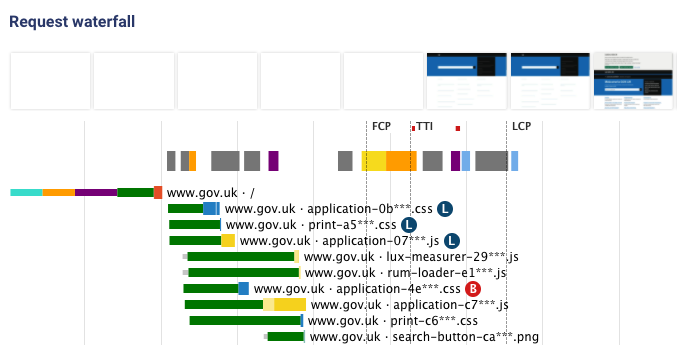
The request waterfall now shows badges for render-blocking requests (B) and resources that are preloaded (L).
Improved trendlines
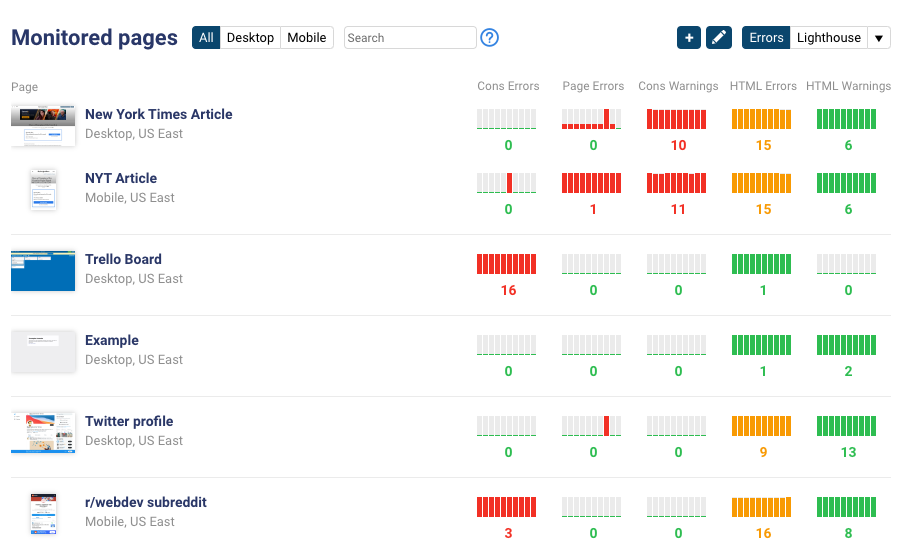
You can now choose to view daily instead of weekly trendline data. In addition to trendlines for Lighthouse scores and Performance metrics you can now also look at HTML and console errors.
Upgrades to Chrome and Lighthouse
DebugBear now runs tests using Chrome 92 and Lighthouse 8.3.0.
Blog posts
Why does Lighthouse lab data not match field data? – PageSpeed Insights often shows very different values for the two types of metrics, and this article explains why that is. CSP error noise caused by Chrome extensions – I tested 1000 Chrome extensions to see how many of them cause false CSP error reports.