Now you can export your reports as PDFs, get more useful INP and CLS data for single-page applications, see your overall Core Web Vitals score at a glance – and more.
Export any report as a PDF
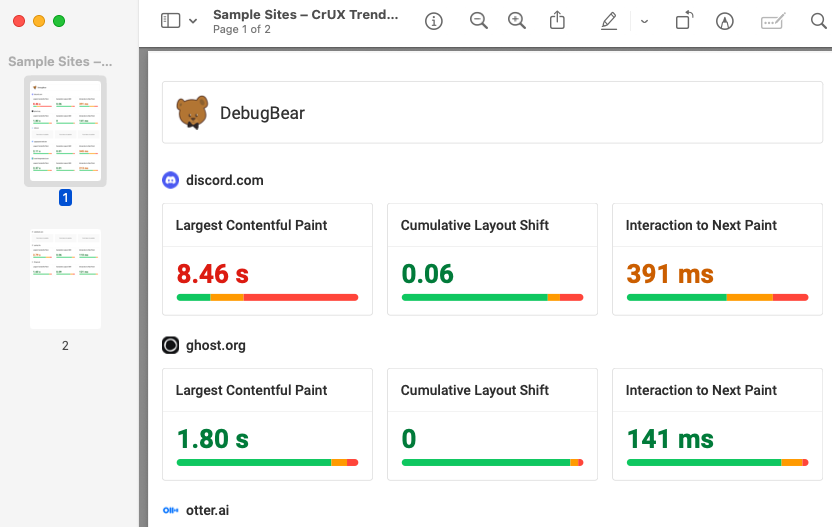
We've made it easier to share good news on site performance – or emerging issues that need attention. You can now export all kinds of dashboards and reports on DebugBear, from CrUX trends to page speed tests. Just use the export button in the top-right of the page.
RUM dashboard update
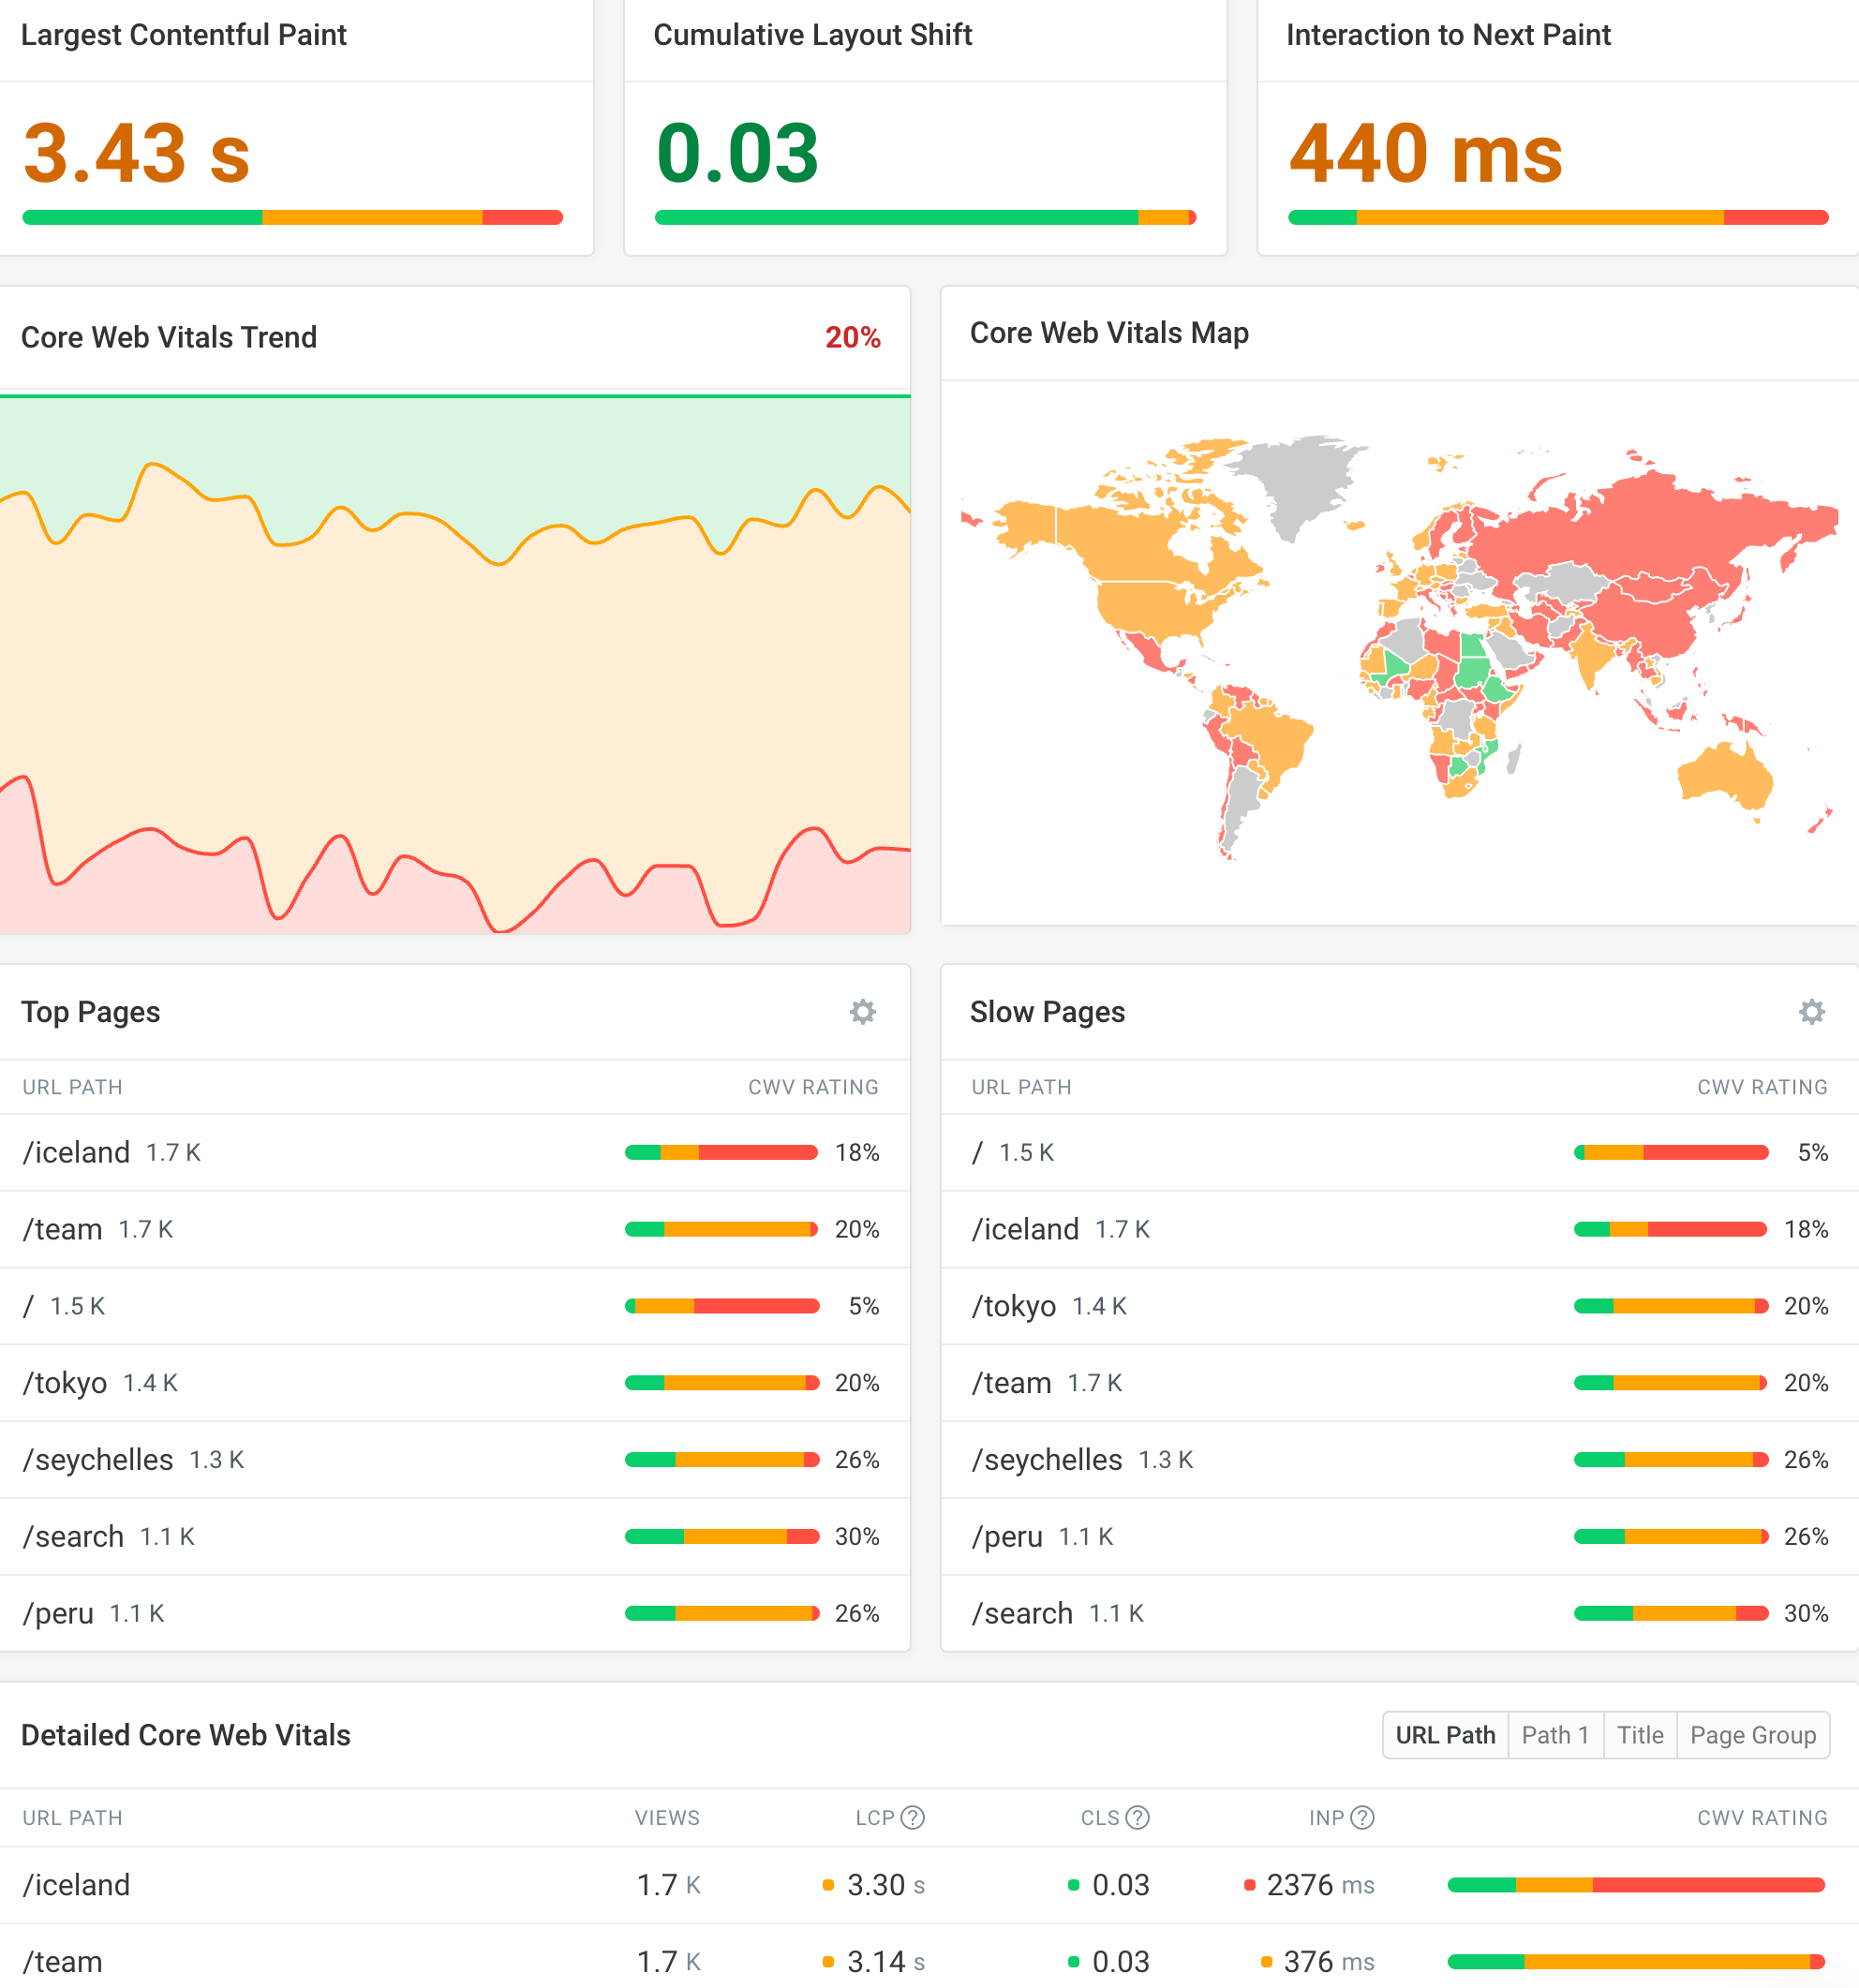
Checking out the Core Web Vitals of your site users? We've made things a little easier on the eye, and we now call out the percentage of good visitor experiences for your Top and Slow pages, so it's simple to check where you stand against that crucial 75% benchmark.
Better comparison view for RUM data
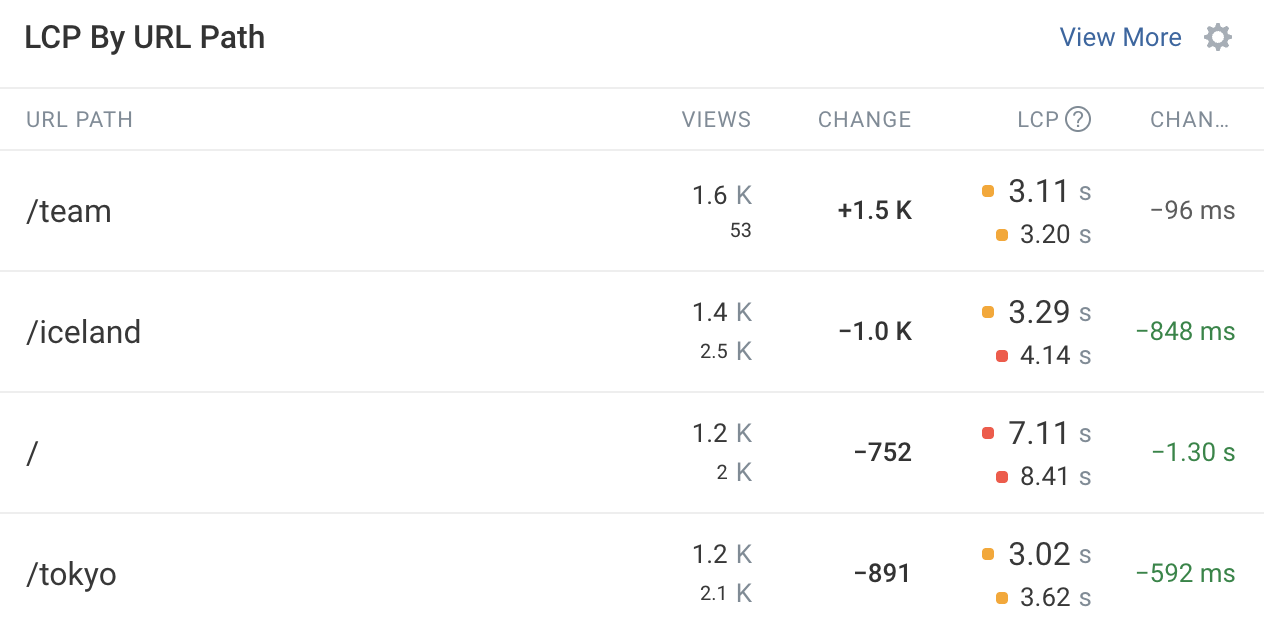
We've redesigned some of the tables in our Real User Monitoring view, to make comparing key stats across different time-frames easier.
Improved breakdown of INP tasks
When you check out how recent pageviews have performed against INP metrics, you'll get a better view of relevant CPU tasks, with icons and filenames of particular scripts.
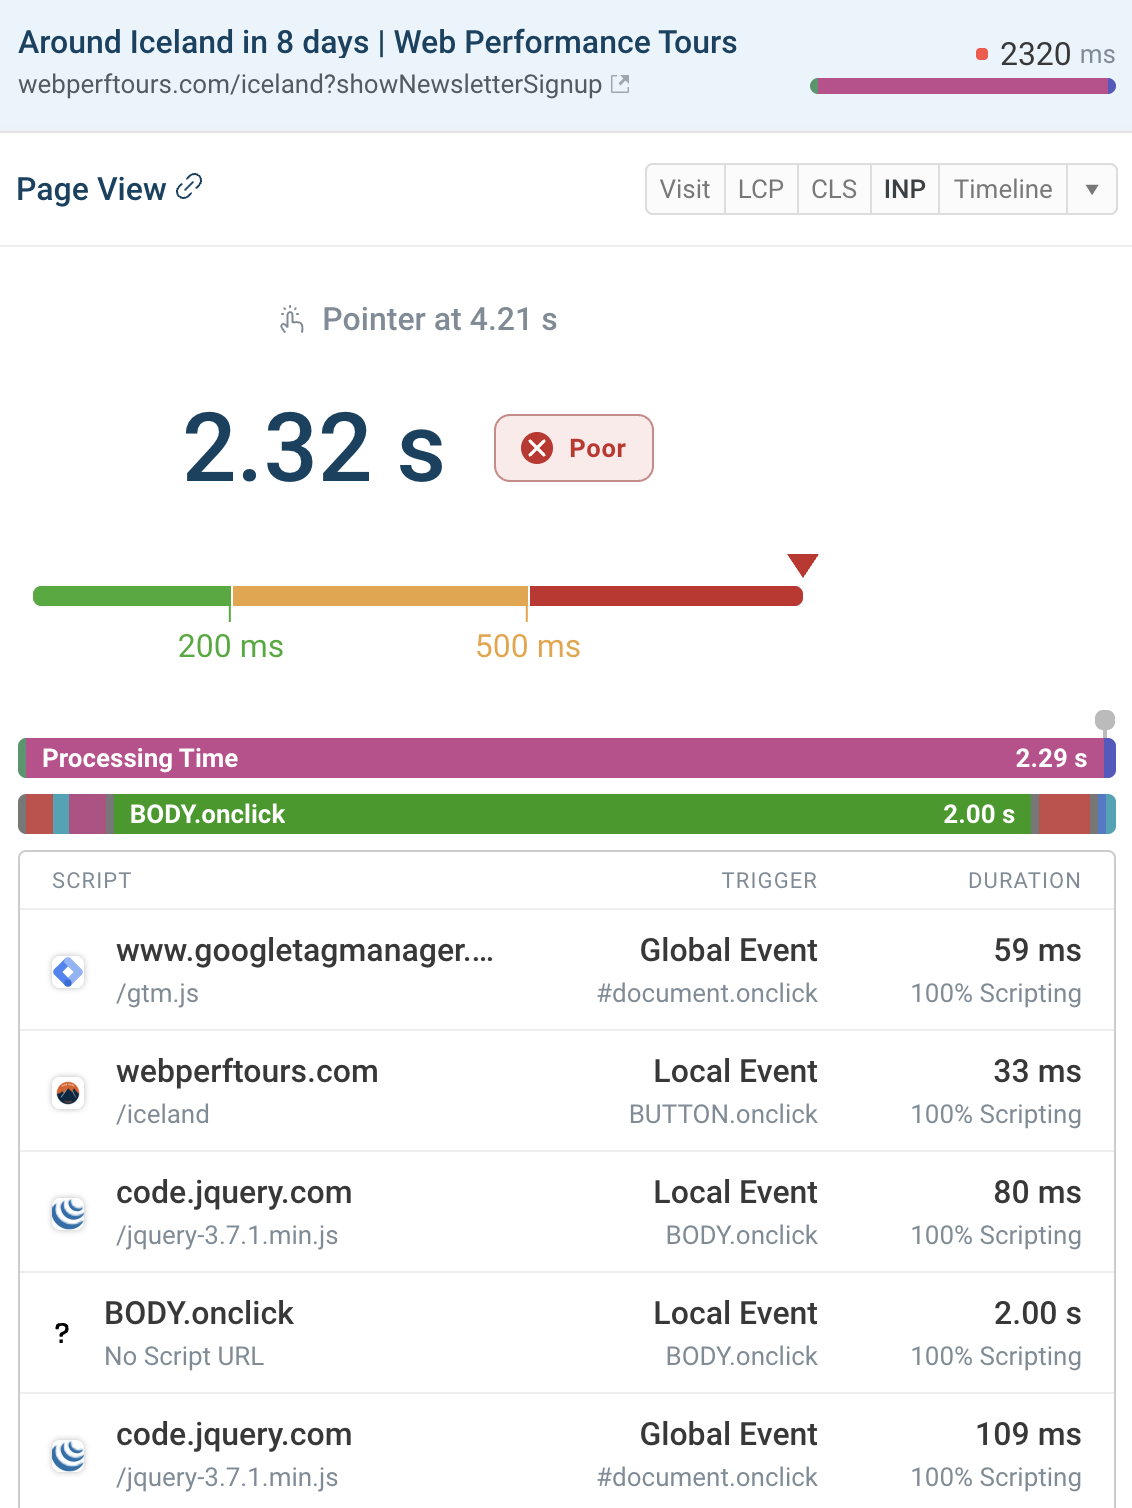
This helps you identify any scripts or interactions that are performing particularly slowly.
Improved URL data for single-page applications
DebugBear page view stats for single-page applications are attributed to the original URL – in line with Google's CrUX data.
To make it easier to debug this data we now also record if the user was viewing a different URL as a result of a soft navigation within the app. You can view this data, for example, under Real User Monitoring → CLS → Table and selecting 'CLS URL Path' from the Group By dropdown menu.
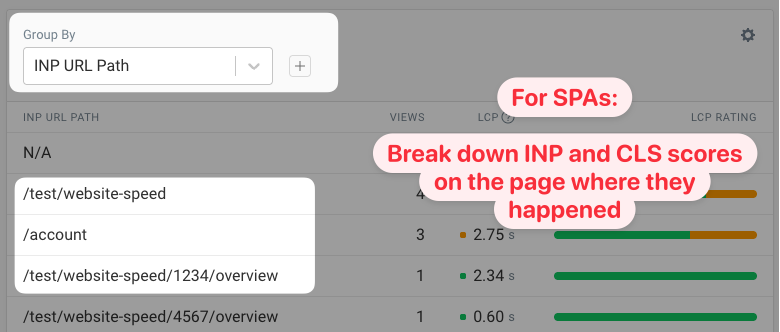
This reveals a more meaningful location where the layout shift or interaction actually happened. Read more about how to measure single-page application performance.
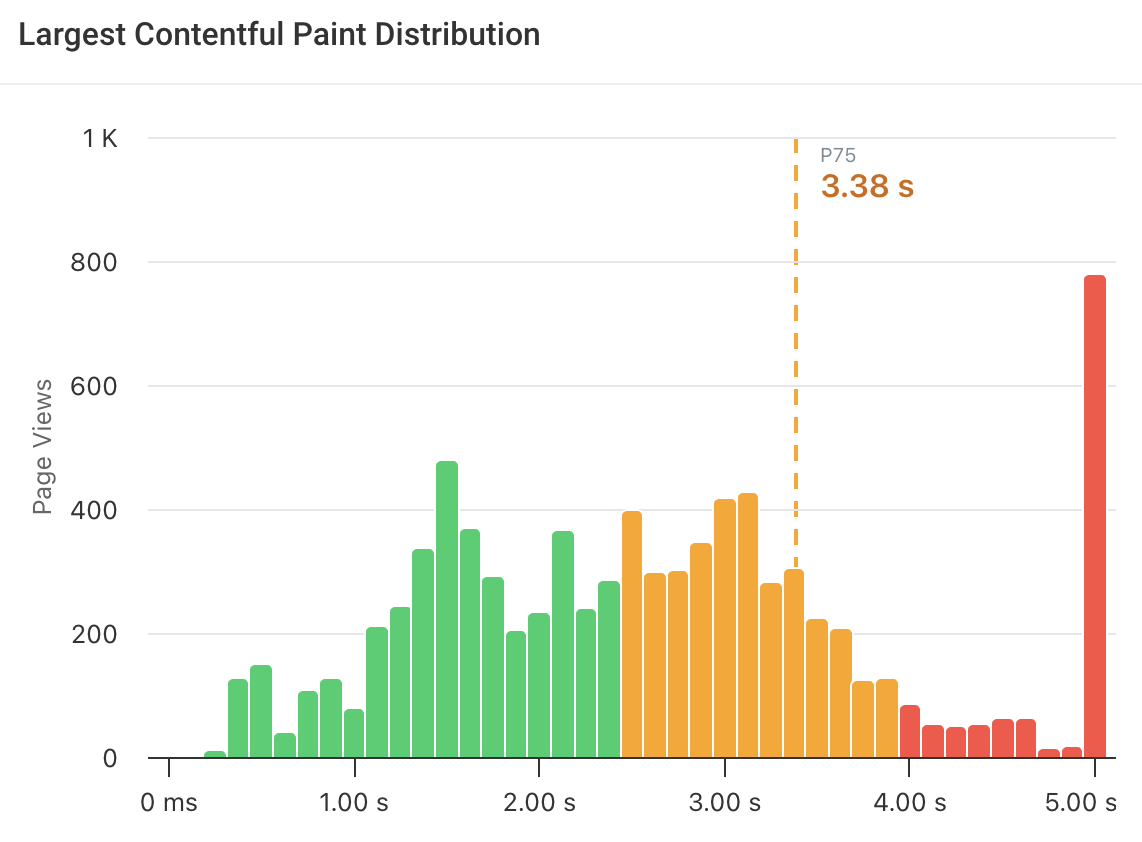
See the P75 score in your LCP breakdown histogram
A little tweak – the P75 score is now included in the graph showing your LCP performance.
Raise your performance game with our latest articles & videos
New articles on our blog:
- HTTP/3 vs HTTP/2 Performance: Is the Upgrade Worth It? Software developer Anna Monus shows how HTTP/3 can deliver improved performance for mobile users on unstable networks, returning site visitors, and international site visitors on high-latency networks.
- Bridging the Performance Divide: Backend and Frontend Engineers Must Unite Web performance consultant Scott Moore explains how both 'ends' can (and should!) work together to maximally improve website speed, with some great examples from his years of experience.
- Optimizing Nuxt Server Side Rendering (SSR) Performance Nuxt's Jakub Andrzejewski reveals how to build faster, leaner Nuxt applications, using techniques such as efficient data fetching, caching, smart deployments and edge rendering.
- How To Monitor Single Page Application Performance DebugBear's Matt Zeunert explores the challenges that single-page apps pose for performance measurements – and what you can do to analyze and optimize your web app.
And new videos on our Youtube channel:
Check out our video guide to speeding up your website by reducing JavScript execution time:
We've also created a few more video guides to help you become a DebugBear power user: