August brings many improvements to Real User Monitoring, UI updates, and lots more new educational resources. Let's dive into what's new in DebugBear this month.
Enhanced Real User Monitoring (RUM)
User Timings in Page View Timeline
We've added support for user timings and measures in the individual page view timeline tab of Real User Monitoring.
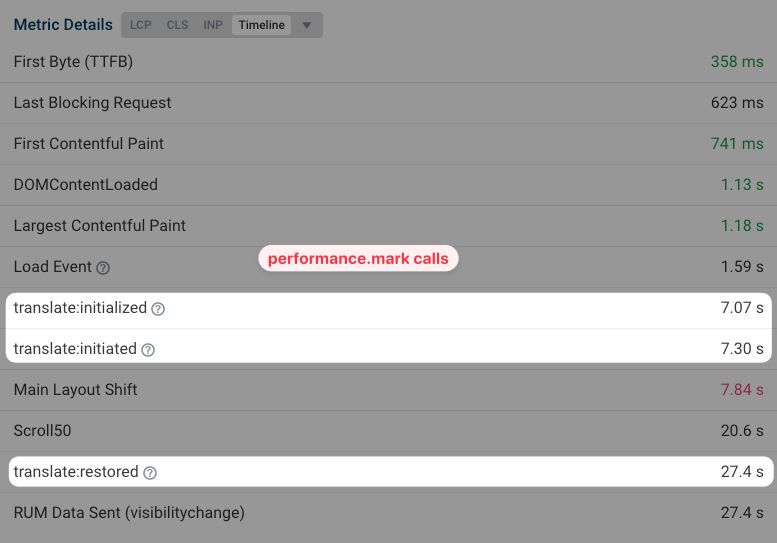
Now, when you instrument your code with performance marks (e.g., performance.mark("Run carousel.js")), these events will appear in the RUM data for each page view. This feature provides a chronological view of performance-related events exactly as your users experience them.
Before
| Metric | Time |
|---|---|
| First Byte (TTFB) | 439 ms |
| Last Blocking Request | 464 ms |
| First Contentful Paint | 530 ms |
| DOMContentLoaded | 532 ms |
| Load Event | 791 ms |
| Largest Contentful Paint | 877 ms |
| RUM Data Sent | 1.03 s |
After
| Metric | Time |
|---|---|
| First Byte (TTFB) | 439 ms |
| Last Blocking Request | 464 ms |
| First Contentful Paint | 530 ms |
| DOMContentLoaded | 532 ms |
| (New) Run carousel.js | 765 ms |
| Load Event | 791 ms |
| Largest Contentful Paint | 877 ms |
| RUM Data Sent | 1.03 s |
Powerful Negative Filters
Our RUM data filtering just got smarter with the introduction of negative filters.
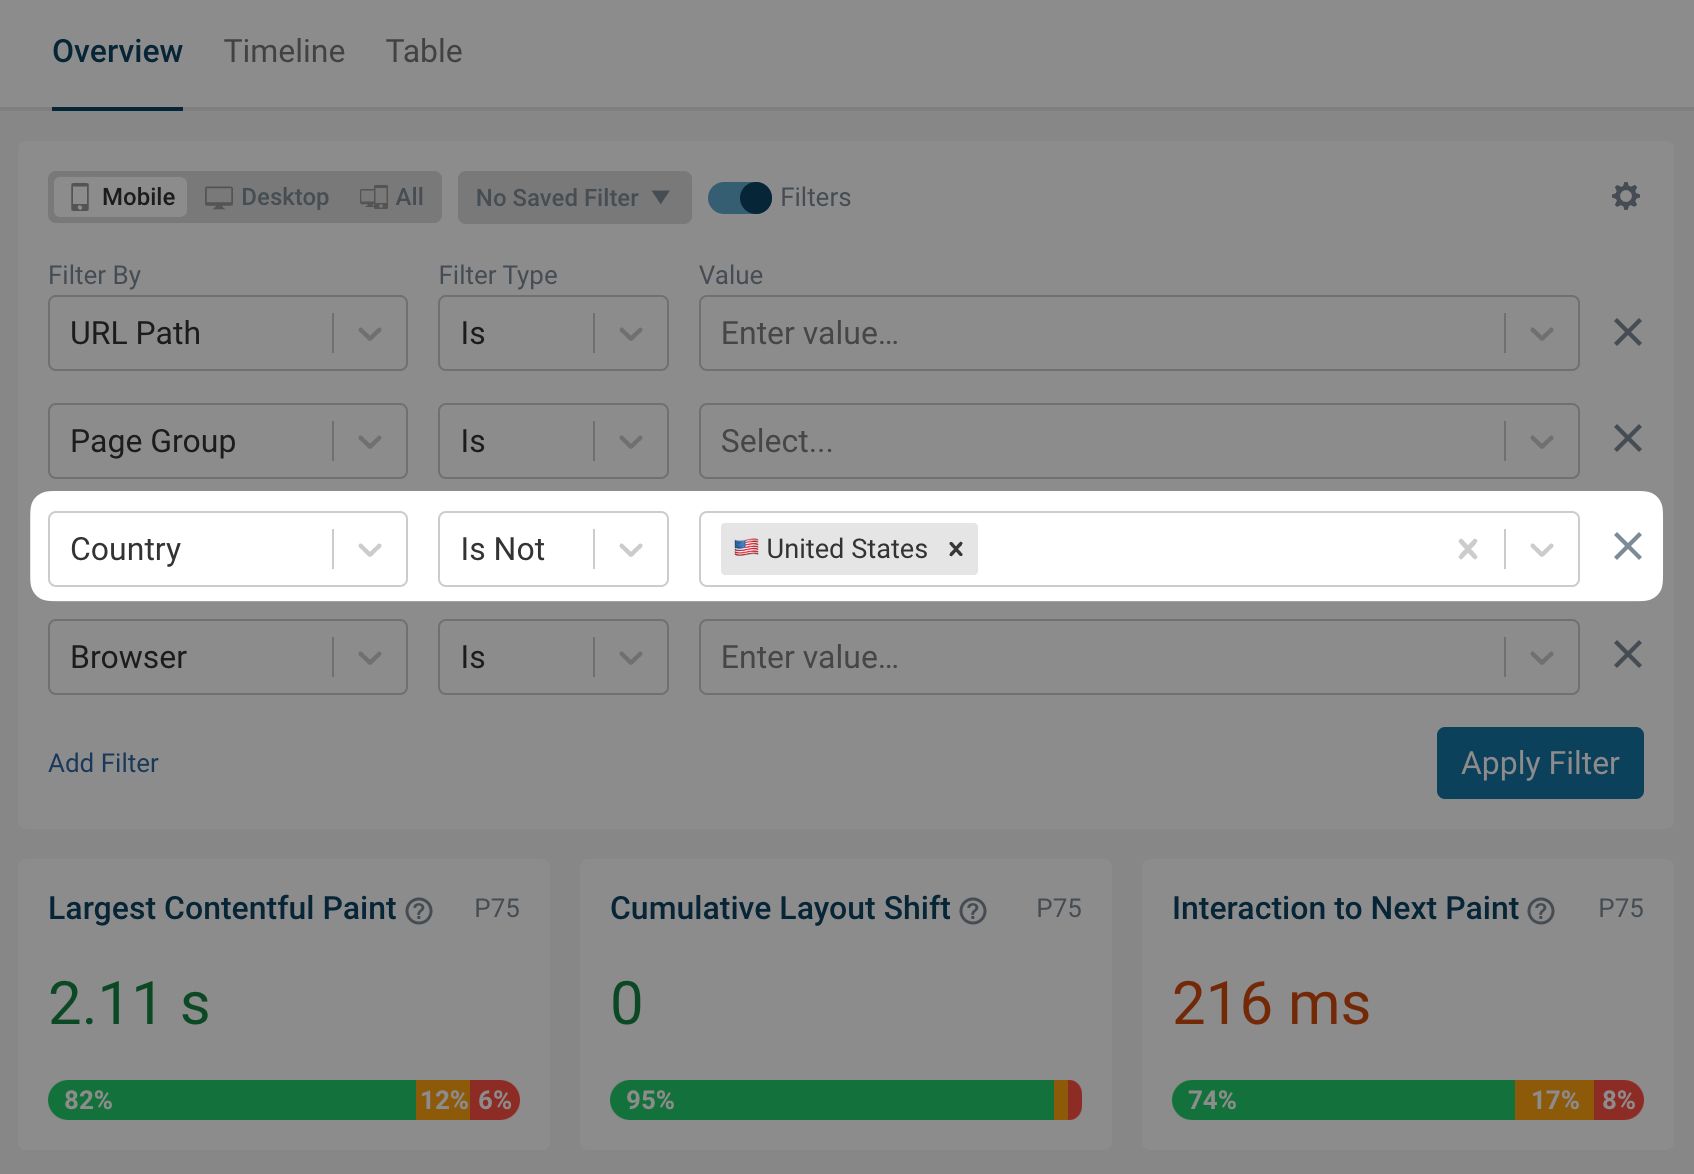
Previously, if you wanted to focus on non-Chrome users, you'd have to select all browsers that are not Chrome, individually. Now, you can exclude Chrome with a single filter. This new feature allows you to:
- Exclude specific countries from your data set
- Filter out particular sections of your website
- Remove page views with certain tags
This intuitive approach to data filtering helps you narrow down performance issues and focus on the most relevant information.
As a bonus tip, you can save these filters for future use and even share them with your team.
Clearer Elements Tab
We've given the Elements tab in RUM a significant makeover.
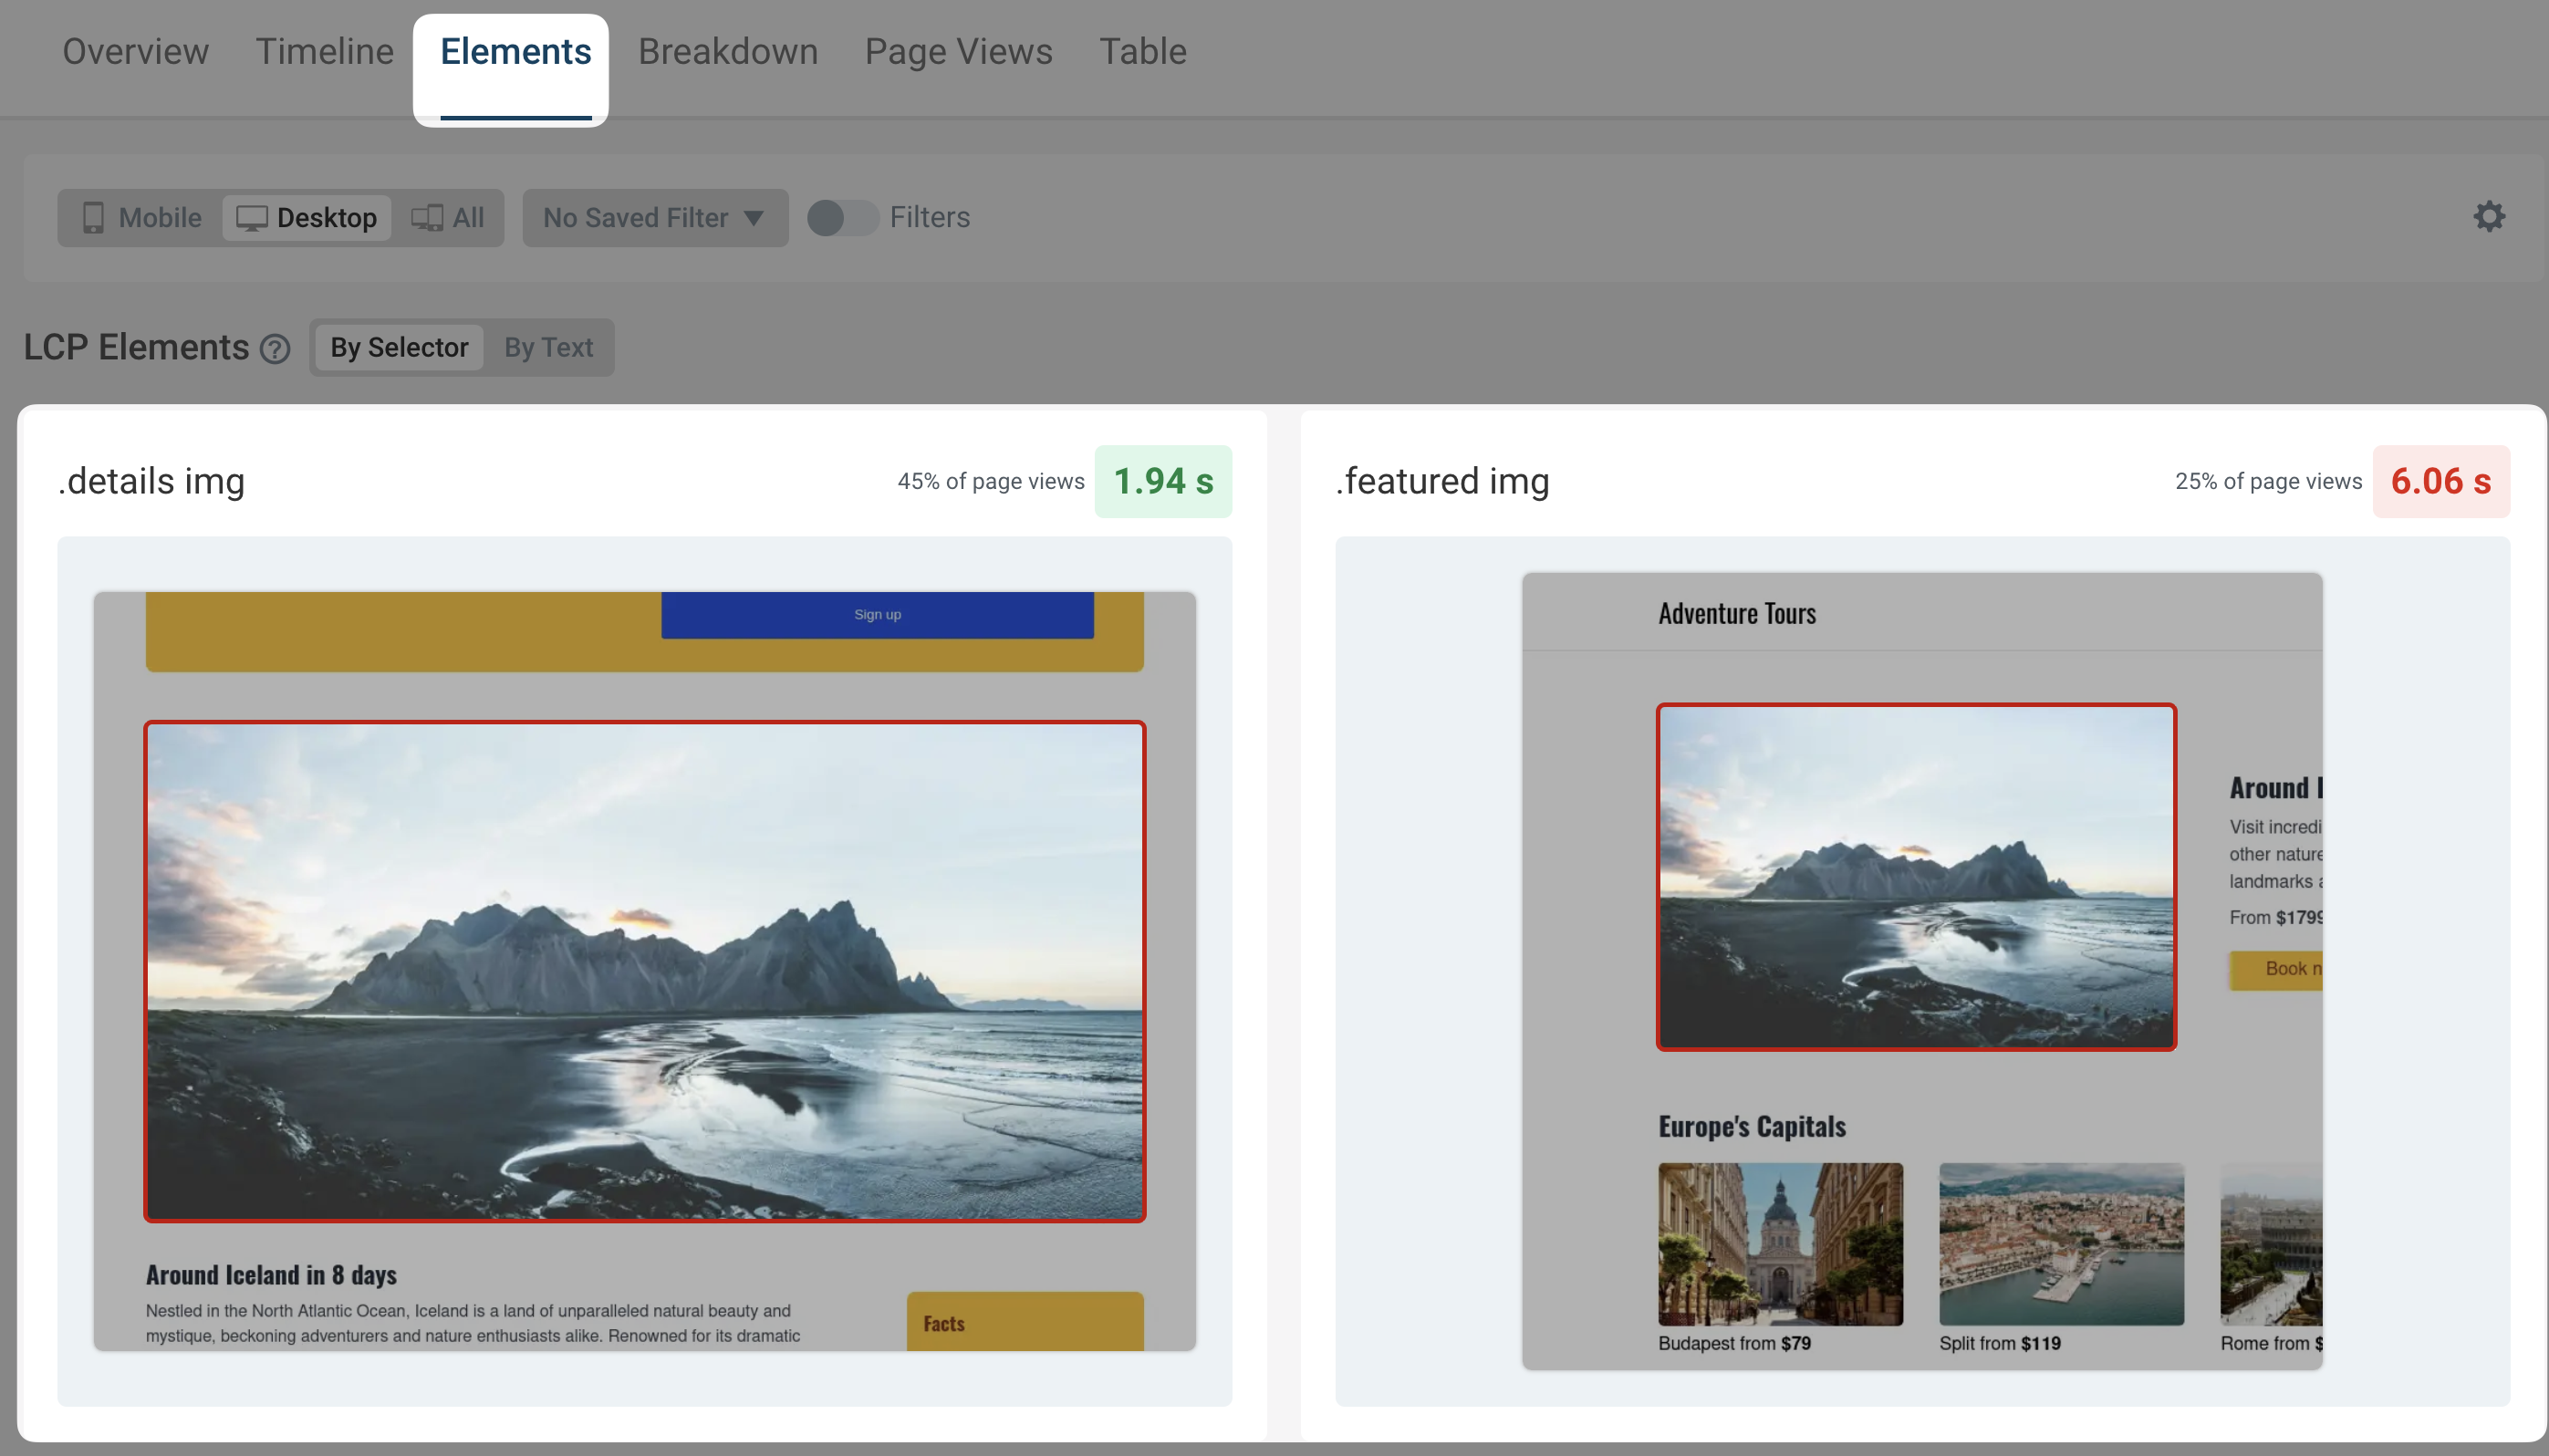
The Elements section, available for Interaction to Next Paint, Cumulative Layout Shift, and Largest Contentful Paint metrics, now provides clearer visual representations. The improved screenshots make it much easier to identify which elements are relevant to the metric you're analyzing.
Better Tooltips
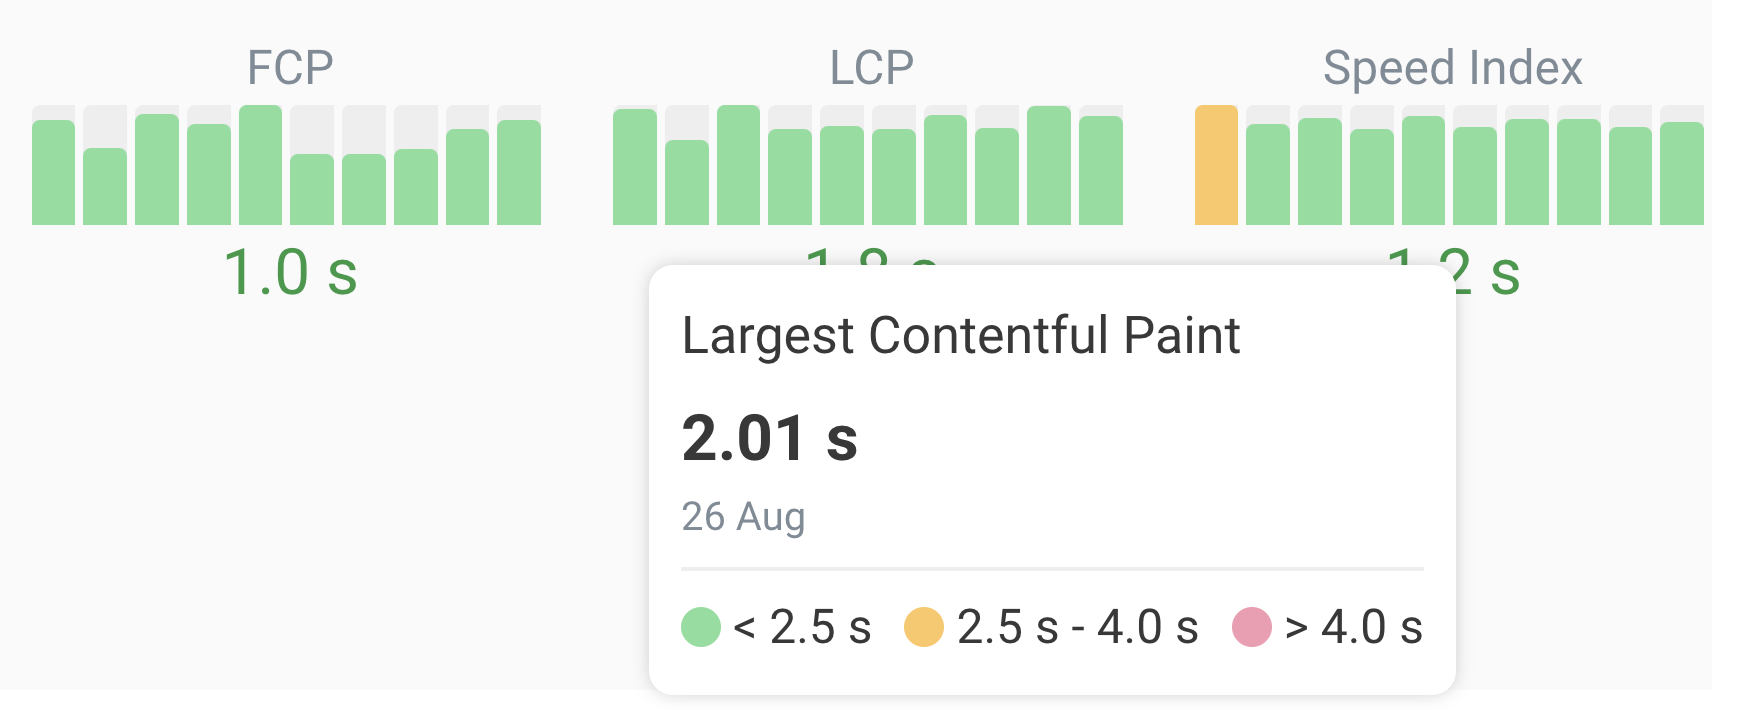
Tooltips now show the range of ratings for each metric - so you can see at a glance how far off you are from a good score.
Technical Upgrades
We've updated our infrastructure to provide you with the latest Lighthouse and Chrome versions:
- Upgraded to Lighthouse 12.2
- Now using Chrome 127
These upgrades ensure you have access to the most recent performance metrics and audits, and that your website performance tests benefit from the latest browser capabilities.
New Educational Resources
This month, we're introducing a wealth of new educational content:
New Articles
Are Re-renders Hurting Your Largest Contentful Paint Score?
Unnecessary content re-renders can negatively impact your Largest Contentful Paint (LCP) metric. Learn how LCP element re-rendering affects your metrics and how to avoid it.
PageSpeed Insights API: Discover Web Performance Insights with Code
Integrating performance data into your workflows can boost optimization efforts. Learn how to use the PageSpeed Insights API to automate performance analysis of your websites.
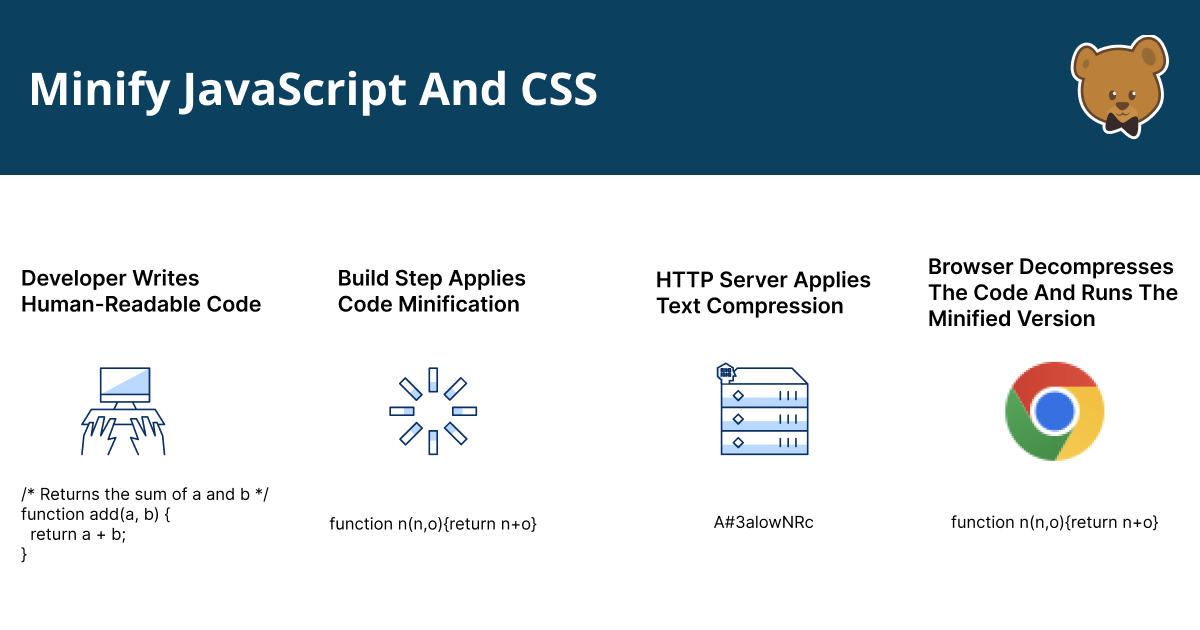
Minify JavaScript And CSS Code For A Faster Website
Code minification is important for improving website performance. Learn how code minification works and some tools to get started with.
Brand New Performance Features in Chrome DevTools
Explore modern web performance features in Chrome DevTools and see how the new Performance Panel features can help optimize Core Web Vitals.
How To Reduce Unused JavaScript
Unused JavaScript can harm web performance. Explore techniques to reduce unused JavaScript on your website.
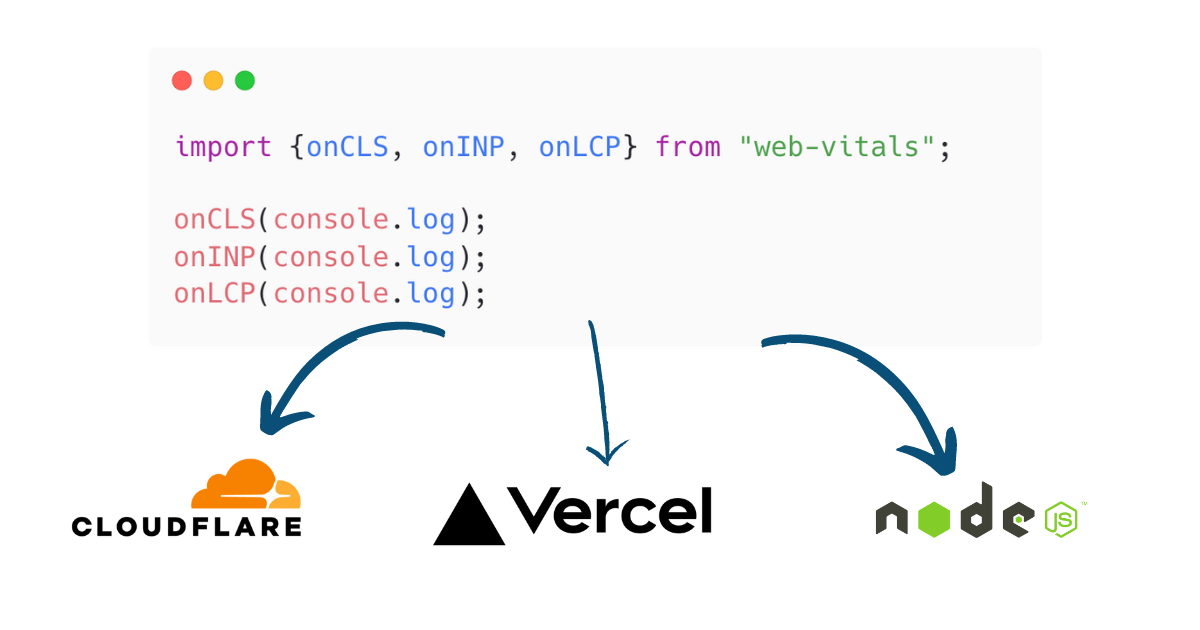
Monitor Core Web Vitals with the web-vitals.js Library
Checking your Core Web Vitals score is not just a one-off. Learn how to use the web-vitals.js library to monitor Core Web Vitals for your real users.
The Ultimate Guide to Font Performance Optimization
Everything you need to know about Web Font performance. Learn how to optimize font loading and rendering for a faster website.
Video Tutorial
This guide walks you through the new Chrome DevTools Performance Panel: Learn how to view, and interpret performance metrics directly in Chrome DevTools.

Core Web Vitals Documentation
Core Web Vitals Cheat Sheet
Core Web Vitals Quick-Fix Cheat Sheet: A handy one-page reference for quick LCP, CLS, and INP improvements.
Core Web Vitals Documentation
Updated Core Web Vitals Documentation: We've updated our Core Web Vitals page with quick-fix guides, new visual explanations, and advanced optimization techniques.
We hope you find these new features and resources useful. Follow us on Twitter and subscribe on YouTube to stay up to date with the latest performance tips and tricks.