We've released custom dashboards to help you view data exactly how you want, along with alert improvements, Chrome and Lighthouse upgrades, and a new CLS testing tool.
Custom Dashboards
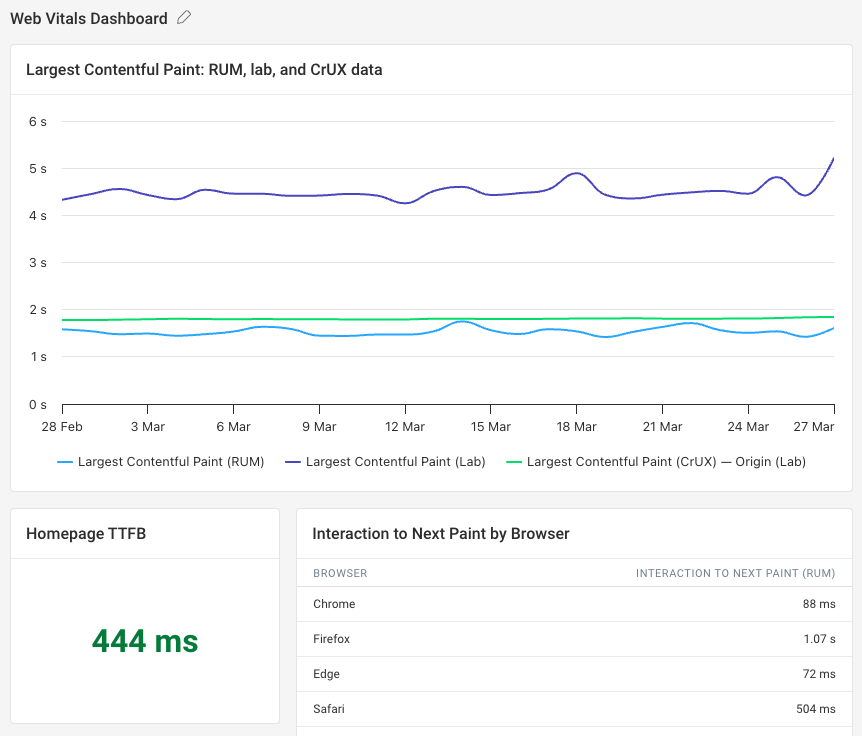
Custom dashboards are a new way to view data presented exactly how you want. You can also combine synthetic metrics, Google CrUX data, and real user monitoring data in one place.
There are multiple viewing options available, including timeseries charts, bar charts, and tables. You can use text blocks to contextualize data for your team. Each segment can be resized and moved to your liking.
All types of DebugBear performance data are available, including data from other projects in your account.
Alerts
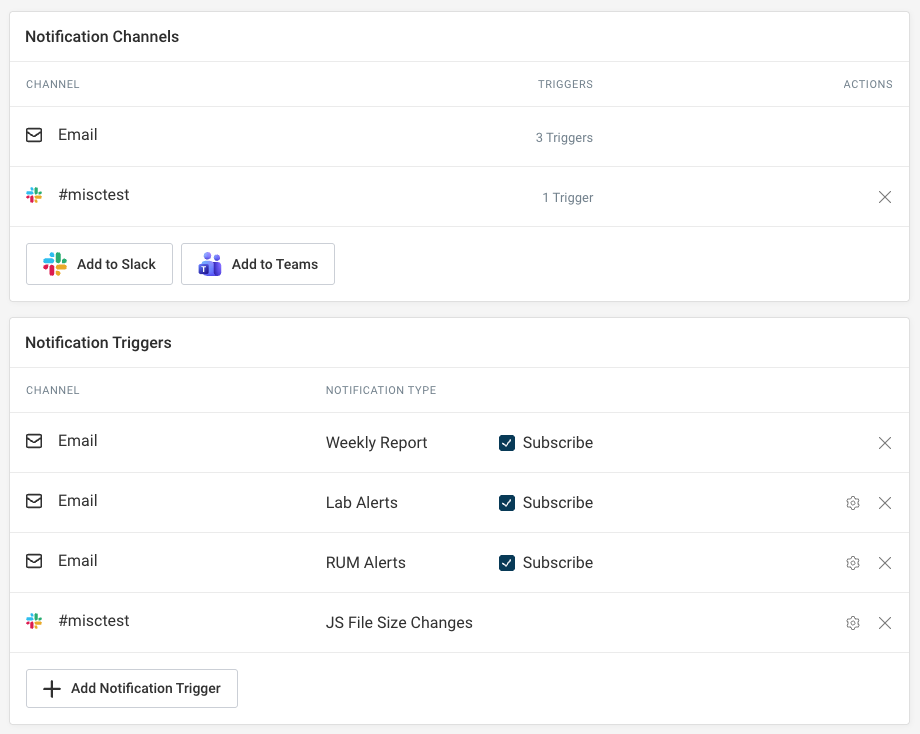
We have made some improvements to how you can configure alert channels. You can now easily re-use the same channel for different alert triggers.
Change to chart annotations
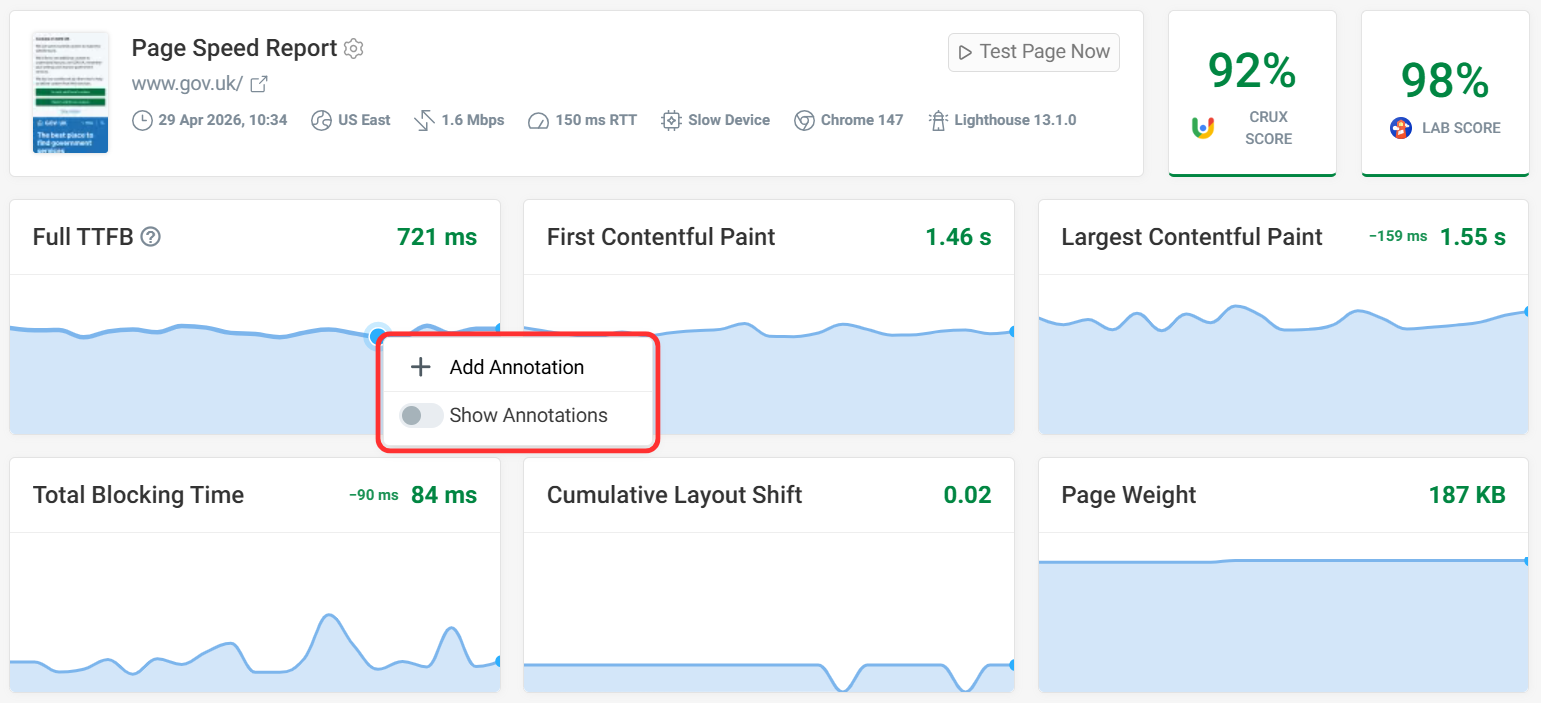
The annotations feature has moved out of the right sidebar. You can now access it by right-clicking on a timeline chart.
Upgrades to Chrome 147 and Lighthouse 13.1
We've upgraded from Chrome 141 to 147 and from Lighthouse 12.3 to 13.1.
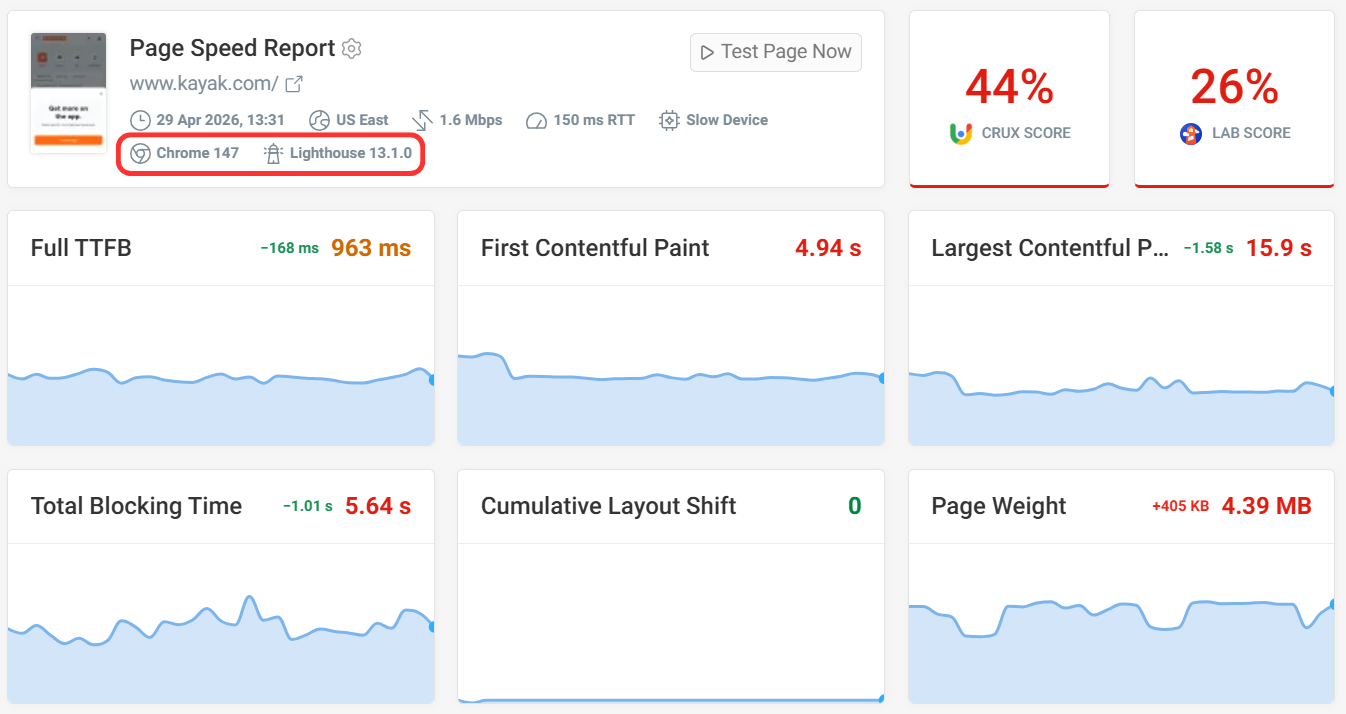
Seeing an increase in Total Blocking Time? The upgrade fixed a bug on some pages where CPU throttling wasn't correctly applied before. Contact our support team if you have questions about your performance data.
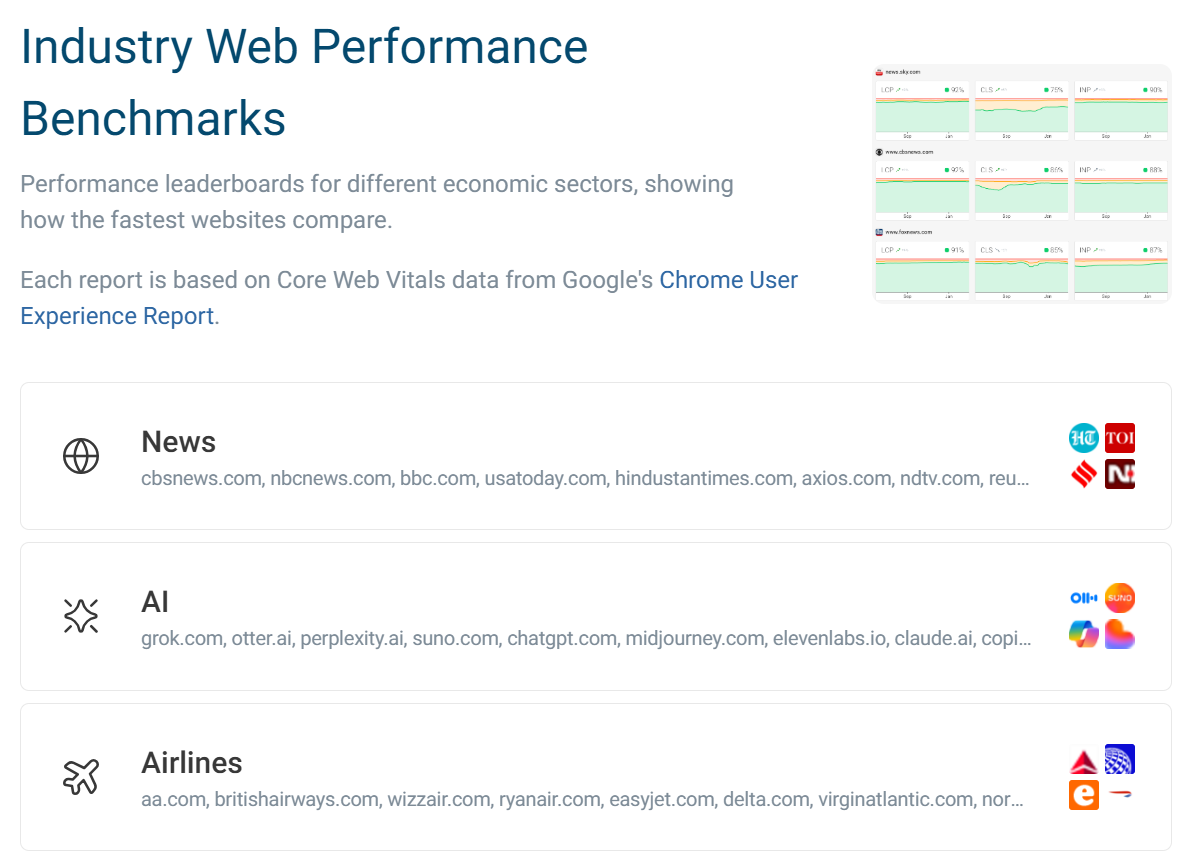
Industry Benchmarks
We've created a list of performance benchmarks for different industries. You can see what the fastest websites are in sectors like AI, news, groceries, or banking.
Most recently we took a close look at the fastest government websites to find out which country has the fastest government website. Beyond the ranking, we also investigated the reasons behind the performance of these websites.
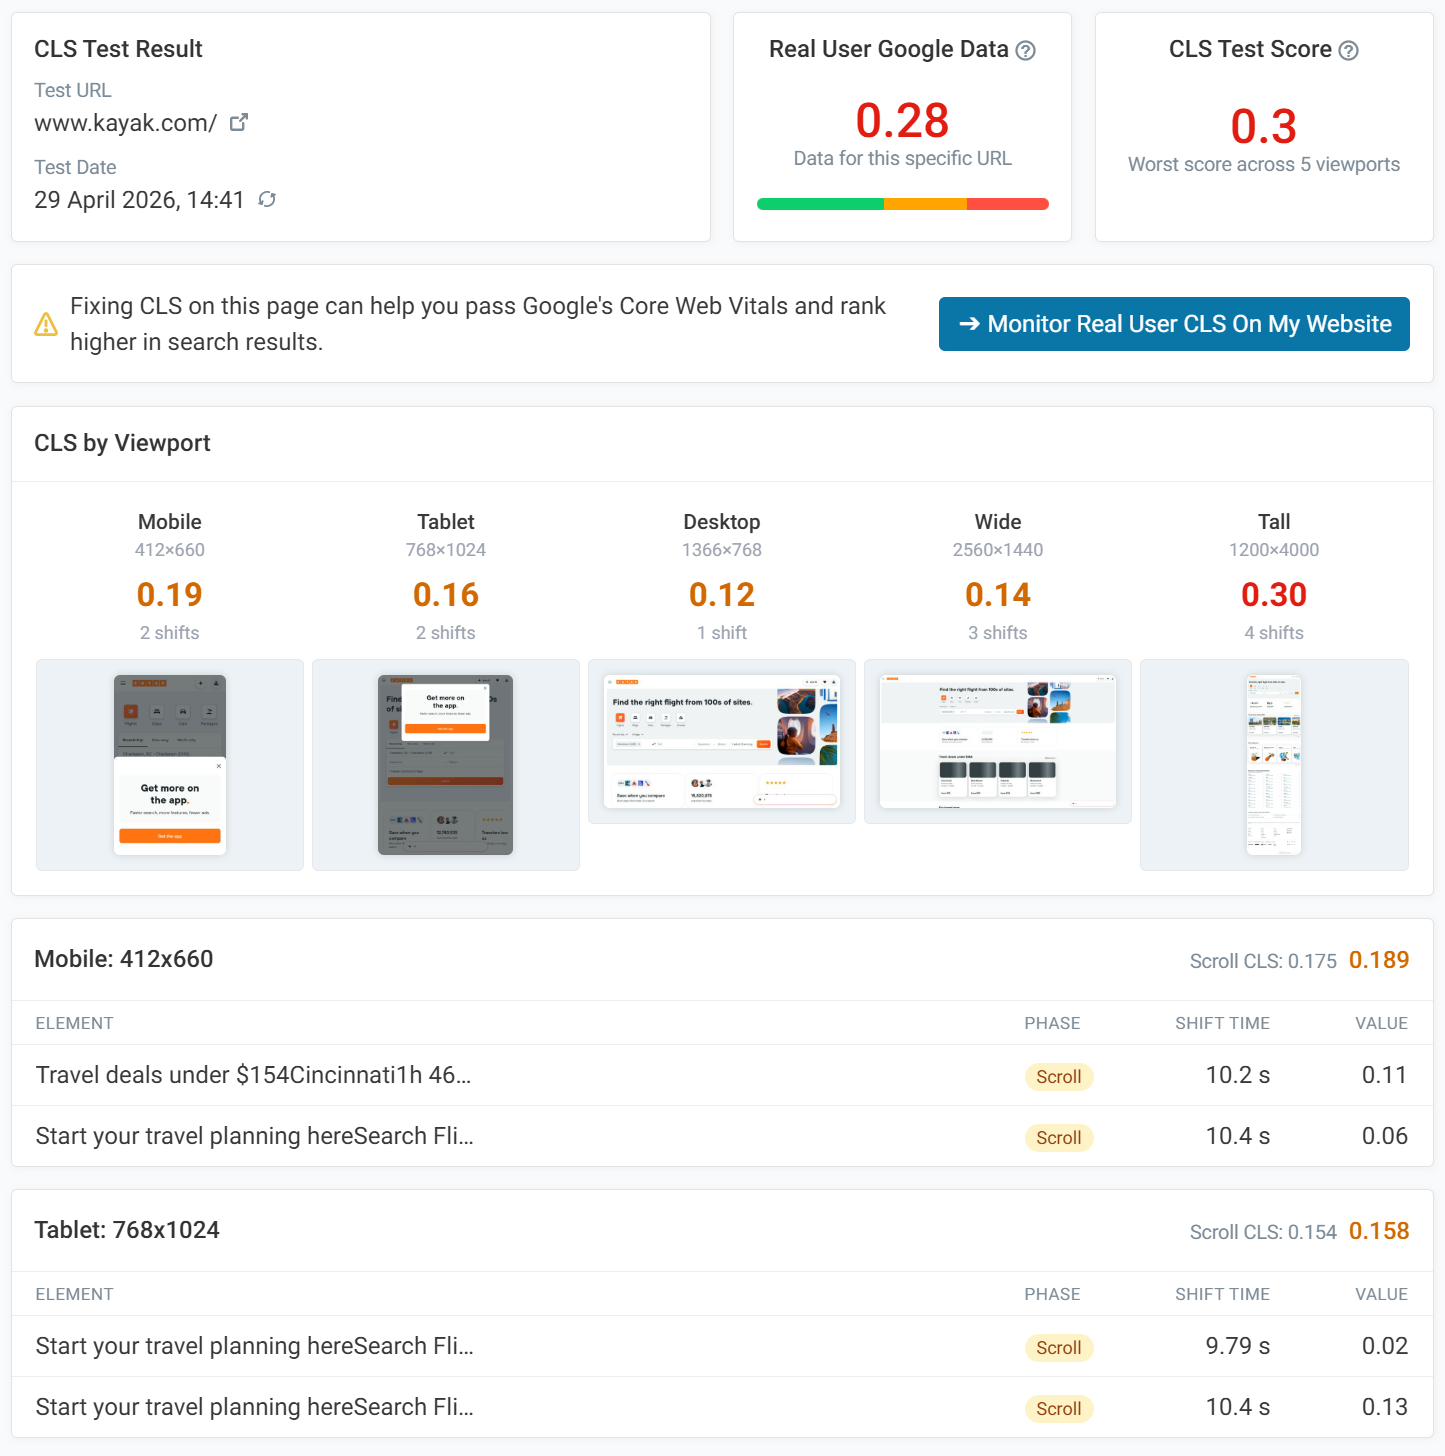
New free tool: CLS tester
We have released a new free tool to test Cumulative Layout Shift (CLS) for your website across various devices.
After entering the page URL, the test will run across five different screen dimensions:
- Mobile - 412×660
- Tablet - 768×1024
- Desktop - 1366×768
- Wide - 2560×1440
- Tall - 1200×4000
Then a breakdown will be available showing which shifts occur and when. Click on the element to find a screenshot of the shift and timings. There is also an option to view a video recording of the shift.
New Articles
- How to Use Lazy Loading Without Hurting Web Performance - A deep dive into the lazy loading attribute and best use cases.
- Shopify Speed Optimization: Fixing The Real Bottlenecks - A guide to the best Shopify optimizations, including real world examples.
- Technical SEO Checklist: The Complete Guide For 2026 - How to upgrade your website's infrastructure for technical SEO and AI's impact.
- Which Country Has The Fastest Government Website? - Study of 25 different government websites from across the world. Which ones are fastest and why?
- Declarative Shadow DOM and Native Server-Side Rendering - How Declarative Shadow DOM can be used to render web components directly in HTML without needing JavaScript.
Web performance videos
Some of our new YouTube videos:
- Synthetic Monitoring: How To Continuously Check Website Performance - Learn what synthetic website monitoring is, how it's different from real user monitoring, and what benefits it provides.
- Image Optimization: How To Improve Image Delivery On The Web - Learn how to deliver images effectively and optimize page speed.
- How to create custom web performance dashboards for your team - A closer look at our new custom dashboards.