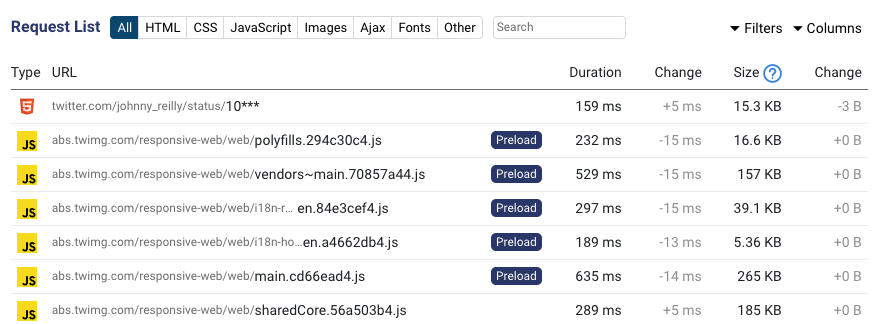
You can now see more details about each network request, and all columns are sortable.
The list in the requests tab now shows the request duration by default, and you can add other columns as well. You can also click on the column headers to sort by that column.
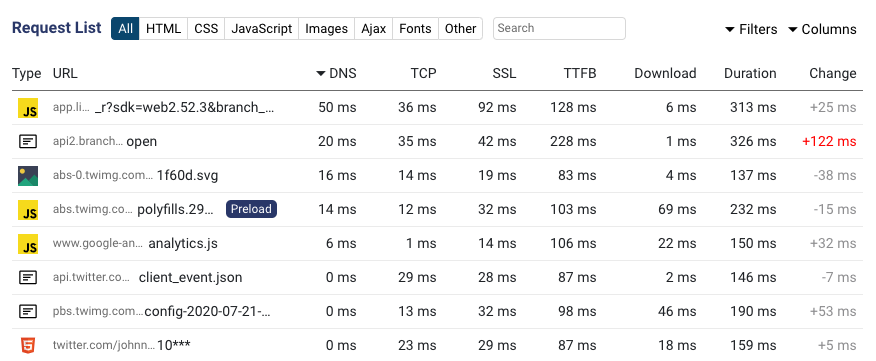
For example, you can break down the request duration into time spent on each part of the HTTP transaction: DNS lookup, TCP connection, SSL connection, Time to First Byte, and actually downloading the response content.
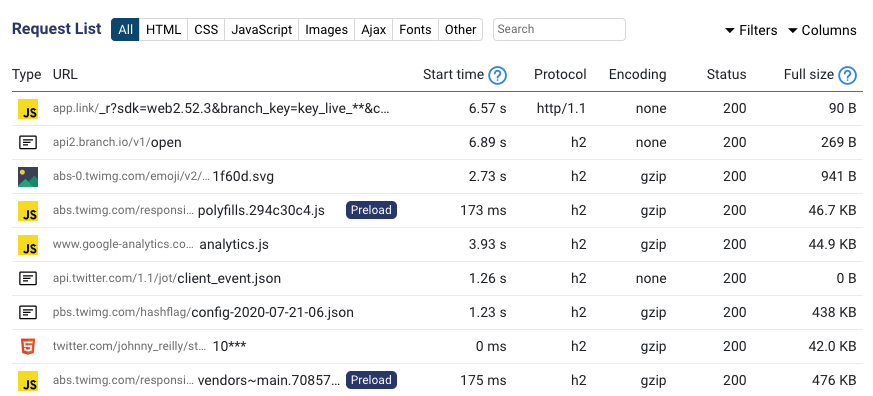
Or you can look at the content encodings, decoded response size, and response statuses. The request start time is relative to when the initial document request was made.
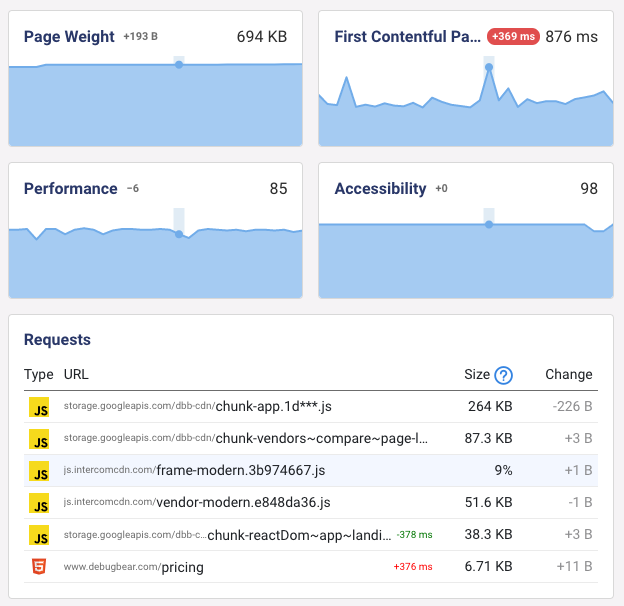
Larger request changes will also appear in the overview tab. Here you can see that the First Contentful Paint increased because the response for the initial document request took longer.