Lighthouse has been upgraded to version 6, introducing new performance metrics.
DebugBear now tests your websites with version 6 of Lighthouse. We've also upgraded Chrome from version 78 to 83.
New metrics and scoring
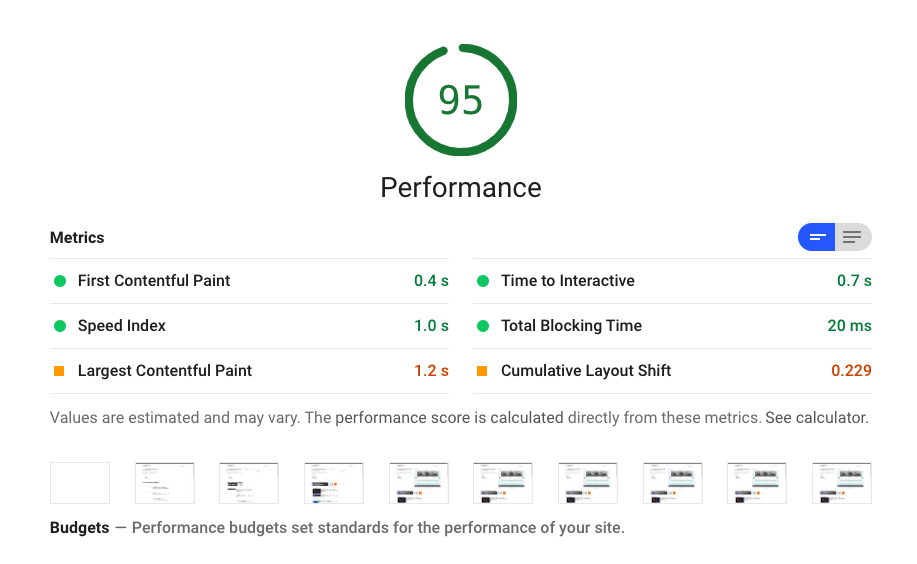
Lighthouse 6.0 introduces several new metrics and changes how the overall performance score is calculated
- Total Blocking Time – How often do JavaScript or rendering tasks make the page unresponsive?
- Largest Contentful Paint – When is the largest content element displayed on the screen?
- Cumulative Layout Shift – How much does page content move around after being rendered?
The composition of the Performance score has changed as follows:
Existing metrics
- First Contentful Paint – 20% ➔ 15%
- Speed Index – 26.7% ➔ 15%
- Time to Interactive – 33.3% ➔ 15%
New metrics
- Largest Contentful Paint – 0% ➔ 25%
- Total Blocking Time – 0% ➔ 25%
- Cumulative Layout Shift – 0% ➔ 5%
Deprecated metrics
- First Meaningful Paint – 6.7% ➔ 0%
- First CPU Idle – 13.3% ➔ 0%
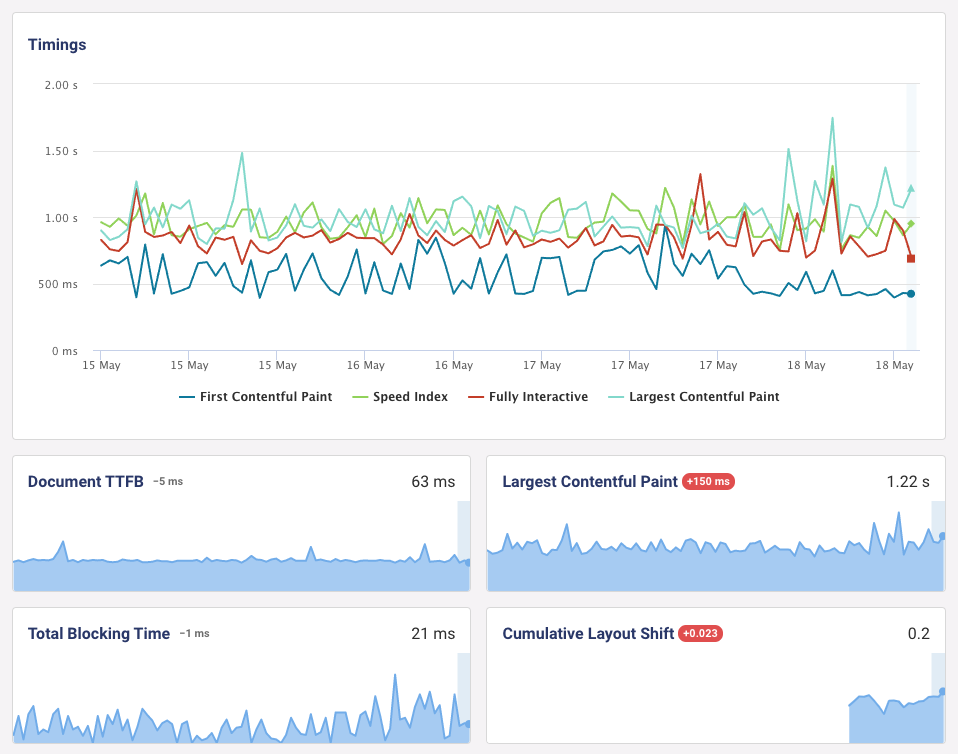
You can find the charts for the new metrics in the Performance tab.
Read more about these metric changes in the Lighthouse 6.0 announcement post.
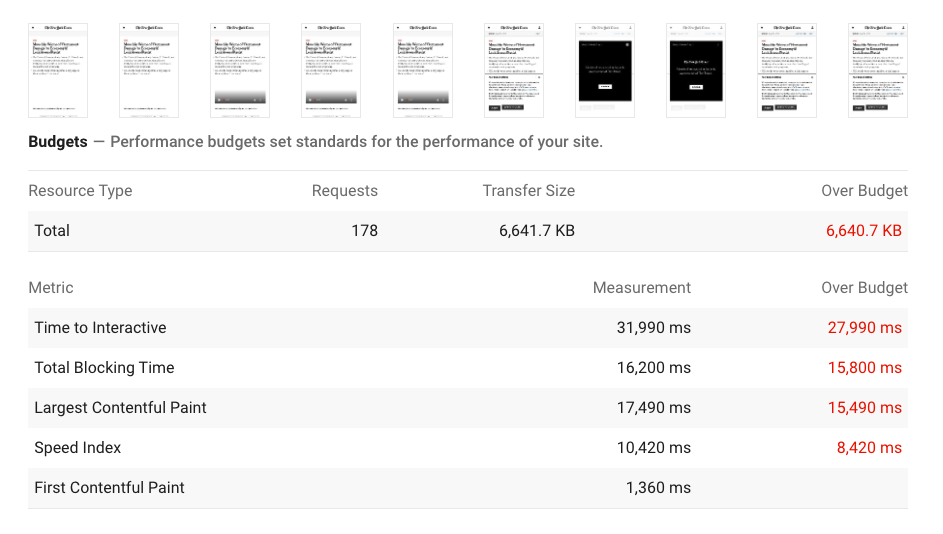
Better timing budgets
Lighthouse performance budgets now support more timing metrics. If you've set up a performance budget on DebugBear those metrics will also show up in the Lighthouse report.
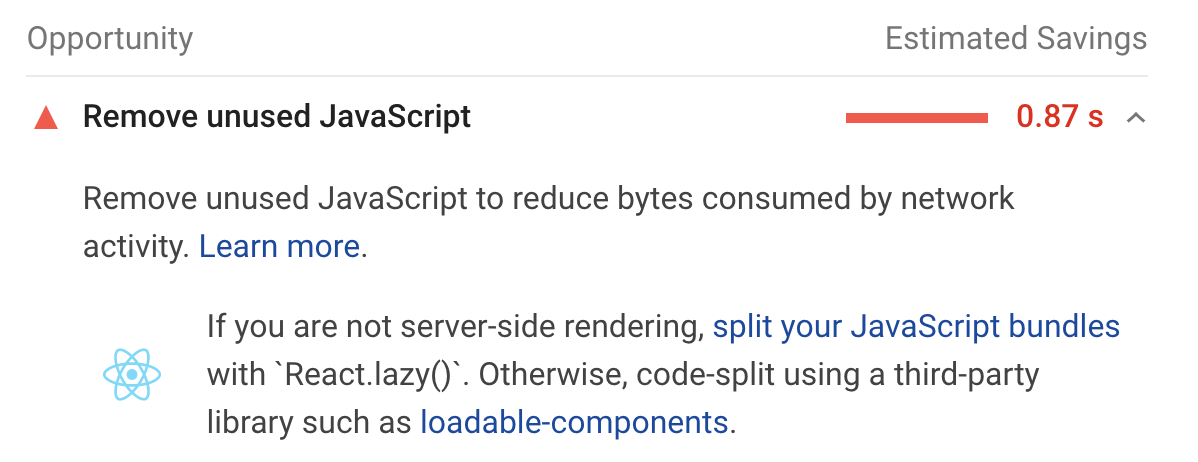
Stack packs
These were introduced in Lighthouse 5.6.0, but DebugBear was previously running version 5.5.0. The Lighthouse report now includes recommendations tailored to your tech stack: