
Digital Experience Monitoring helps you track and improve user experience. Based on this data, product, marketing, and engineering teams can deliver fast and reliable websites.
This guide compares the different DEM solutions and highlights when they might be the best fit.
What is Digital Experience Monitoring?
Digital Experience Monitoring combines different data sources to provide a comprehensive view of user experience:
- Real User Monitoring (RUM) measures performance, conversion rates, errors, and more for actual visitors
- Synthetic monitoring runs scheduled tests in a controlled test environment (both for the initial page load and scripted user journeys)
- Uptime monitoring checks that your website is available and responsive
- Backend monitoring provides detailed insight into slow application server and database processing
Some DEM tools include all of these features, while others focus on specific aspects of digital experience. Monitoring tools both measure what the user experience is like and provide technical insights on how to resolve any issues.
DebugBear
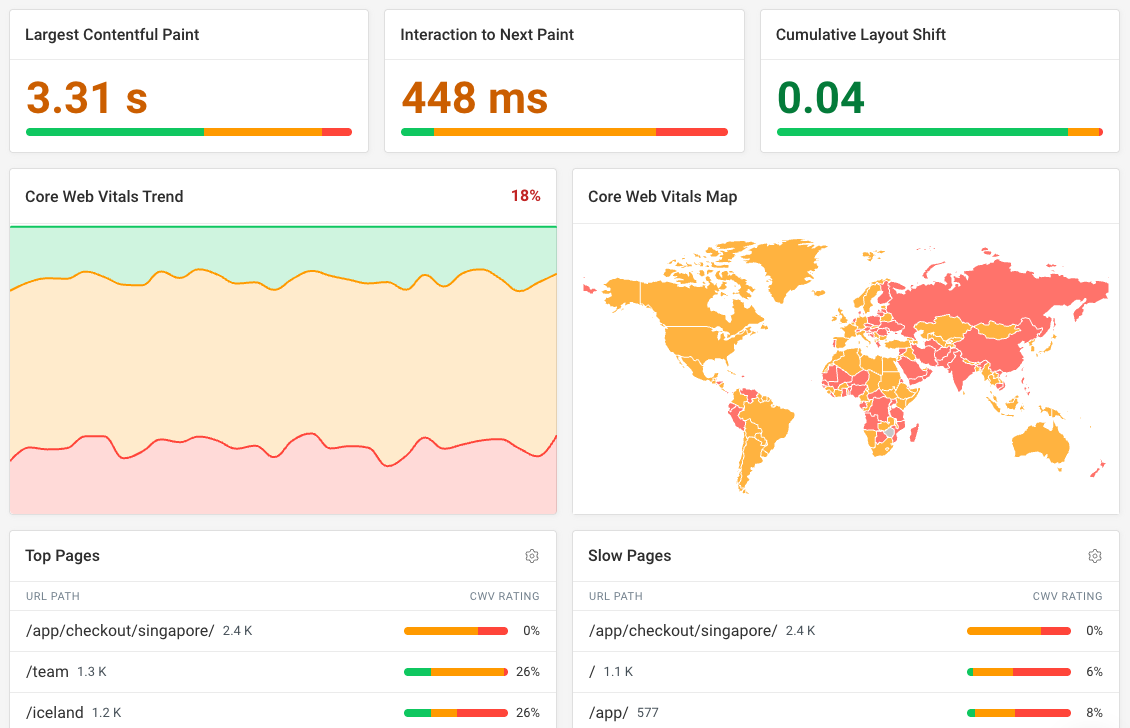
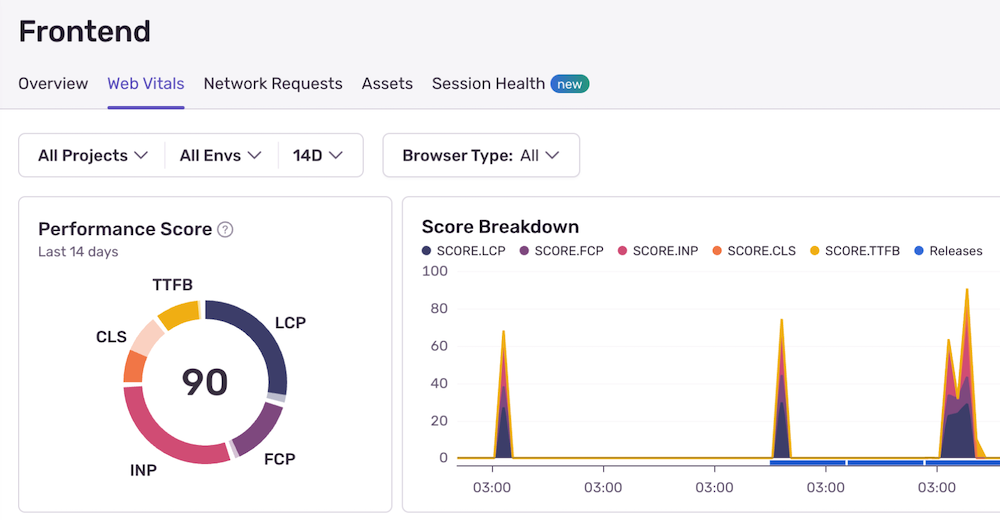
DebugBear provides in-depth web performance and visitor experience data based on real user analytics and synthetic testing. In particular, it focuses on Google's Core Web Vitals metrics and overall frontend performance.
You can set up alerts for key metrics and get detailed technical insights to optimize performance and diagnose the cause of regressions.
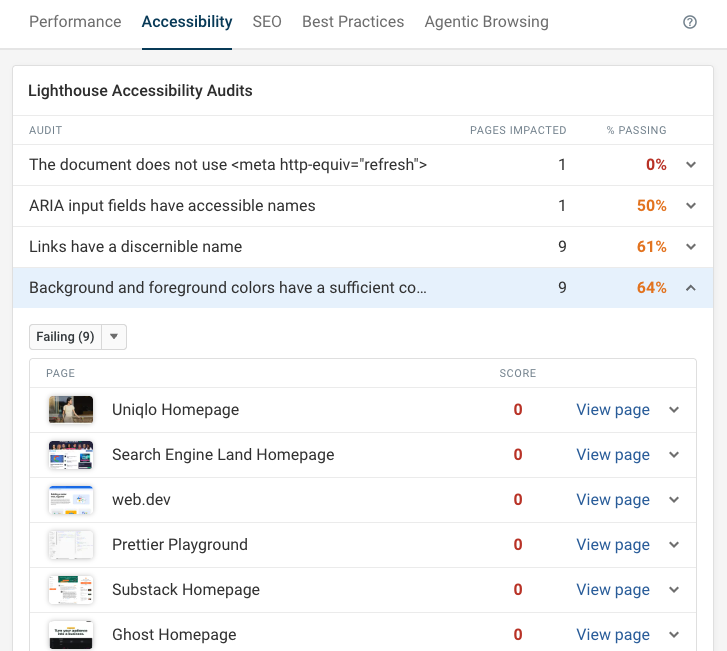
You can also track Lighthouse scores for accessibility, SEO, best practices, and agentic browsing. This helps you improve the overall quality of your website beyond just performance.
This site-wide view lets you identify the most common issues across your website and prioritize those optimizations.
DebugBear is a web performance tool focused on end user experience. It does not include support for uptime monitoring or server-side performance measurements.
Contentsquare�
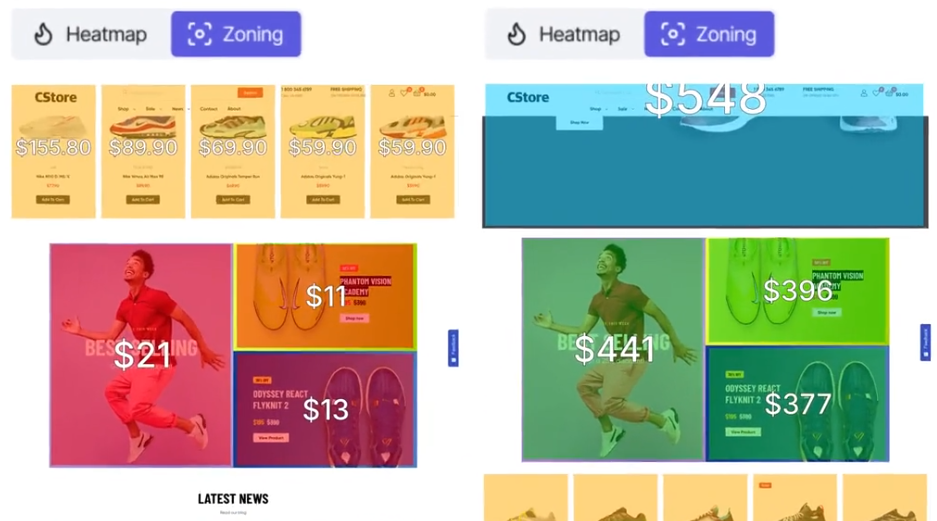
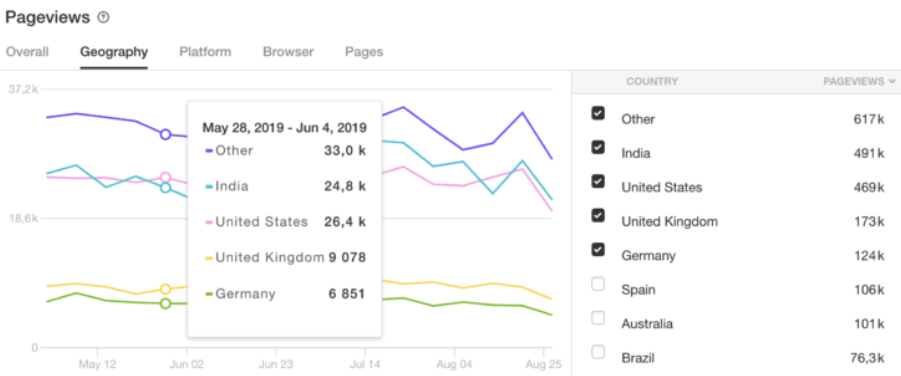
Contentsquare is a digital experience platform with a focus on product analytics and user behavior. It aims to tie experience data closely to business outcomes to help improve conversion rates.
The product offers heatmap recordings, session replay, as well as real user and synthetic performance monitoring.
Contentsquare is a business-focused tool that tries to connect user experience with revenue generation. However, it has less of a technical focus compared to more advanced web performance tools.
Dynatrace
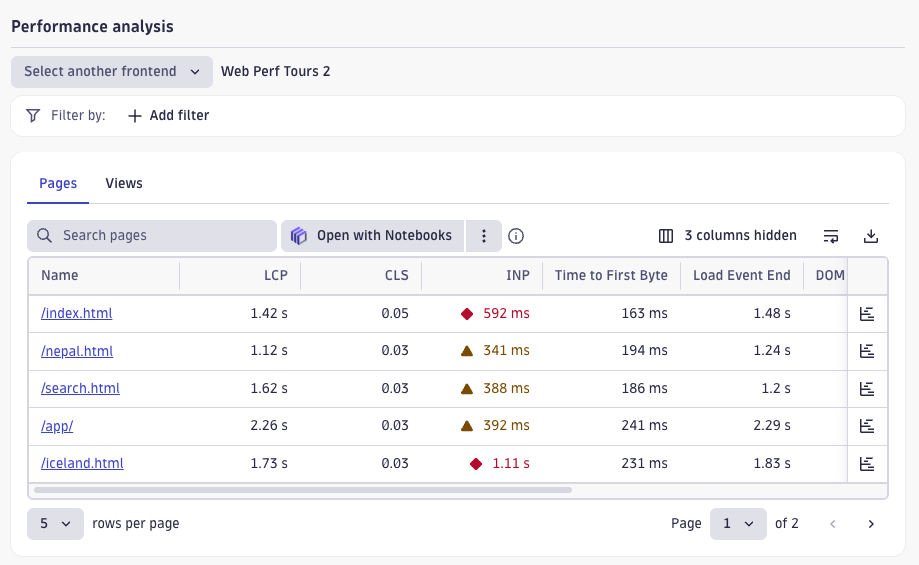
Dynatrace is a comprehensive observability platform that covers synthetic tests, real user monitoring, backend application monitoring and more.
You can record detailed data relevant to visitor experience and performance on your website. Dynatrace Query Language (DQL) allows you to set up in-depth custom dashboards based on the data you've recorded.
Dynatrace is a powerful tool that offers a lot of flexibility for teams to set up their own data pipeline. While the product provides pre-built dashboards, it does not force you down one particular path to analyze your data.
New Relic
Like Dynatrace, New Relic is a comprehensive tool that provides detailed insights across a wide range of monitoring needs.
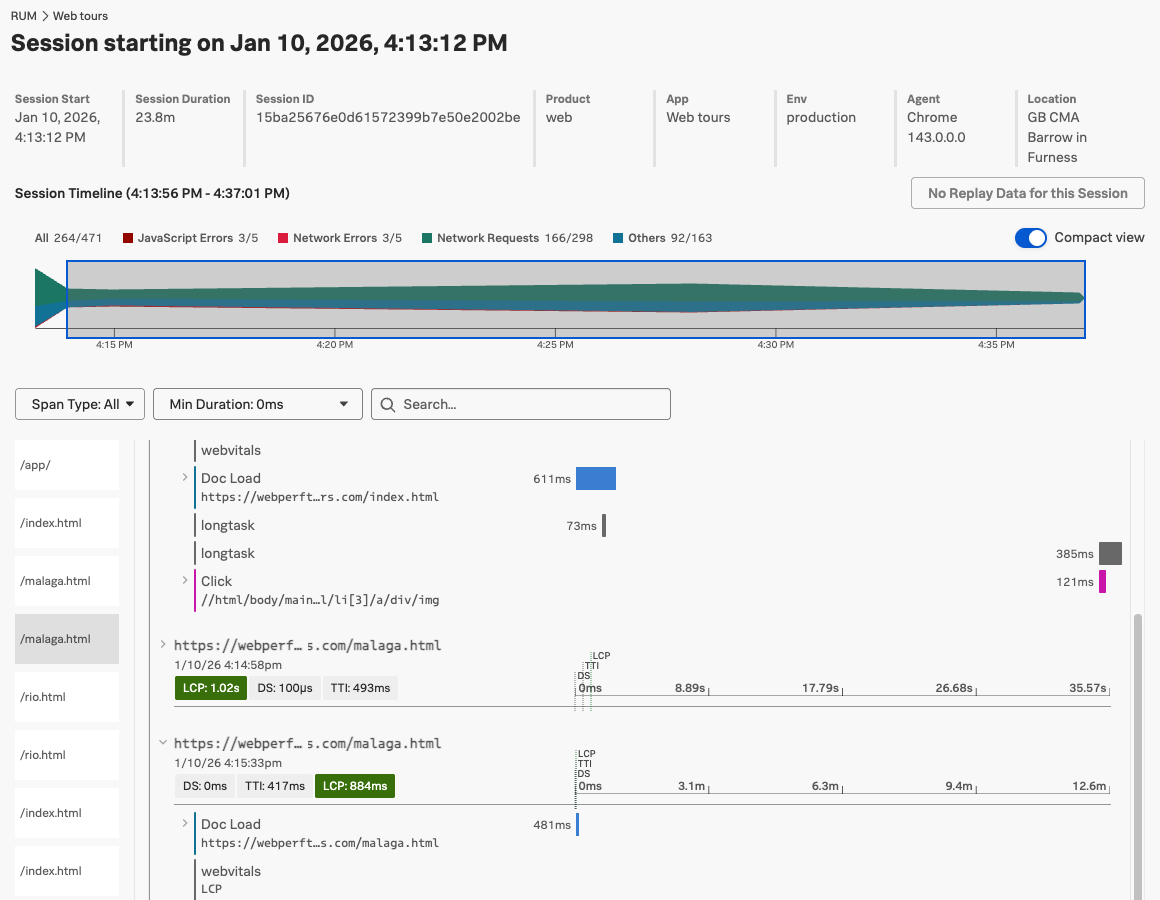
Its real user monitoring feature can track in-depth data on visitor sessions. For example, you can see what requests were made, how visitors interacted with the page, and when long CPU tasks slowed down the page.
Pingdom
Pingdom covers a wide range of website monitoring needs, including uptime monitoring, real user monitoring, and synthetic testing. However, it is more small-business friendly compared to the larger enterprise tools like Dynatrace and New Relic.
While Pingdom provides real user insights and synthetic data, this functionality is more limited compared to more specialized tools.
Sentry
Sentry is an error and performance monitoring service for developers. It offers detailed performance traces to help you identify and fix bottlenecks in your code.
You can also replay sessions to see how users interacted with your website and what their experience was like.
Sentry covers not just end user experience in the browser, but also mobile and backend performance. This makes it a good fit for teams who want full visibility into the technical issues that slow down their product.
What to look for in a DEM tool
The right DEM tool for you depends on what data your team needs, who's using the tool, and what other tools you have already:
- Do you need to tie business metrics and user experience together?
- Does your development team need more detailed technical reporting?
- Are you monitoring a complex application or a simple marketing website?
Digital experience tools tie different types of website monitoring data together. If you're focused on Core Web Vitals and frontend performance, DebugBear is a great fit. For full-stack observability, bigger tools like Dynatrace and New Relic make more sense.
When picking a tool:
- Check what data sources it supports
- Check how you can configure alerting and custom dashboards
- Check what integrations it has with your existing workflow (CI, Slack, etc.)
- Check how the pricing scales with your traffic and usage


Monitor Page Speed & Core Web Vitals
DebugBear monitoring includes:
- In-depth Page Speed Reports
- Automated Recommendations
- Real User Analytics Data