
The User Timing API allows developers to record custom website performance metrics. Find out how to measure what matters most to your users.
What is the User Timing API?
Page speed testing tools collect a range of general-purpose performance metrics when loading a website. For example, they collect data on Core Web Vitals metrics like the Largest Contentful Paint or on the download size of the web page.
However, these metrics aren't tailored to the needs of your users. If you build a chat app the most important thing might be that messages are rendered quickly, even if the user can't send messages yet. For a game you might want to wait until all graphical assets are loaded, but not worry too much about the soundtrack being ready.
To solve this browsers have implemented the User Timing API which allows you to define custom performance metrics that track what's most important to your users. For example, Twitter used "Time to first tweet" as an important metric.
Store a timestamp with performance.mark
The mark function is the core of the User Timing API. It captures a timestamp at the current time and assigns a name to it:
performance.mark("Start Rendering");
You can then access the timings with performance.getEntriesByType("mark"):
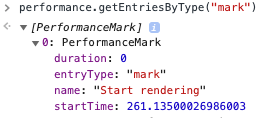
The startTime of the PerformanceMark object tells you how long after opening the page the timing milestone was recorded.
View user timings in synthetic test results
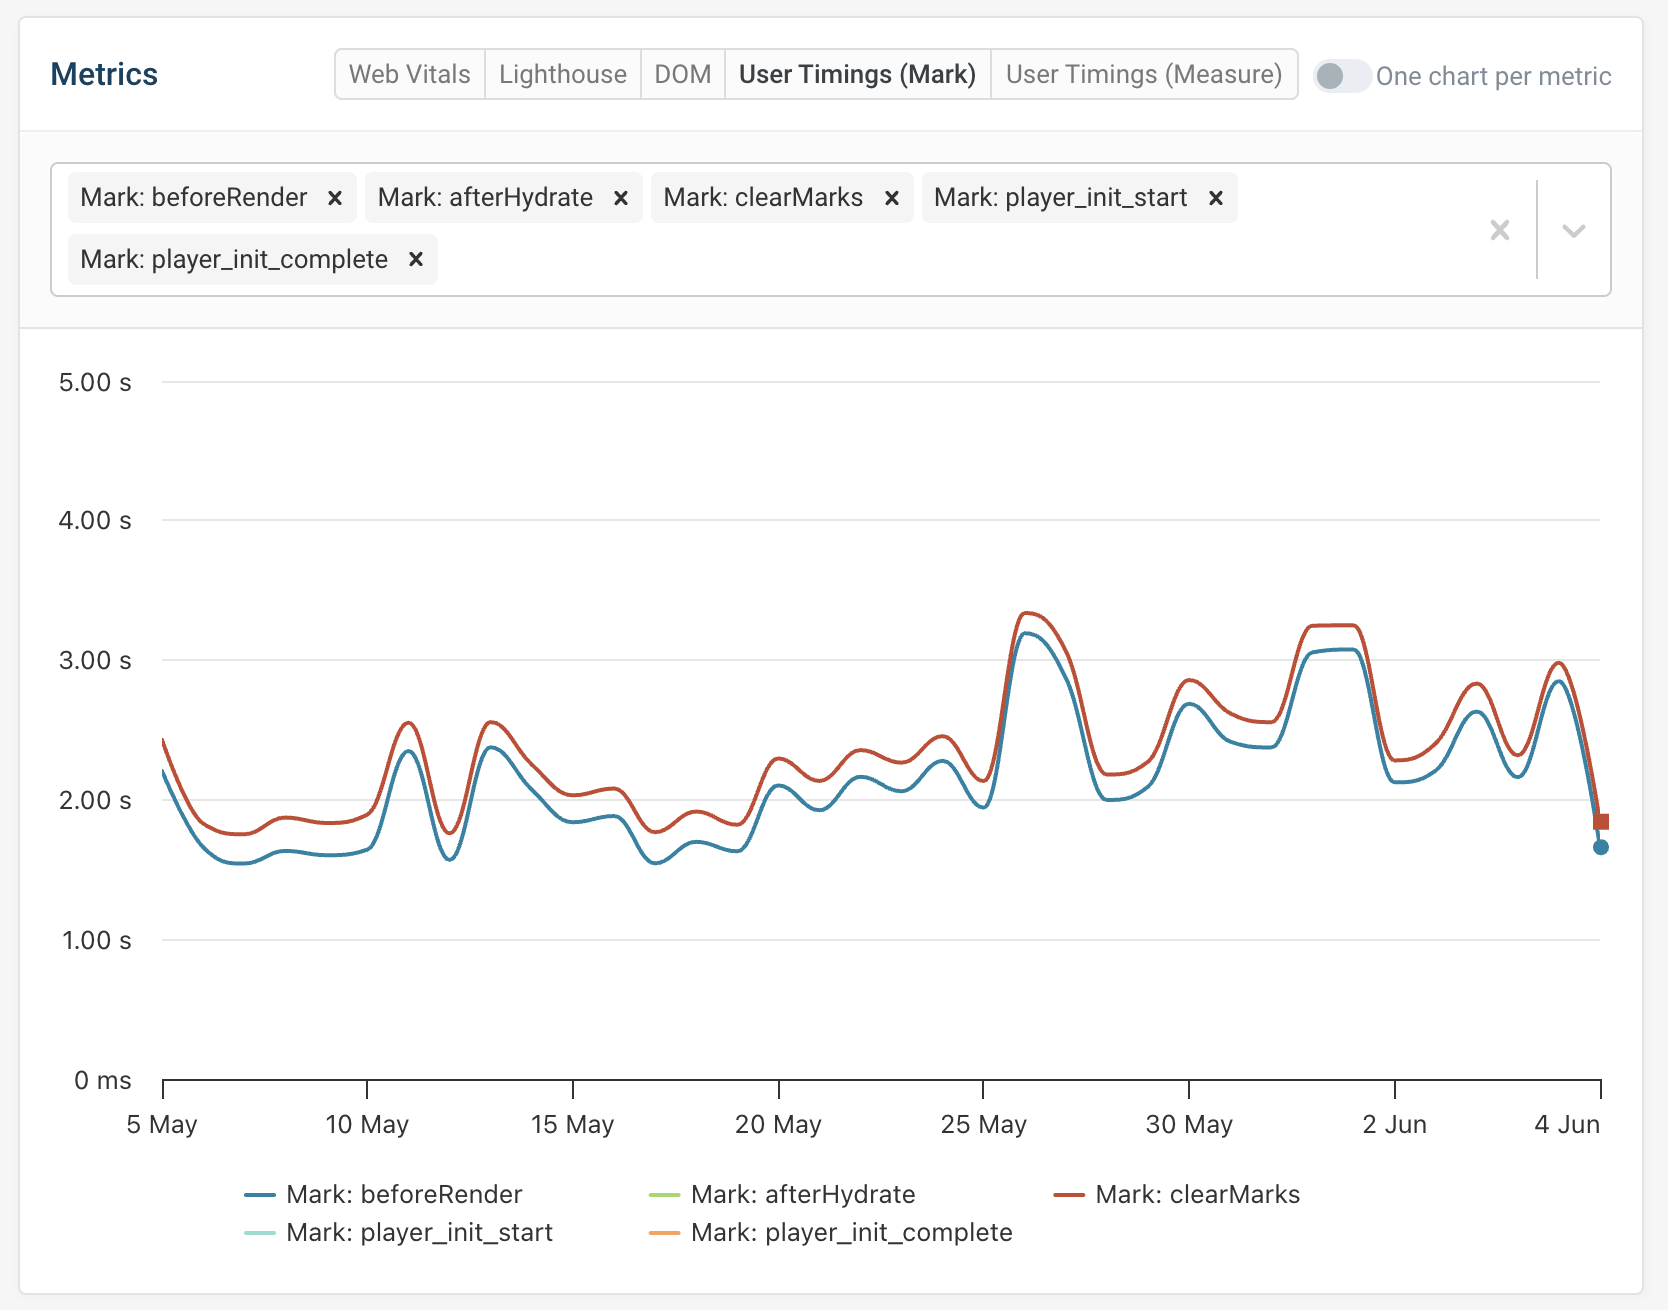
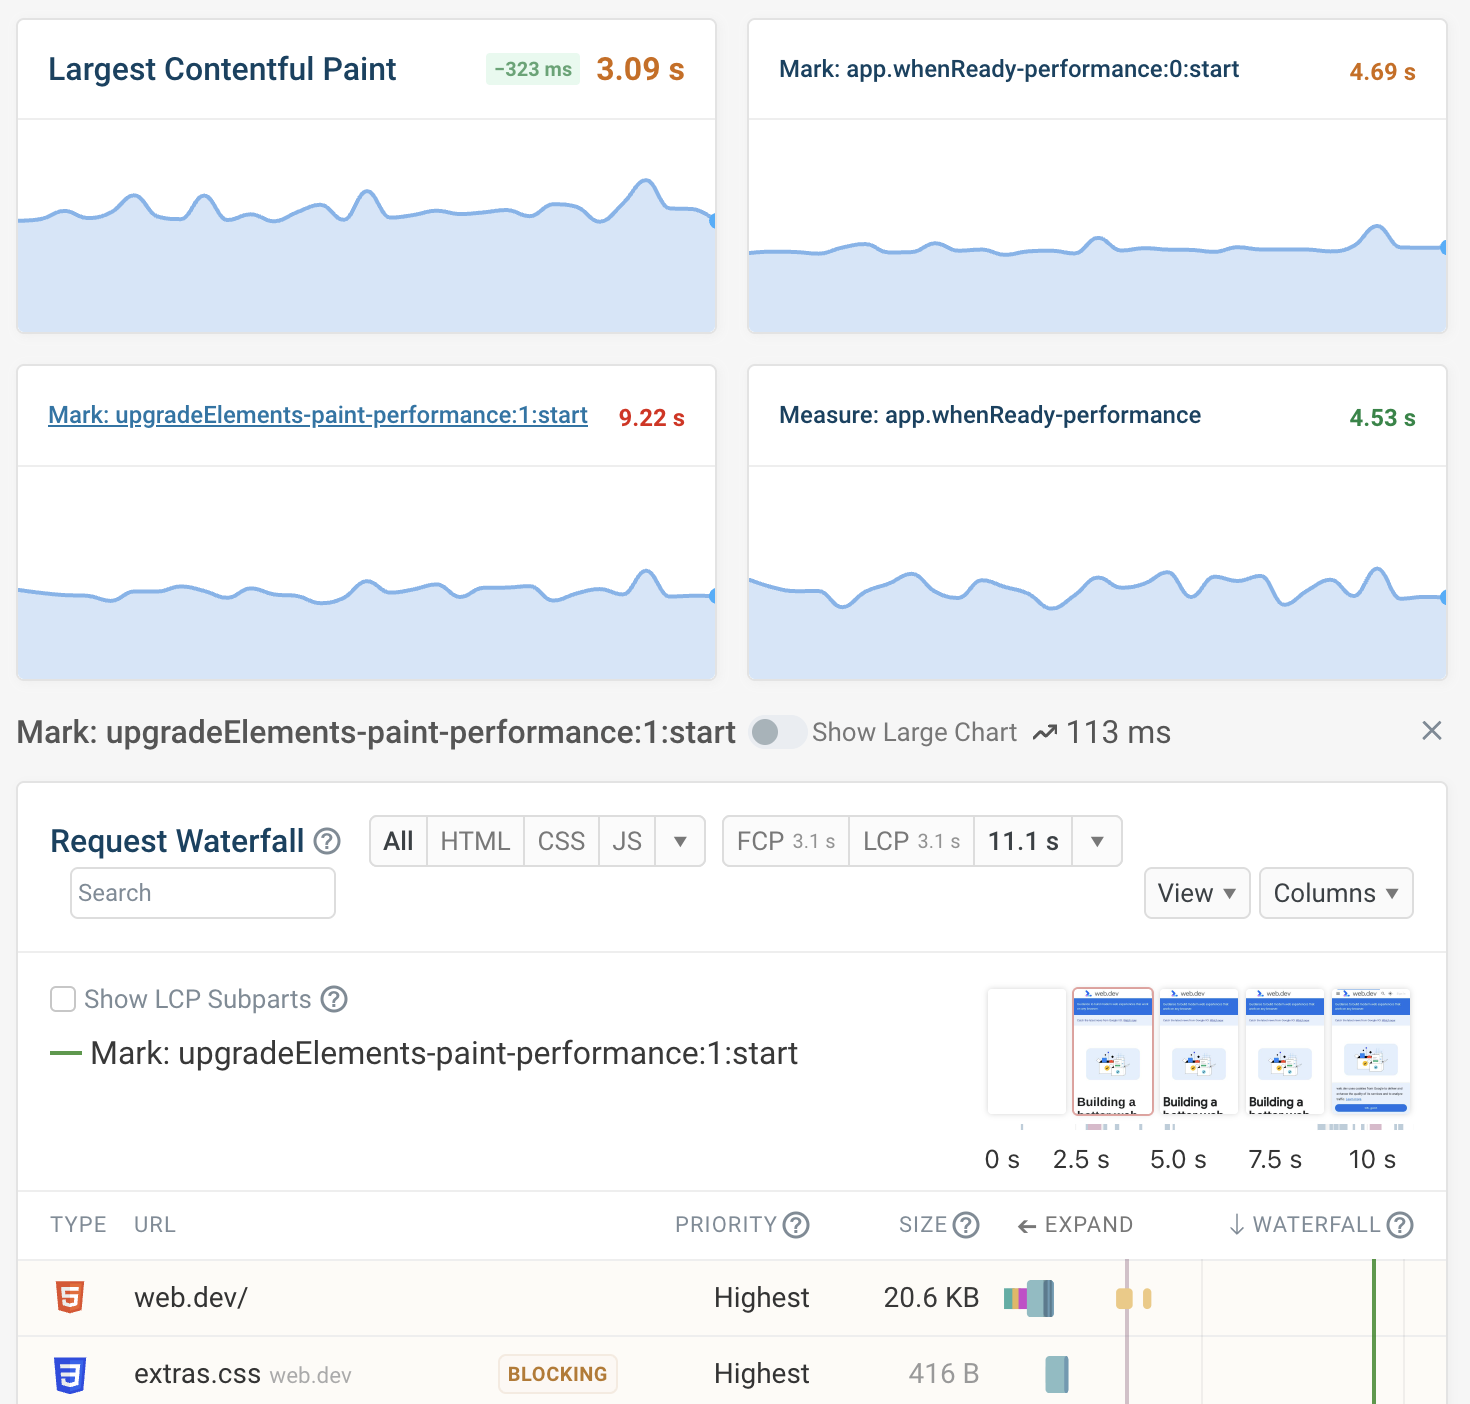
When using the DebugBear website speed test you can view custom user timings in the Metrics tab. Either select each metric manually or click on the User Timings (Mark) option.
You can also use synthetic website monitoring to track custom metrics over time.
Custom rendering milestones in real user monitoring data
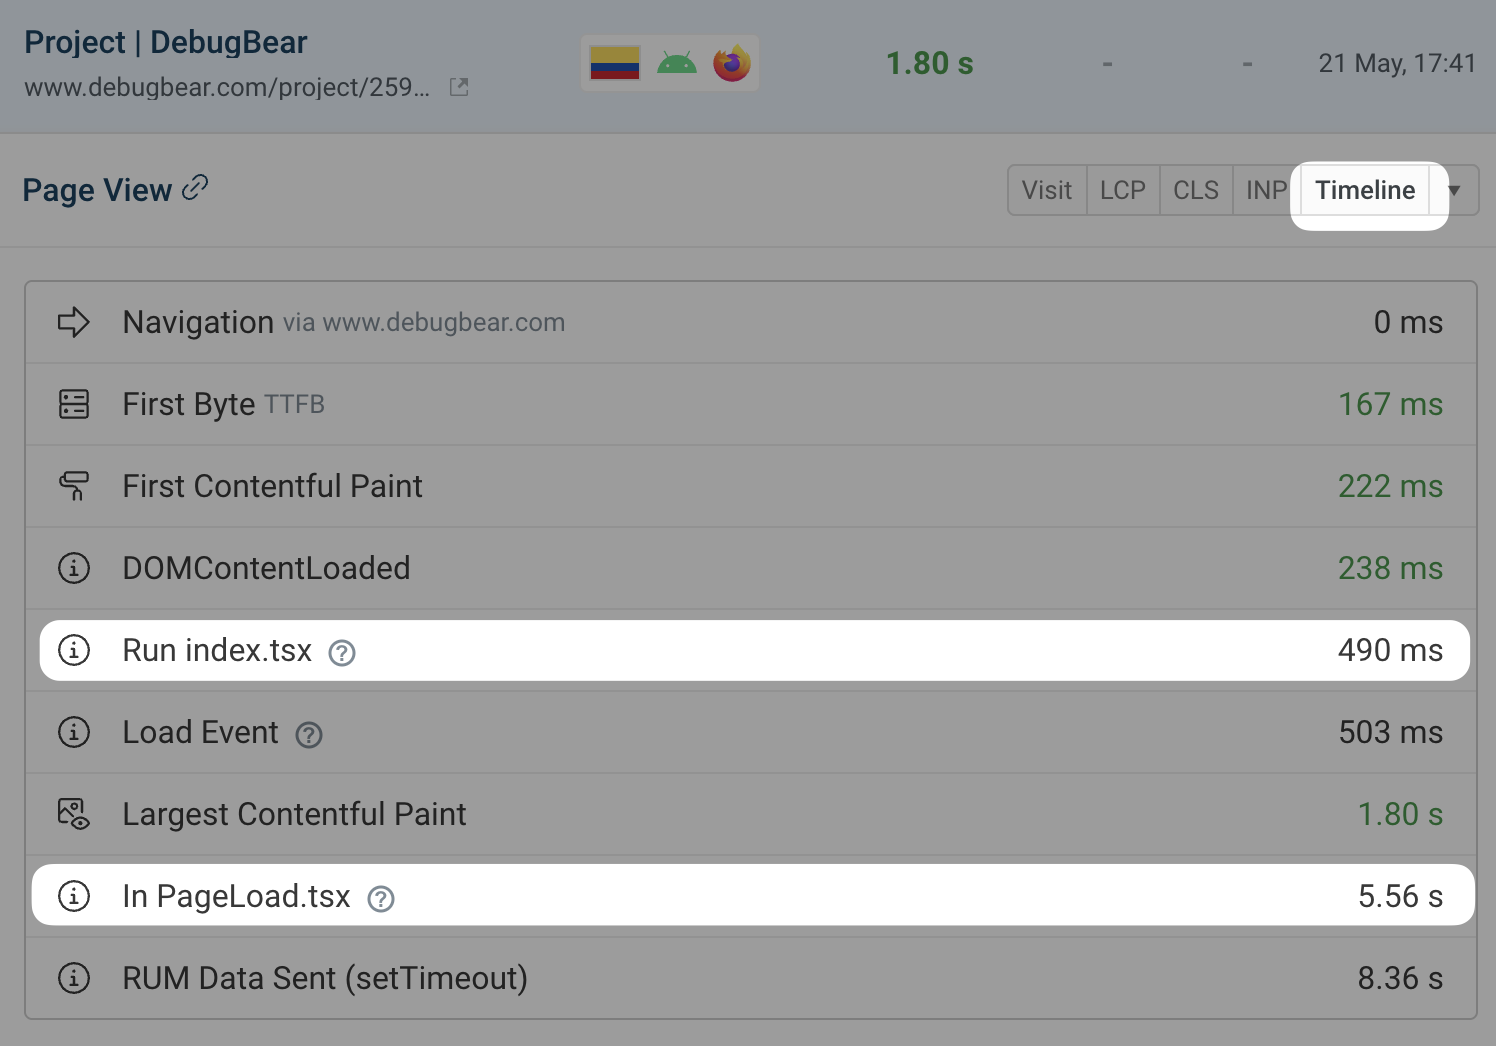
If you use DebugBear's real user monitoring feature, each page view contains a timeline showing important events and page load milestones.
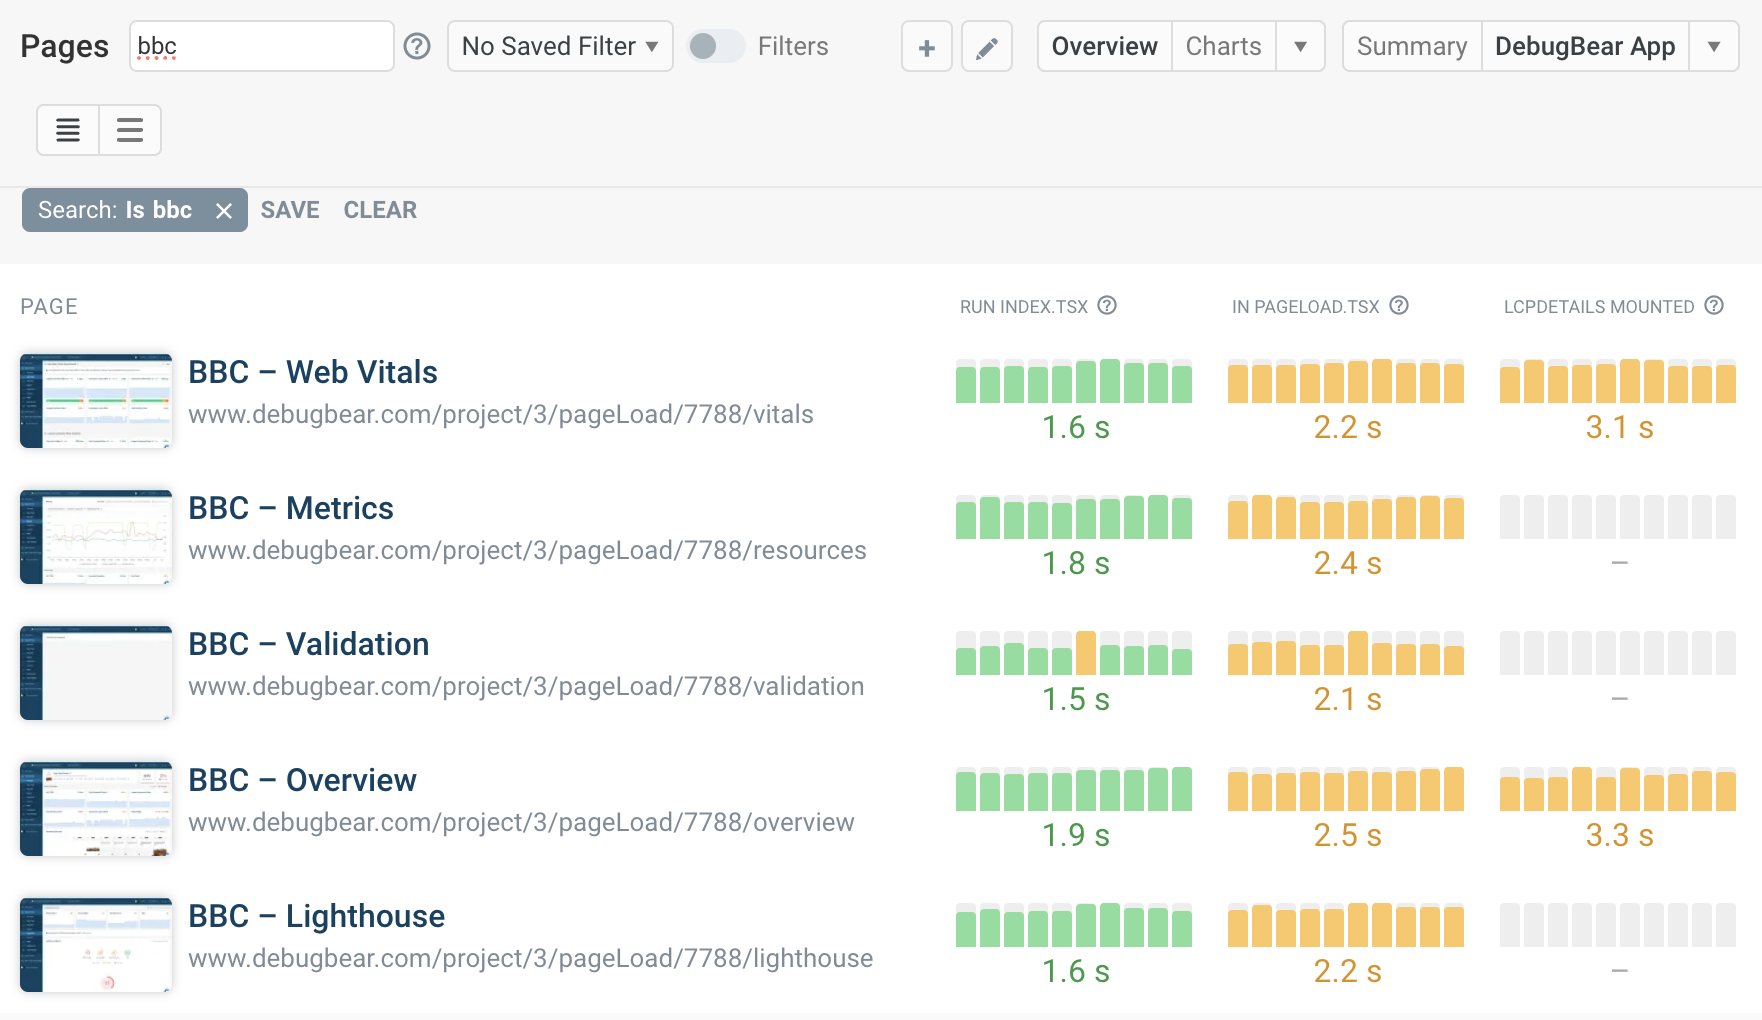
You can also monitor custom metrics by picking up the user timing name automatically.
Measure time spans with performance.measure
If you want to track the duration of a specific step you can use performance.measure. It takes three arguments:
- The name of the time span being measured
- The name of the performance.mark entry at the start
- The name of the performance.mark entry at the end
Here's an example:
performance.mark("Start rendering");
for (var i = 0; i < 1000; i++) {
  document.body.innerHTML += Math.random().toString().slice(1) + " ";
}
performance.mark("Finish rendering");
performance.measure("Rendering", "Start rendering", "Finish rendering");
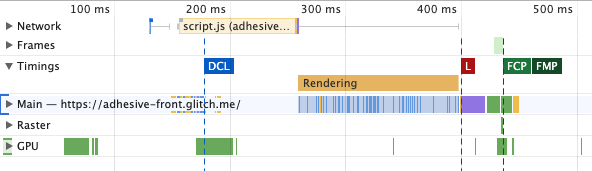
We can read the measure duration from performance.getEntriesByType("measure"), and it also shows up in the DevTools performance tab:
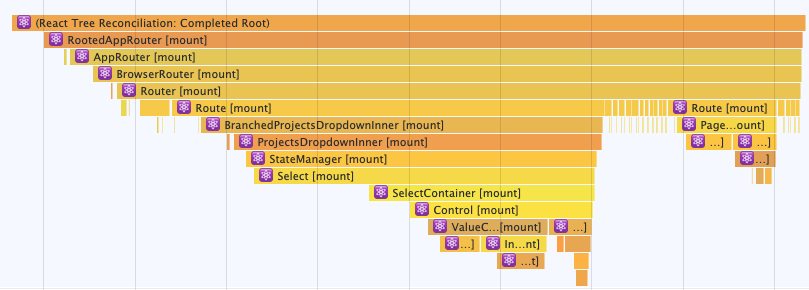
In development mode React also uses this API to track component timings automatically:
User timing marks and measures in Lighthouse
When running a test with Lighthouse or PageSpeed Insights you can find user timing measurements in an informational audit under the Diagnostics section.
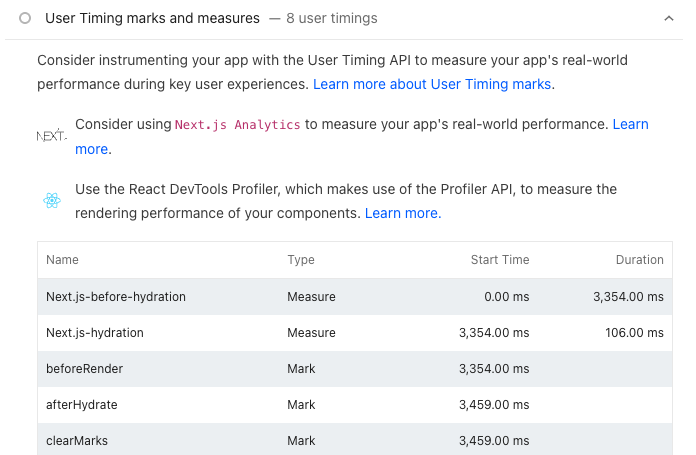
Google recommends using user timings to measure events that are core to user experience:
Consider instrumenting your app with the User Timing API to measure your app's real-world performance during key user experiences.
Monitor user timings in DebugBear
You can monitor your website with DebugBear to keep track of custom and general-purpose web performance metrics.
Standardized page speed metrics are easy to measure and compare across websites, for example when benchmarking website performance in your industry.
Custom metrics provide an opportunity to think about your user needs and how to best measure page load speed on your website.


Monitor Page Speed & Core Web Vitals
DebugBear monitoring includes:
- In-depth Page Speed Reports
- Automated Recommendations
- Real User Analytics Data