
Network throttling can simulate how users on a slow connection would experience loading a website. Simulating a slower mobile network is a common feature of page speed testing tools like PageSpeed Insights, Chrome DevTools, or the DebugBear site speed test.
However, there are different ways to simulate a slower connection, and you'll see different page speed metrics depending on which method is used by your testing tool.
Network throttling methods: DevTools vs. Lighthouse vs. Netem
This post compares three different throttling options:
- Network throttling in Chrome DevTools
- Simulated throttling with Lighthouse
- OS-level throttling with Netem
Let's take a look at how each of these options works.
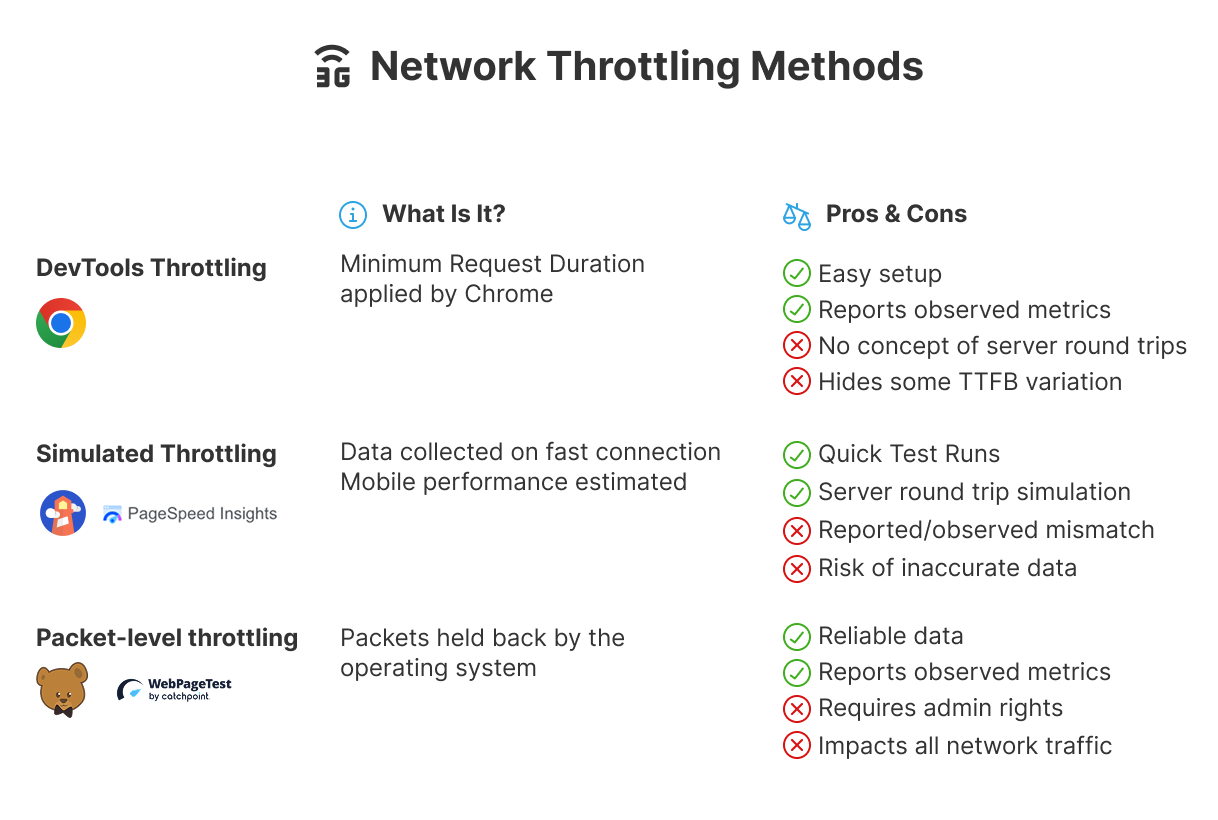
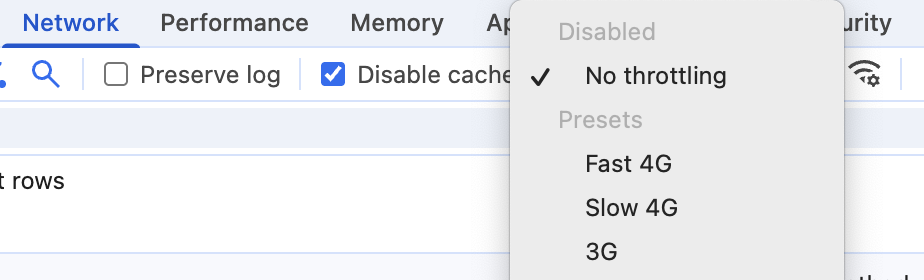
DevTools throttling
You've probably seen the throttling options in Chrome DevTools. They add a browser-level delay when the response is received. Only a specific tab in Chrome is impacted by the throttling.
However, DevTools throttling has no concept of server connections or network round-trips. Instead, it acts as a minimum request duration.
Lighthouse simulated throttling
Lighthouse doesn't actually use a throttled connection when loading the page. Instead it collects data on a fast connection and then simulates how the page would have loaded on a slower connection. That means Lighthouse tests take less time to run.
Simulated throttling can produce unreliable data when the simulation does not match real browser behavior.
While simulated throttling is the default, you can specify what throttling method Lighthouse should use when running a test.
Packet-level throttling
Netem is an OS-level network throttling tool for Linux. There are cross-platform wrappers around it, for example comcast.
Packet-level throttling holds back each data packet at the operating system level. That makes this throttling method the most reliable. However, you need admin rights to enable it and it impacts all processes running on your computer.
Example 1: A plain HTML document
Here are the timing results for a website with just a single document request. For each tool I specified a round-trip latency of 150ms and a bandwidth of 1638kbps.
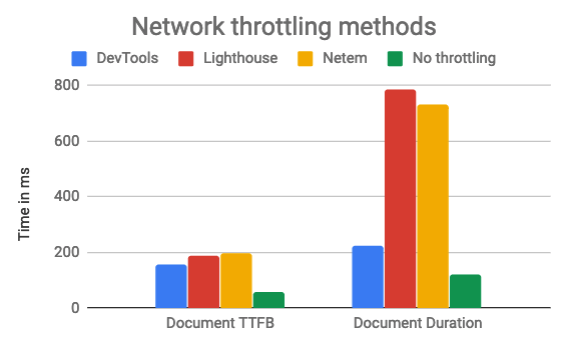
The Time to First Byte (TTFB) is the time it takes for the client to receive a response after sending a request. That's one network round-trip plus how long the server took to generate the response.
If we assume the server takes 30ms to respond then we would expect a TTFB of 180ms. And that's pretty much matches what we see.
However the full request duration varies a lot by throttling method. My HTML document is really small, so the variation is not because of the time it takes to download the document. Instead there are additional round-trips for DNS resolution and establishing a connection to the server.
You can see that DevTools only delays when the server response is received, rather than simulating each round-trip. (Which is why when running Lighthouse with --throttling-method=devtools it actually simulates a higher latency than normal to even out the differences.)
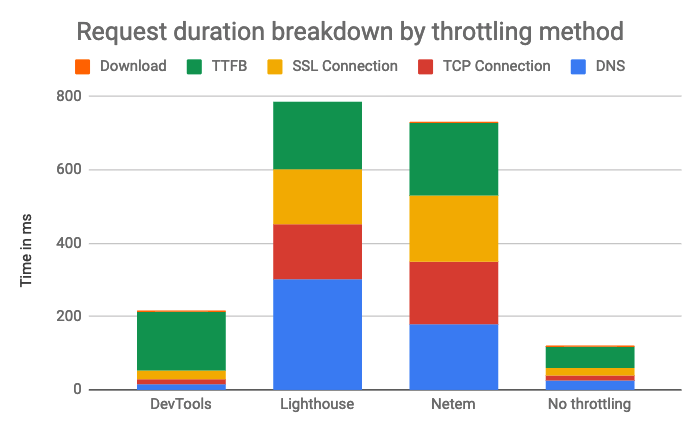
Both Lighthouse and Netem throttle round-trips for DNS resolution as well as establishing TCP and SSL connections.
Lighthouse always simulates two round-trips to resolve the domain name, but in this case only one was necessary.
Netem adds the round-trip time to the actual time taken for the network transfer, so e.g. establishing the TCP connection takes 180ms instead of 150ms.
Example 2: Adding a second request to the same domain
Let's add a small CSS file to the page:
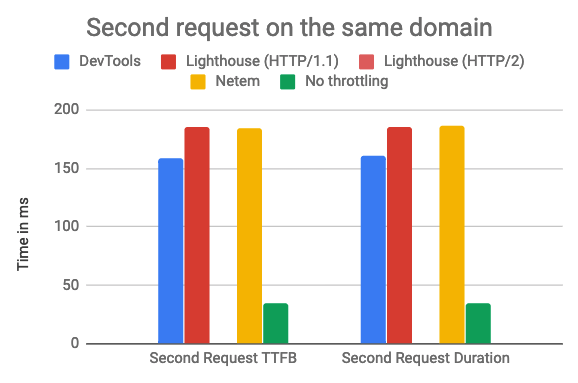
The timing differences between the different tools are much lower than before. Once the connection is established we just need a single round-trip for the HTTP request.
What’s up with Lighthouse when using HTTP/2 though? HTTP/2 brings down the cost per additional request because the browser can make multiple requests simultaneously on the same connection. On a page with many requests that means that the time spent sending the request is negligible compared to the download time.
Because of this, Lighthouse doesn't simulate an additional roundtrip for each request. However, in this case we only have one extra request and Lighthouse is underestimating the cost.
While Lighthouse is overly optimistic about the cost of HTTP/2 requests, DevTools is overly pessimistic and adds the round-trip delay even when a round-trip isn’t necessary. Netem will be most accurate in this case.
Example 3: Delaying the server response by 1s
What do the TTFB numbers look like if the server waits for a second before sending the response to one of the requests?
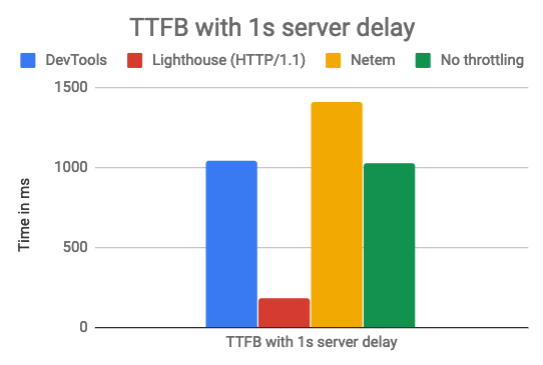
If the round-trip time is 150ms and the server takes 1s to respond we'd expect a TTFB of 1.15s under ideal network conditions.
You can see that Netem adds the delay on top of the server response time, while DevTools doesn’t add an extra delay if the specified latency is already met.
Lighthouse does take the server’s response time into account, but it always uses the median response time for that origin, rather than a per-request TTFB. So if there are only three requests taking 30ms, 40ms, and 1000ms then the simulation uses the 40ms response time for all requests.
So even though the server waits 1s before finishing the slow requests, Lighthouse uses a TTFB of 190ms (150ms roundtrip + 40ms server delay).
Example 4: Downloading a large file
No website would be complete without a 4MB JavaScript bundle!
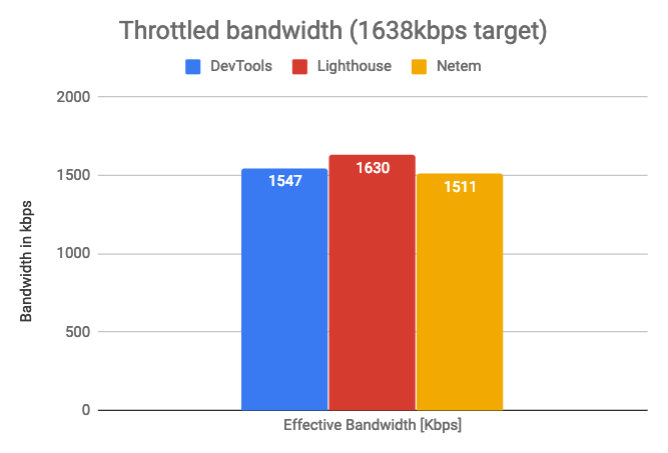
There's not a huge amount of variation here between the different throttling methods.
Lighthouse is closest to the specified bandwidth. The first and last downloaded chunks are smaller than the maximum size, which explains the small difference.
Netem presumably encounters some additional delay from the real network. With DevTools I'm not quite sure why it isn't closer to the specified value.
Conclusion
The different throttling methods optimize for different use cases.
DevTools is interactive, easy to use, and pretty accurate. It's less accurate if your page is constrained by backend response times or if you are connecting to lots of different servers.
Lighthouse simulated throttling aims for quick analysis runs and a low variance between different runs, but it sacrifices some accuracy.
Netem best preserves real network characteristics, but it needs to run as admin and will throttle the network for your entire computer. Not covering up real network conditions is great for realism, but less great for variance when loading a page multiple times.
DevTools and Lighthouse make it easy to get an overall picture of the speed of a web page. If your page load times depend a lot on how fast your API responses are, either use a network-level throttling tool or no throttling at all.
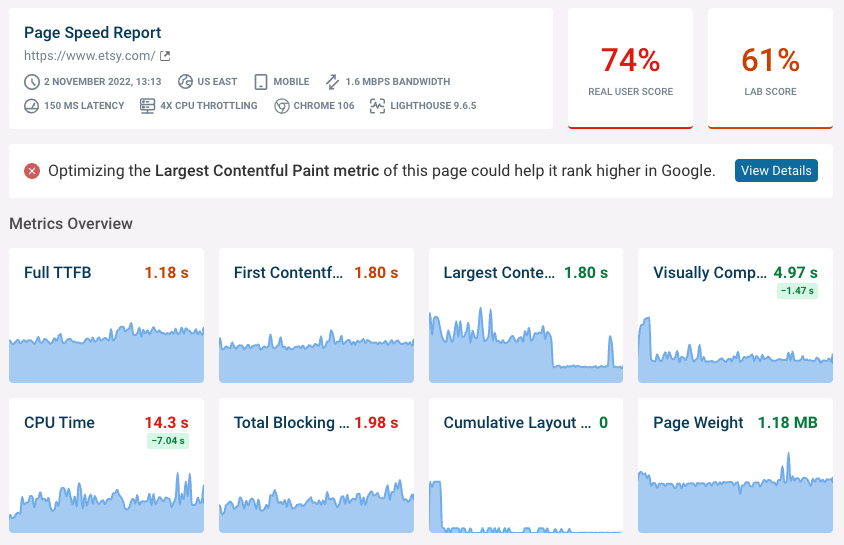
Our site speed Chrome extension can surface observed metrics on PageSpeed Insights in addition to the simulated values.
Monitor the speed of your website over time
DebugBear is a website monitoring tool that keeps track of your speed metrics and produces an in-depth analysis of your website performance.
Sign up for a 14-day trial or try our free website speed test.


Monitor Page Speed & Core Web Vitals
DebugBear monitoring includes:
- In-depth Page Speed Reports
- Automated Recommendations
- Real User Analytics Data