
In this tutorial, I'll show you how to use JMeter to load test your website. We'll explore what JMeter does, the basic concepts you'll need to understand, creating scripts, running tests, and how to interpret the results.
What is JMeter?
If you haven't heard of JMeter, it's a load generation tool used for simulating hundreds to thousands of website users visiting your website. It's open-source software developed by the Apache Software Foundation.
You generally use load testing to performance test new features, software, or architecture changes to ensure the application and its underlying infrastructure can sustain the expected workload.
Think of testing your system to make sure it's ready for a Black Friday sale, or ensuring everything is configured correctly when you're migrating to the cloud.
Why JMeter?
In my mind, there are three key reasons to choose JMeter:
- It's free. We all love free stuff. Is it any good just because it's free? Well, I'm not going to get into any arguments with paid tool vendors, but it is one of the most popular free load testing tools. You're in good company when you use JMeter.
- There's a large ecosystem of information, help, and YouTube videos on how to use and work with JMeter. I've worked with other free tools that lacked the depth of available information, which is invaluable when trying to debug problems.
- It's a GUI-based product, which makes it suitable if you have limited coding experience.
Basic Concepts
Typically, in performance testing, you want to emulate groups of users executing different user journeys through your website or application.
Think of a site selling books. The majority of your users will be browsing the site looking for books, others will be purchasing books, and some may be checking on their orders. In this case, there are three different user journeys.
In each journey, users click on pages, enter data, and "think" before moving on to the next page. Each has a different route through the website (although there are common pages).
To represent a busy workload on your website, you may emulate different numbers of users, such as 80 browsing, 15 purchasing, and 5 order checking. These would make up the test scenario you want to execute for your test.
Note that these users are virtual; in the performance test, once a virtual user has completed their journey, they restart from the beginning.
It's worth noting that JMeter is not emulating the user click at the browser level, as this would mean having a browser for every user you want to emulate. Instead, JMeter emulates the HTTP traffic that's generated by the browser resulting from a user action or click.
There are ways to script at the browser click level using tools like Selenium and WebDriver. The problem is that this approach is very resource-intensive (lots of CPU, RAM, etc.).
How does the above map to JMeter?
Test Plan
A test plan is the top-level container for your performance test scenario. It's the root element that holds all other test components and defines what JMeter will execute.
You'll put in global settings and user-defined variables here, but more importantly, you'll list the user journeys. JMeter calls these Thread Groups—think of each thread as a virtual user executing a user's journey. You'll have a Thread Group for each user journey type, like browsing or order checking.
Thread Group
A thread group represents a pool of virtual users (threads) that will execute a user journey scenario. It's where you define the load characteristics of that journey and the steps involved in it.
Since the journey is a series of HTTP calls to your website, you need to include these in your Thread Group. For this, in JMeter, you'll use samplers—and specifically for HTTP, the HTTP Sampler!
HTTP Sampler
The HTTP Sampler sends HTTP requests (GET, POST, PUT, DELETE, etc.) to web servers. You'll typically provide the URL for the page you want to emulate, along with any particular parameters, port number, etc.
Timer
The timer is the element that allows you to add the user's "thinking time" between actions in the user journey. This makes your load test more realistic, as some problems occur due to the number of active users in the system rather than just the number of transactions completed.
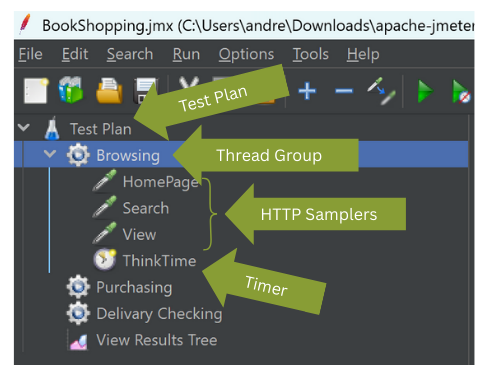
There are various timer types to represent how the user might think. Also, the placement of the timer affects when they're invoked. In the example below, it's added at the Thread Group level, so every HTTP sampler is delayed by the same time.
Listeners
A listener is a component that collects, displays, and stores the results from test executions. Without them, your test would be very dark, and you really want to see the results of a test!
The graphic below highlights the key components.
Tutorial: Getting Started with JMeter
Installing JMeter
Go to https://jmeter.apache.org/download_jmeter.cgi and select the appropriate download for your operating system.
I downloaded the zip file for my Windows laptop and unzipped the contents into a folder. If you already have Java installed, all you need to do is navigate to the JMeter bin directory and click jmeter.bat.
Creating Your First Test
I'll guide you through creating your first, very simple test to illustrate the concepts. For this exercise, you'll simply be calling the home page multiple times, with a delay between each call. In this example, I've used www.example.com, but try replacing it with your own website name.
The first thing you need to do is create the Thread Group. You're going to use the most commonly used thread group in JMeter, called unimaginatively "Thread Group."
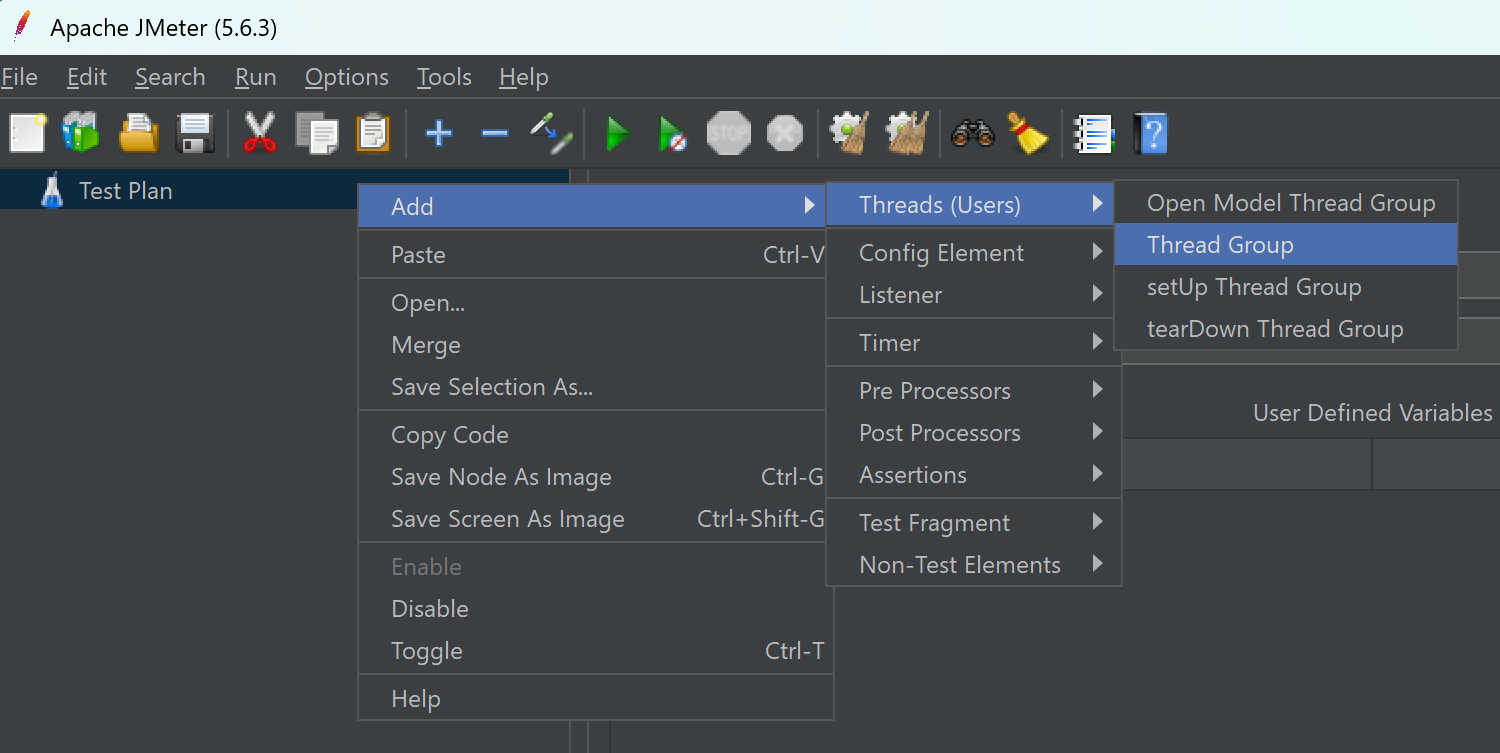
With JMeter started, right-click on Test Plan and select Thread (Users) → Thread Group.
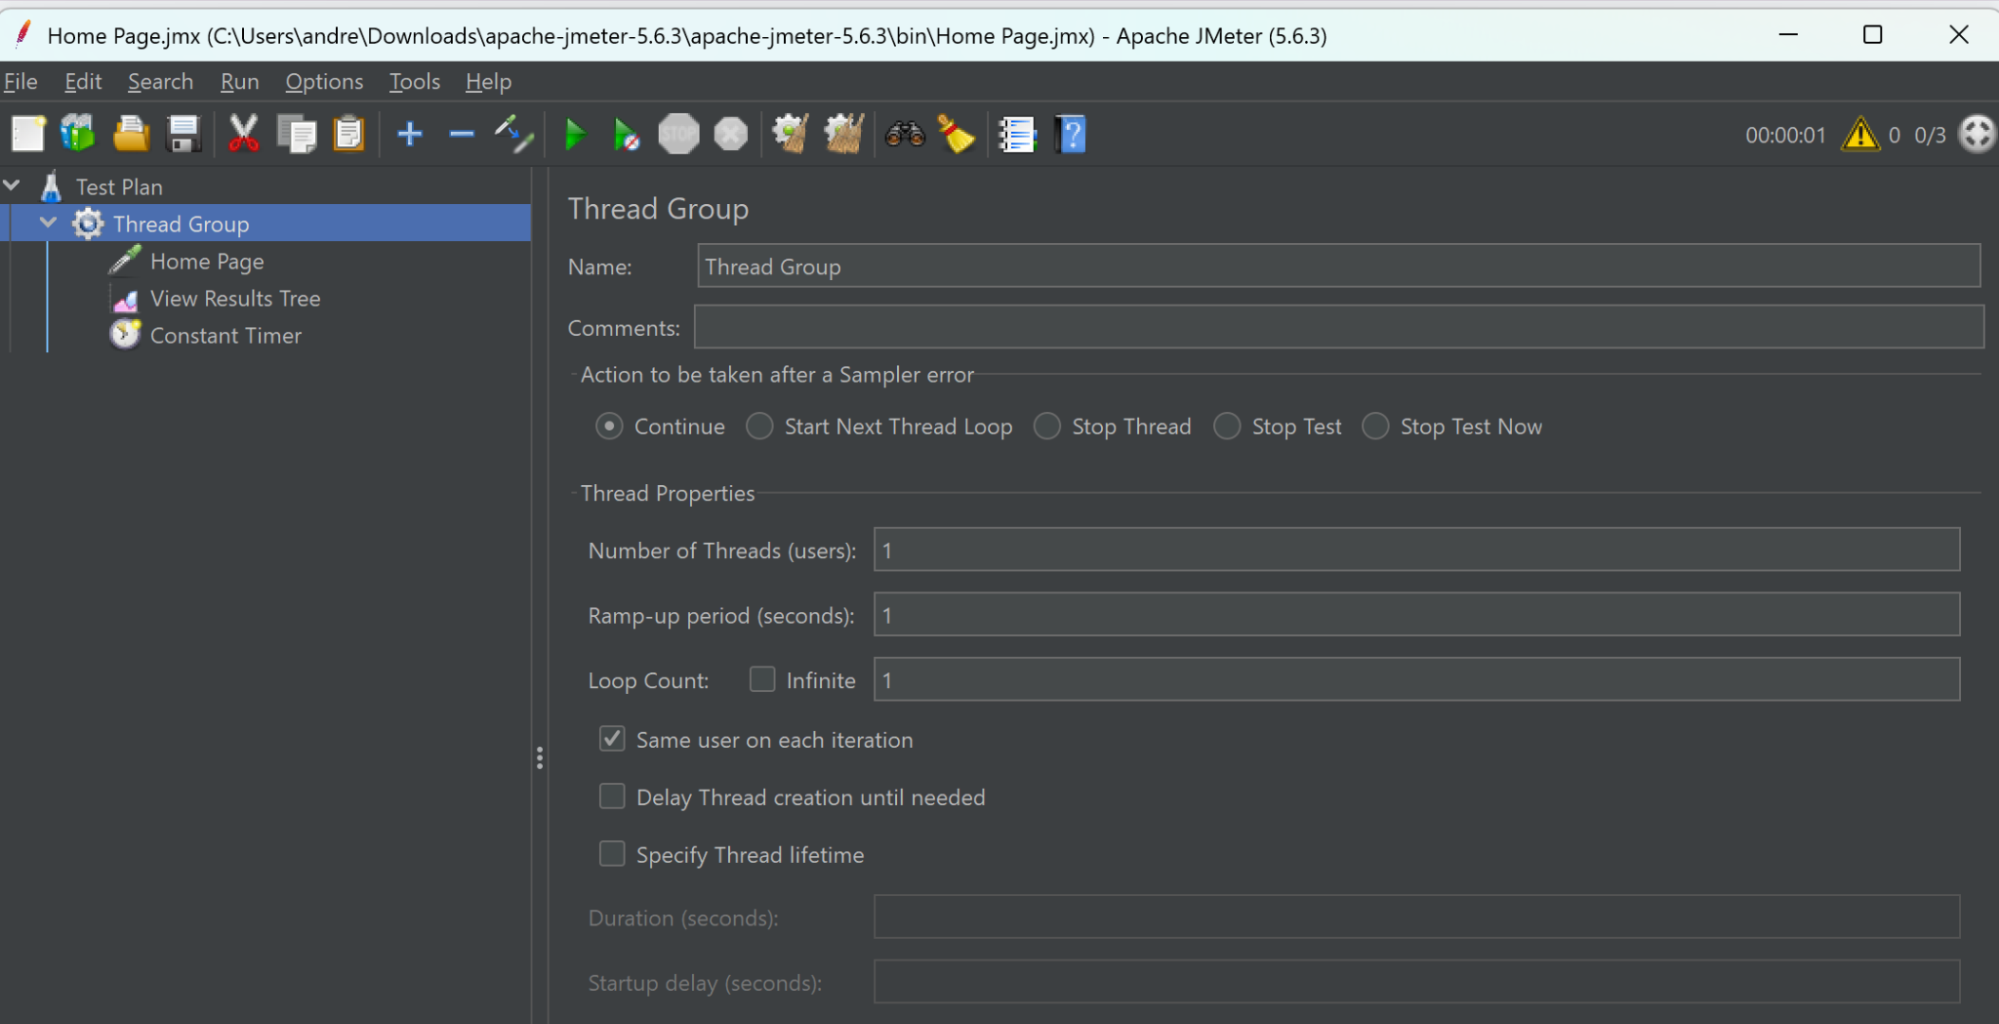
After creating a thread group, you should have a screen like the one below. At this stage, leave the defaults as you simply want to run a single execution.
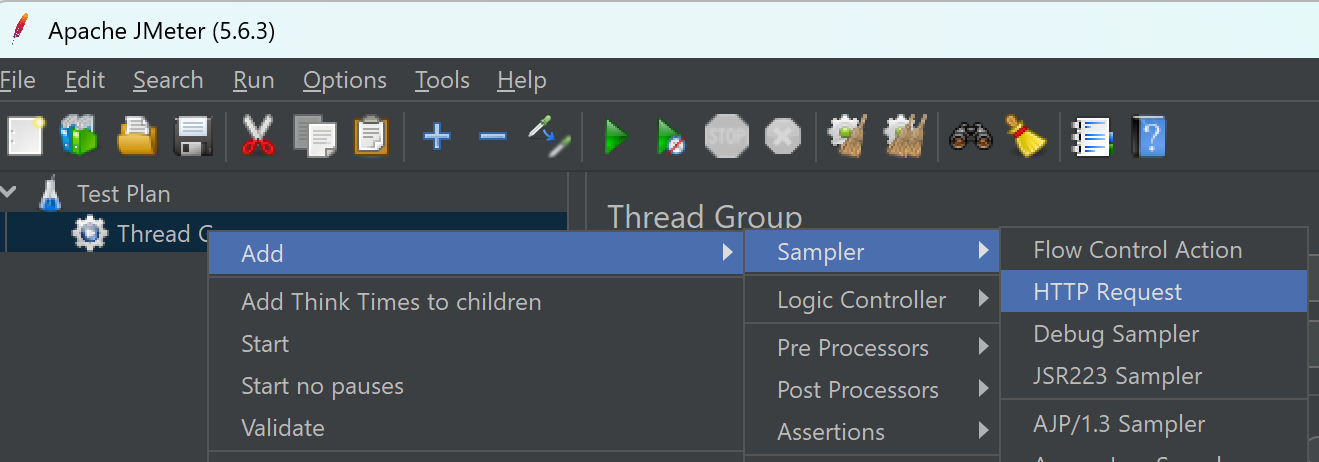
Next, you have to make the call to the home page. To do this, you'll use the HTTP sampler. To add the sampler, right-click on the Thread Group and select Sampler → HTTP Request.
Next, you need to fill out the information in the sampler with the information below:
- Name: Home Page
- Protocol: https
- Server or IP: www.example.com
- HTTP Request: GET (select from the drop-down options)
- Path: /
You should have a sampler looking like the one below:
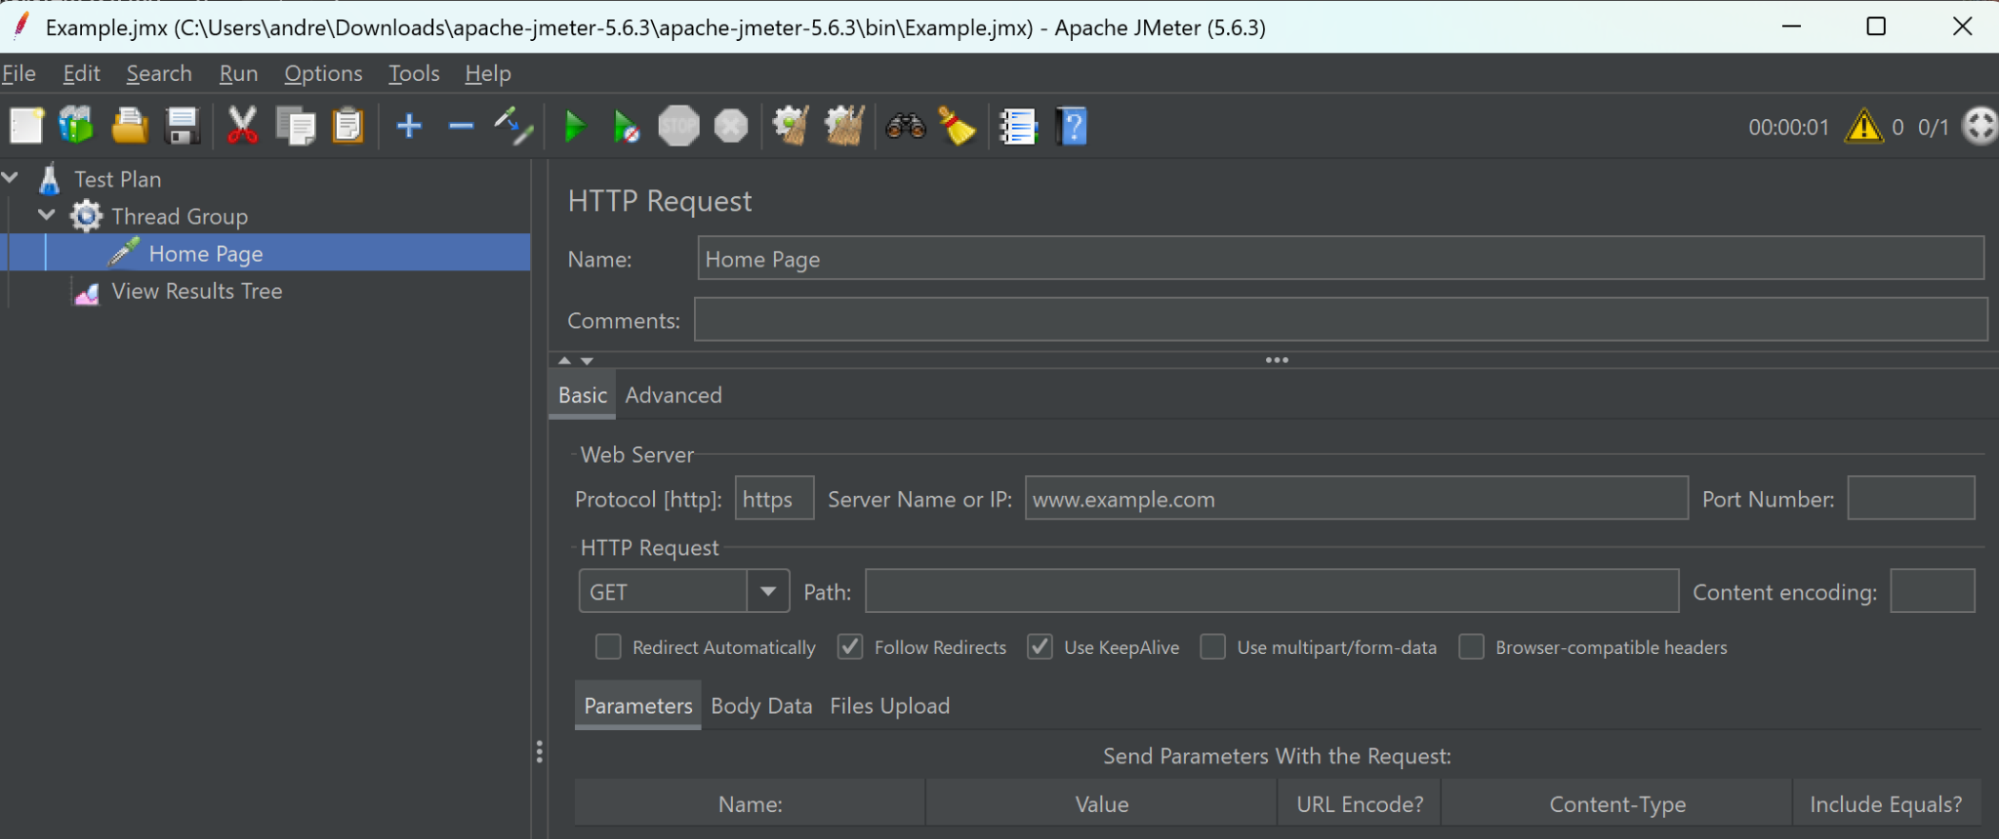
What you've just done is tell JMeter to execute an HTTP GET request to www.example.com.
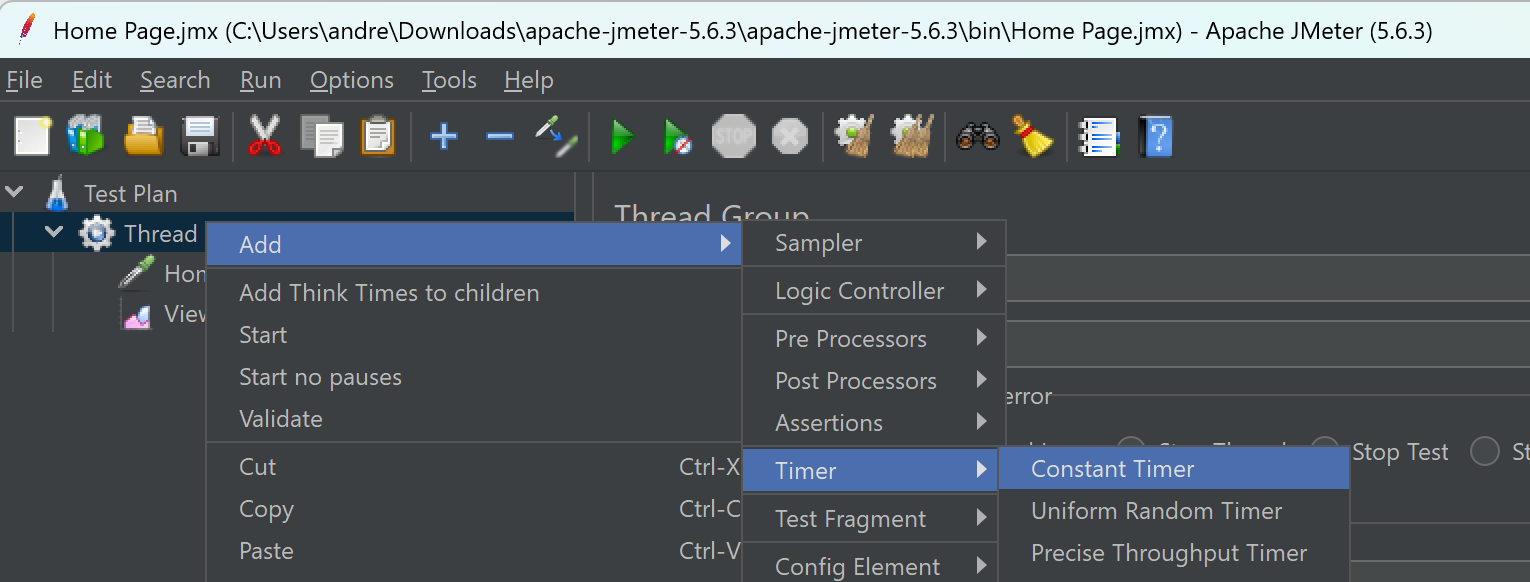
Now you want to add a timer for good measure. To do this, right-click on the Thread Group and select Add → Timer → Constant Timer.
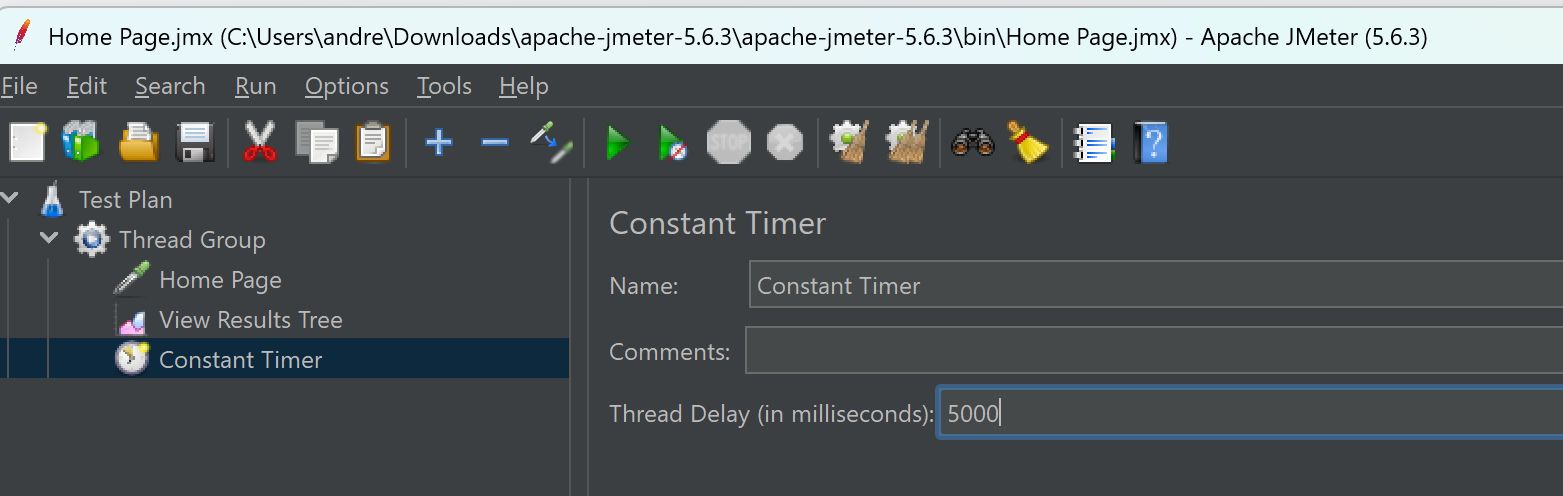
In this example, you want a simple fixed 5-second delay between each home page request. This is achieved with the Constant Timer and setting the Thread Delay (in milliseconds) to 5000.
Lastly, you want to be able to see the results from the test. To do this, we use what's called a listener. As the name suggests, it's responsible for listening to what's happening when you run a test and capturing the results, calls, responses, etc.
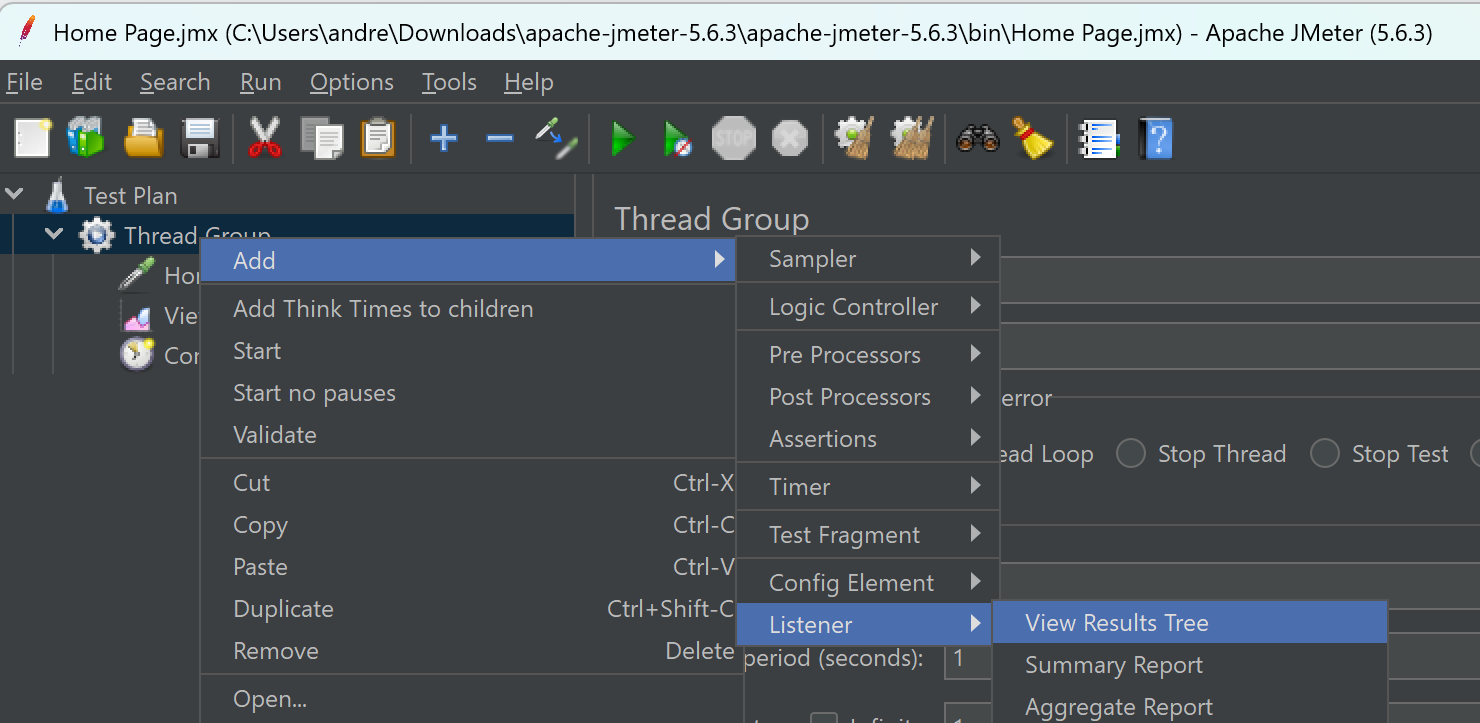
There are many different types of listeners. For a very simple test, add the View Results Tree so you can see if your script is working. To do this, right-click on the Thread Group and select Add → Listener → View Results Tree.
OK, you've created your first test. Before you can run a JMeter test, you have to save it. This can be done simply by clicking on the save icon on the top menu bar.
Just give it a name and store it in a sensible location. All JMeter scripts are stored with a .jmx extension, which is an XML format readable by JMeter.
Now you're ready to run, but first, review what workload you're asking JMeter to do. If you click on the Thread Group, you'll see that you're not placing a very high load on the system.
You're only asking for one thread (Number of Threads (users)) and to repeat the user journey once (Loop Count). At this stage, stick with this and keep it simple. It will be helpful if you need to perform any debugging.
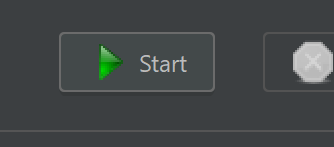
So, let's get ready to rumble. To start the test, press the big green arrow on the top toolbar. Either will do—the one on the left waits for any timers, and the one on the right ignores them (great if you're debugging scripts).
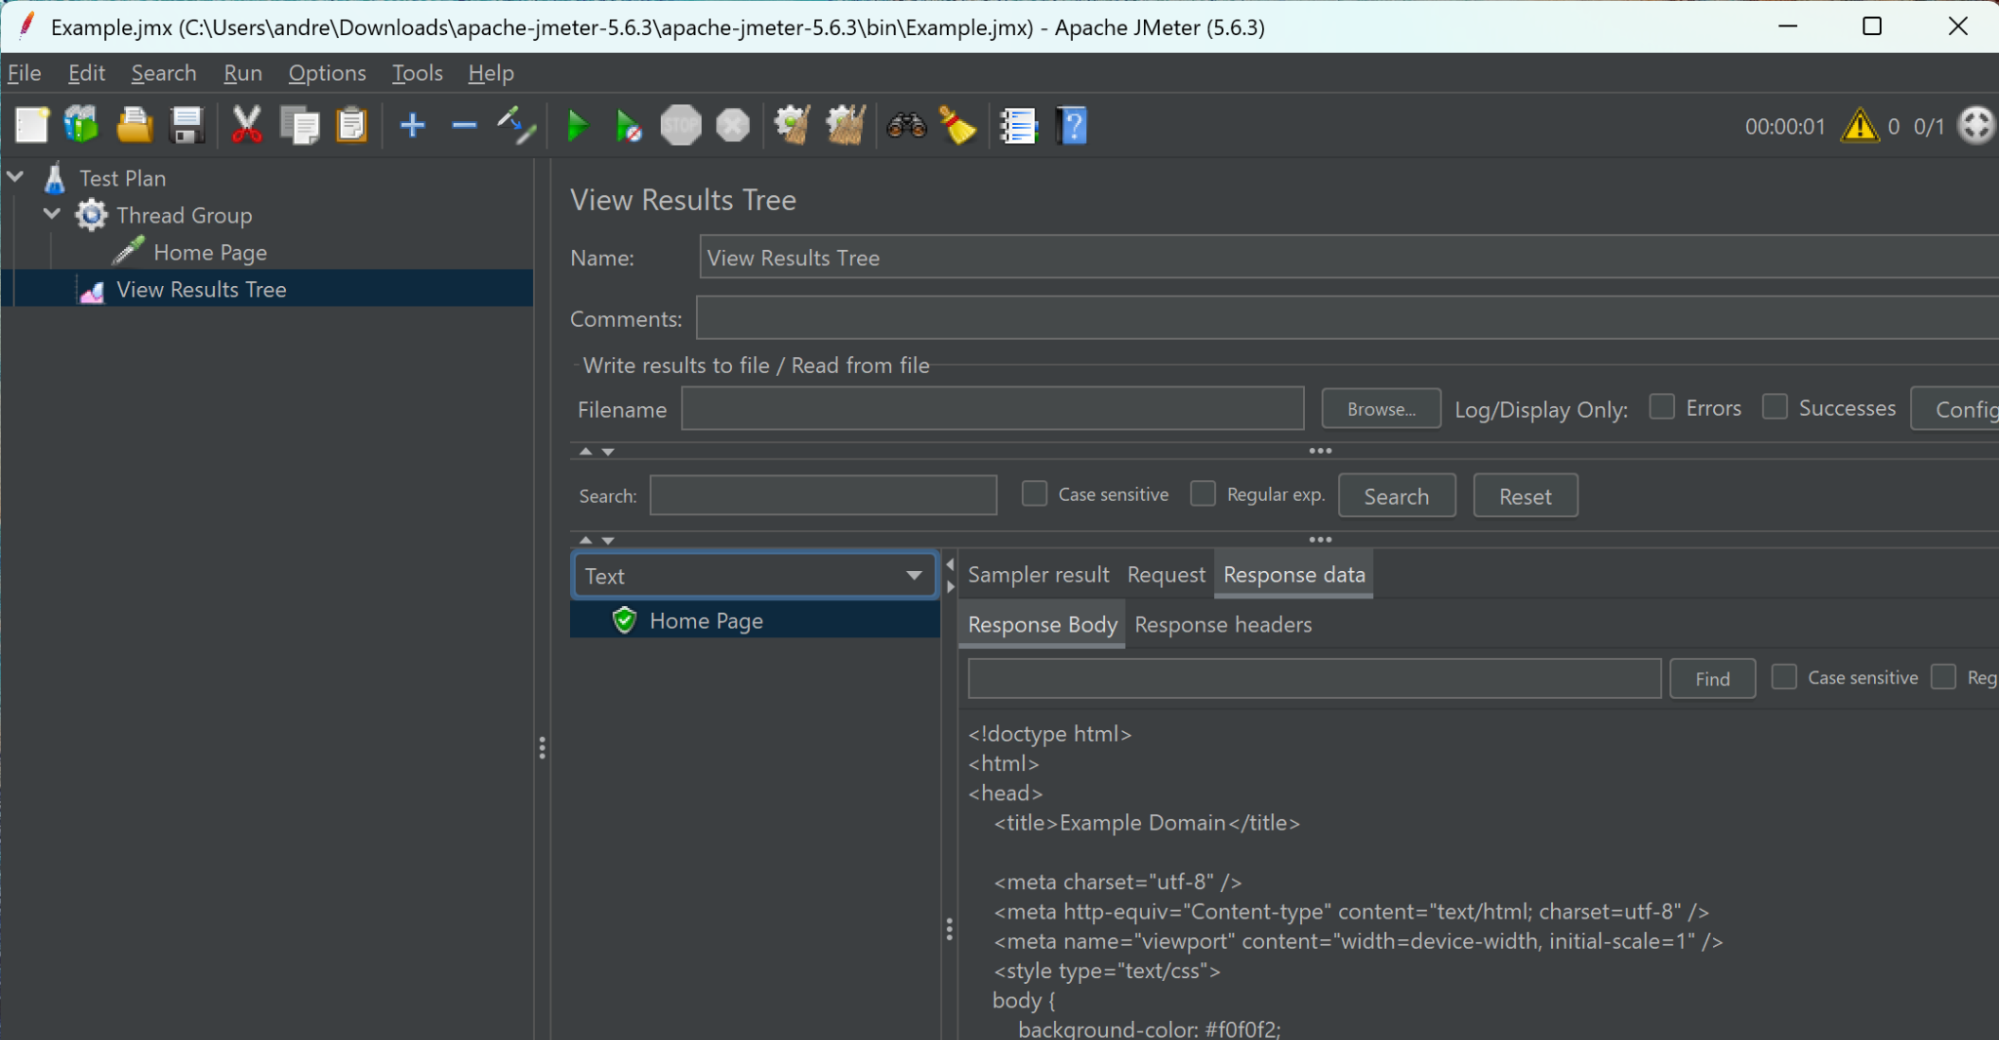
If you've got everything right, you'll notice something similar in the View Results to the graphic below.
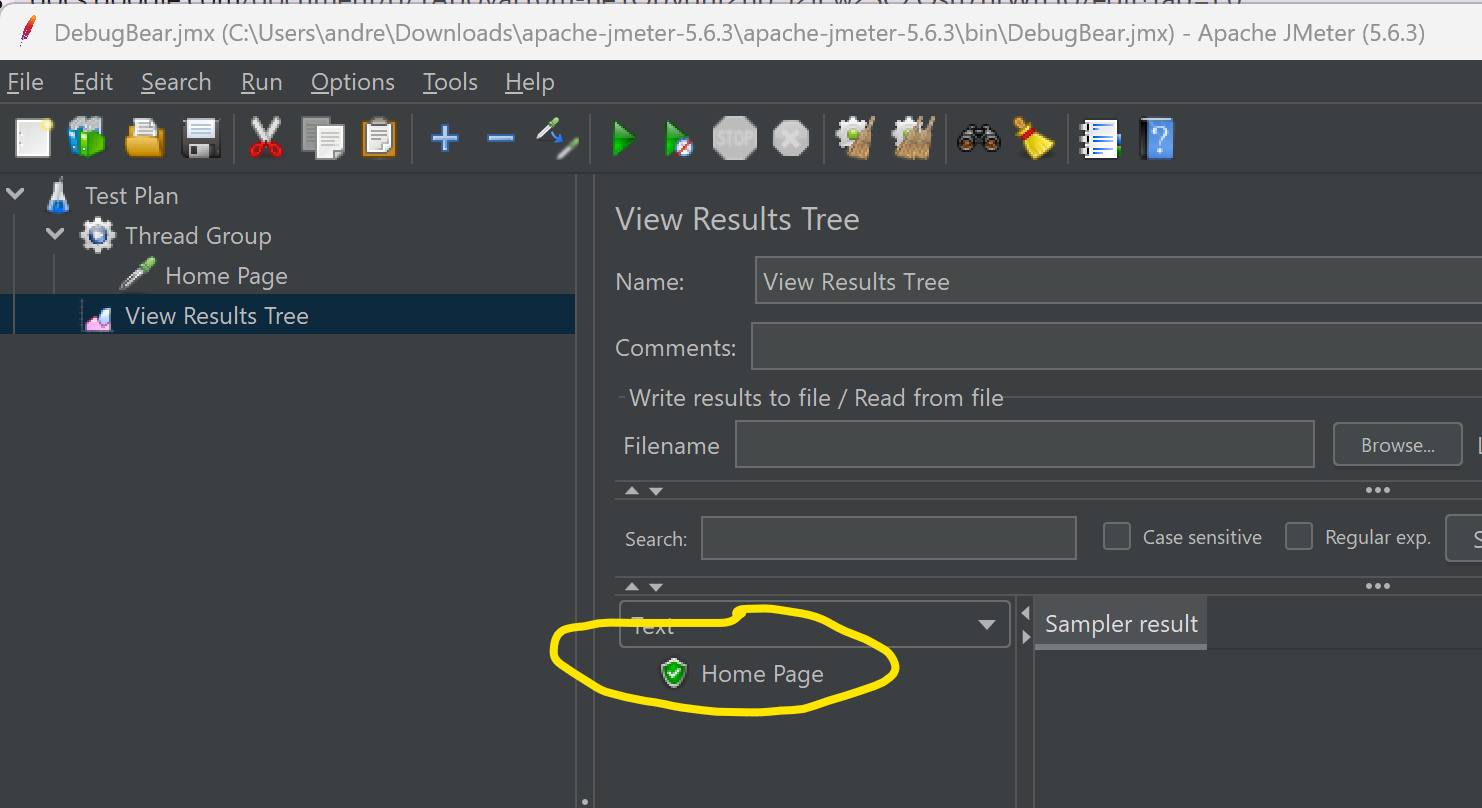
You should see the Home Page appear (see above)—as with lots of things, green is good! When green, that means JMeter got a response with a valid HTTP 200 status.
To get more information, click on the Home Page and the tabs on the right become populated. Here's a brief explanation of some of the tabs:
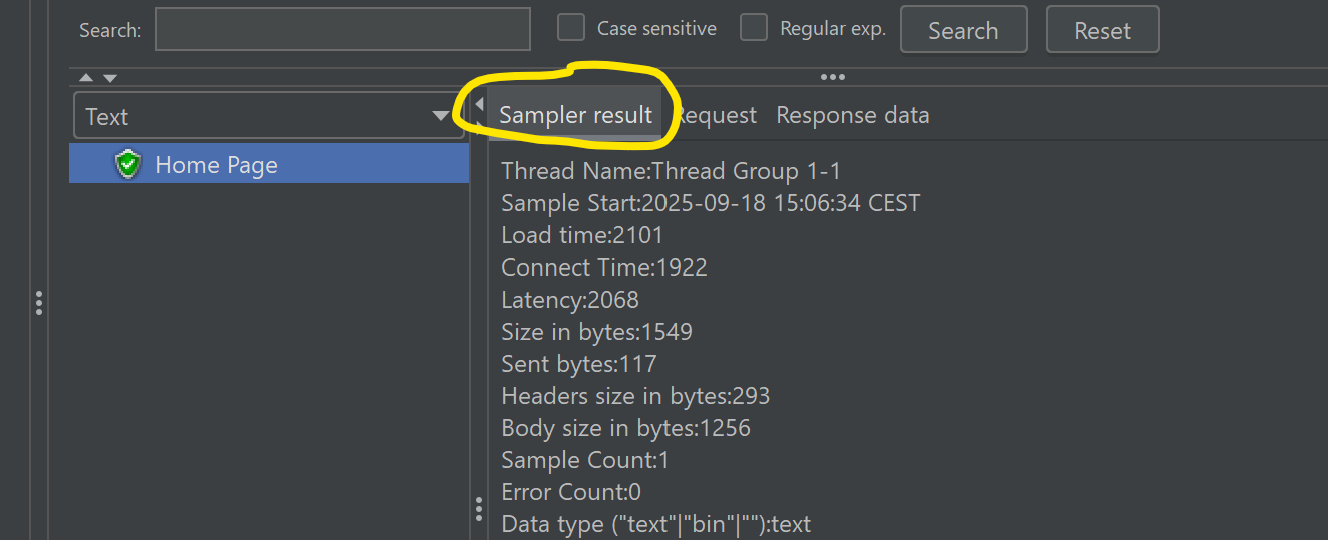
Sampler Result Tab
You should be able to understand most of the values in here, e.g., size. You'll see the LoadTime for the request. This is the time from when JMeter initiated the request until it finished receiving the complete response.
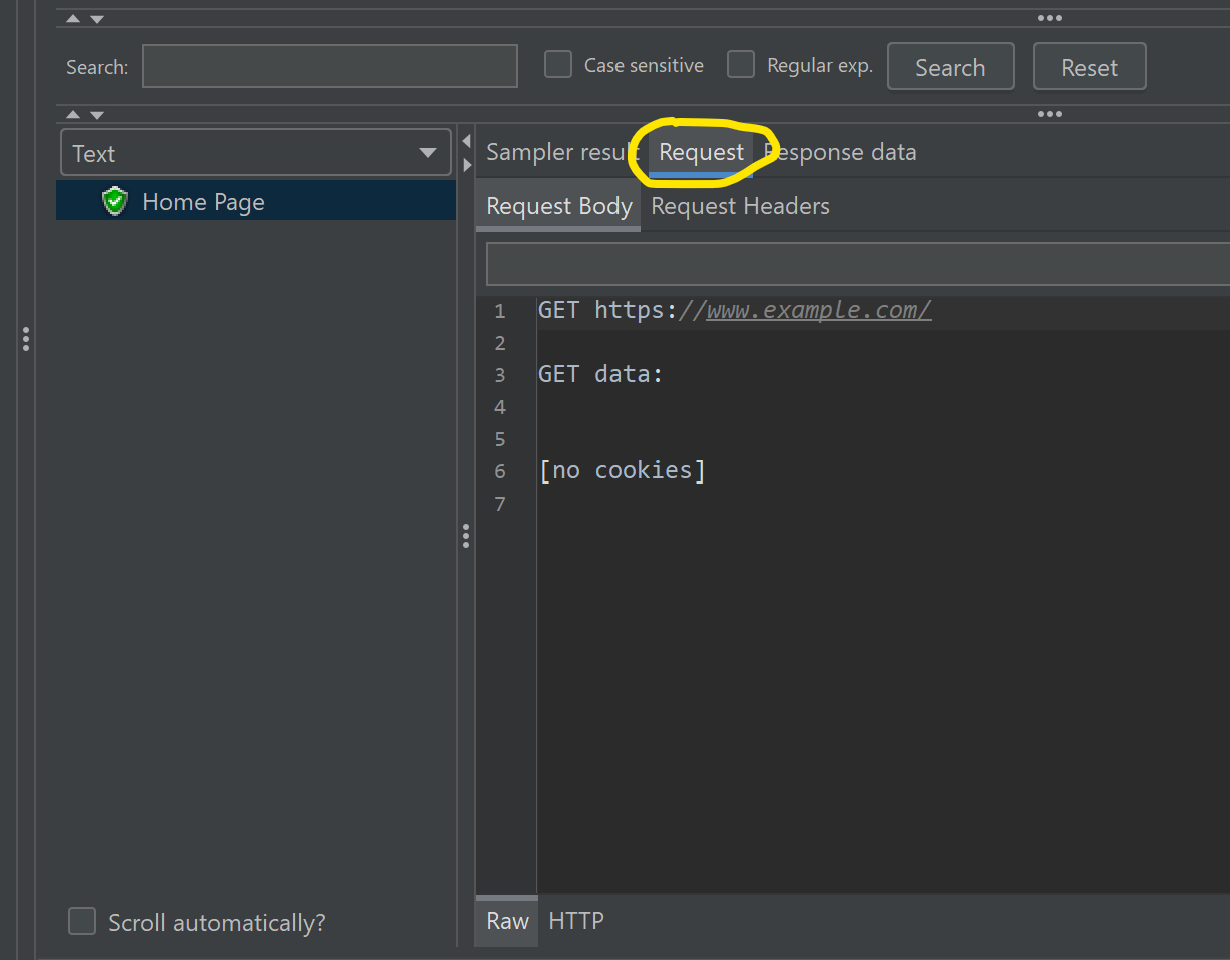
Request Tab
This gives the information about the request sent from JMeter. In this case, it looks pretty simple and aligns with what you put in the sampler. If it doesn't, that might be why you have a red response! To get more details, click on the bottom tab HTTP, and this provides some more data like the User Agent.
Response Body Tab
Now, getting to the best bit—at least for checking you have a working script—in the Response Body, you'll see the HTML code that was received from the website.
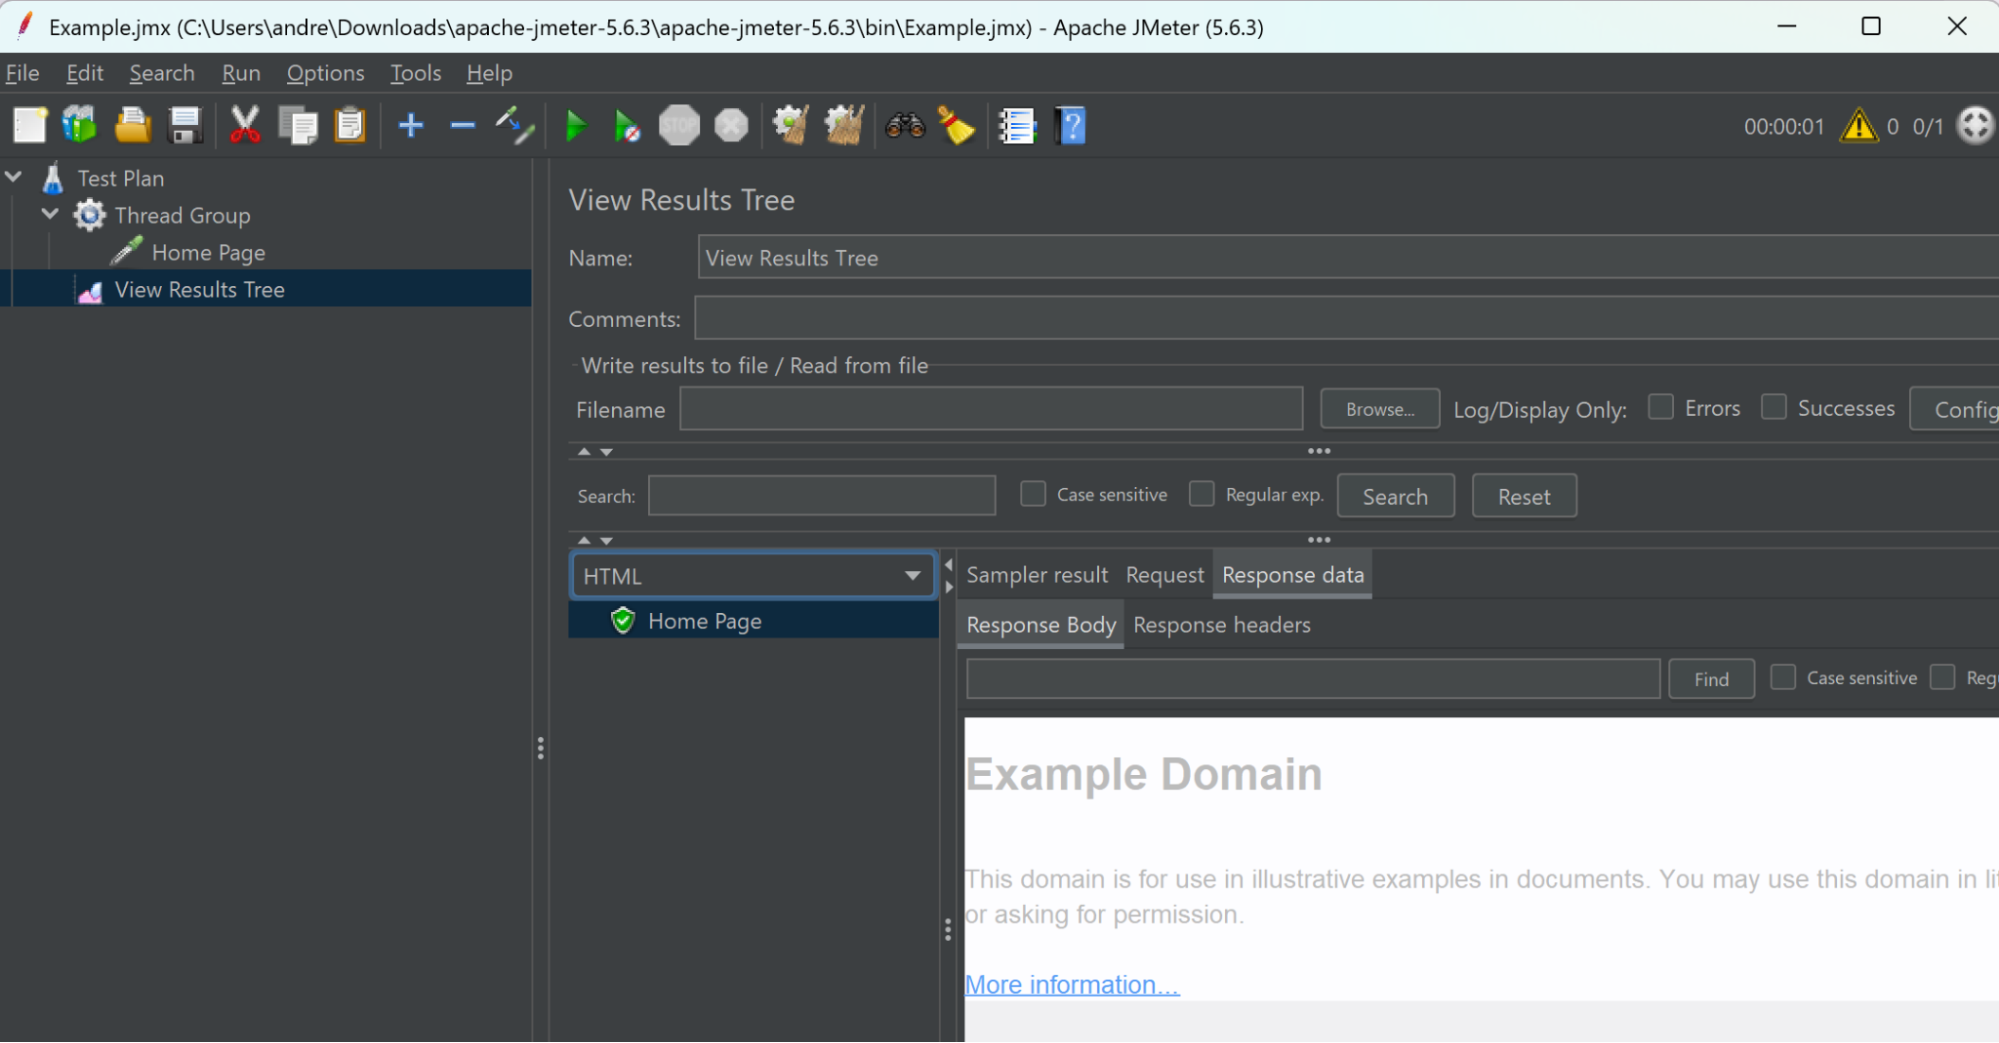
Now, if you wrote the code and it's instantly recognizable to you, that's great. However, I find it easier to view a sort of browser-based view. To do this, change the Text view to HTML by clicking the down arrow.
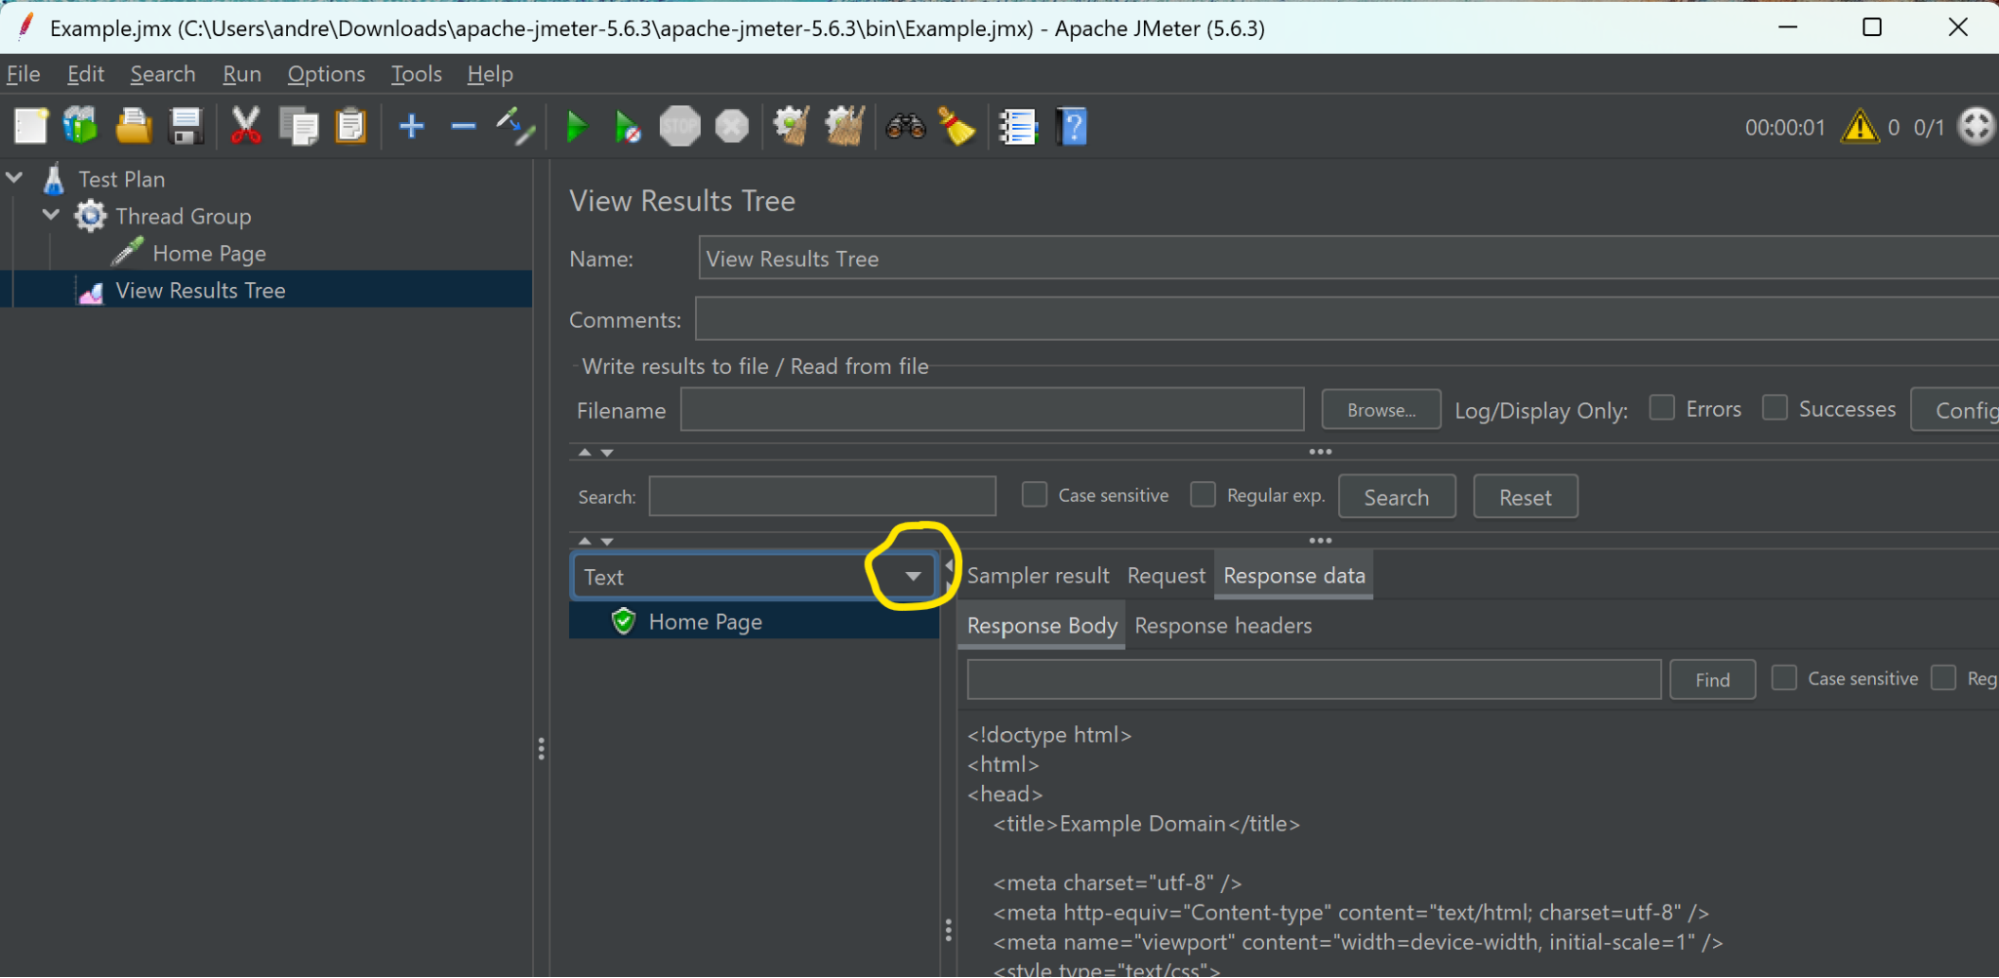
This then means JMeter attempts to render the page. Now JMeter is not a browser—it doesn't run JavaScript, and it hasn't downloaded any supporting content. So what you get is slightly clunky but hopefully meaningful. Also, it's a big red flag if the page looks like an error page!
Next, you could increase the loop count so that more iterations are completed in the test or increase the number of threads to increase the workload. But this section was more about the concepts, so let's look at more complex scripting.
Recording a Script
You may not always be able to create HTTP samplers by hand for your user journeys easily.
The easier way is for JMeter to record the HTTP actions as you execute the user journey in a browser. To do this, JMeter has to sit between your browser and the internet so that it can see the HTTP traffic.
This means you'll have to tell your browser that JMeter is sitting in the middle and can be trusted. Also, to help keep the recording clean, disabling some of the browser chatter helps. Details will follow after I explain what you want to record.
It's important to know what you want to record. It's a good idea to practice, as JMeter will record all your traffic, including mistakes. It saves editing the script if you can get a clean recording on the first take.
If you're performance testing as part of a formal test plan, then you've more than likely agreed on the steps in the user journey with the customer or business user.
For this example, we'll use a fake pet shop app (thank you, Octoperf, for hosting). In this example, we have four steps, which are:
- Go To Home Page
- Enter Store
- Browse Fish
- Choose A Fish
Here's the link for Step 01 so you can practice: https://petstore.octoperf.com/
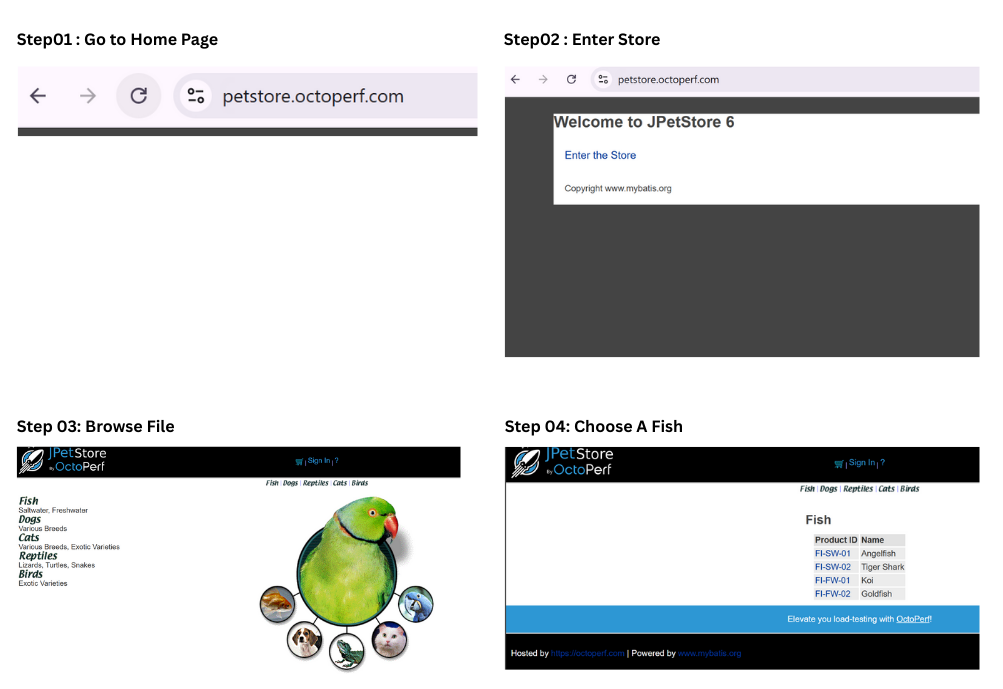
You'll notice that I've numbered each step. This isn't just my need for a love of order, but it also helps when you start looking at the results, as they match the flow through the script.
Configure JMeter for Recording
I'll show you how to record the script in JMeter Test Script Recorder. Be aware that there are also browser plug-ins from companies like Blazemeter that will record a browser script for you, or tools that convert a HAR file.
First, create a new test plan File → Templates, and select Recording with Think Time.
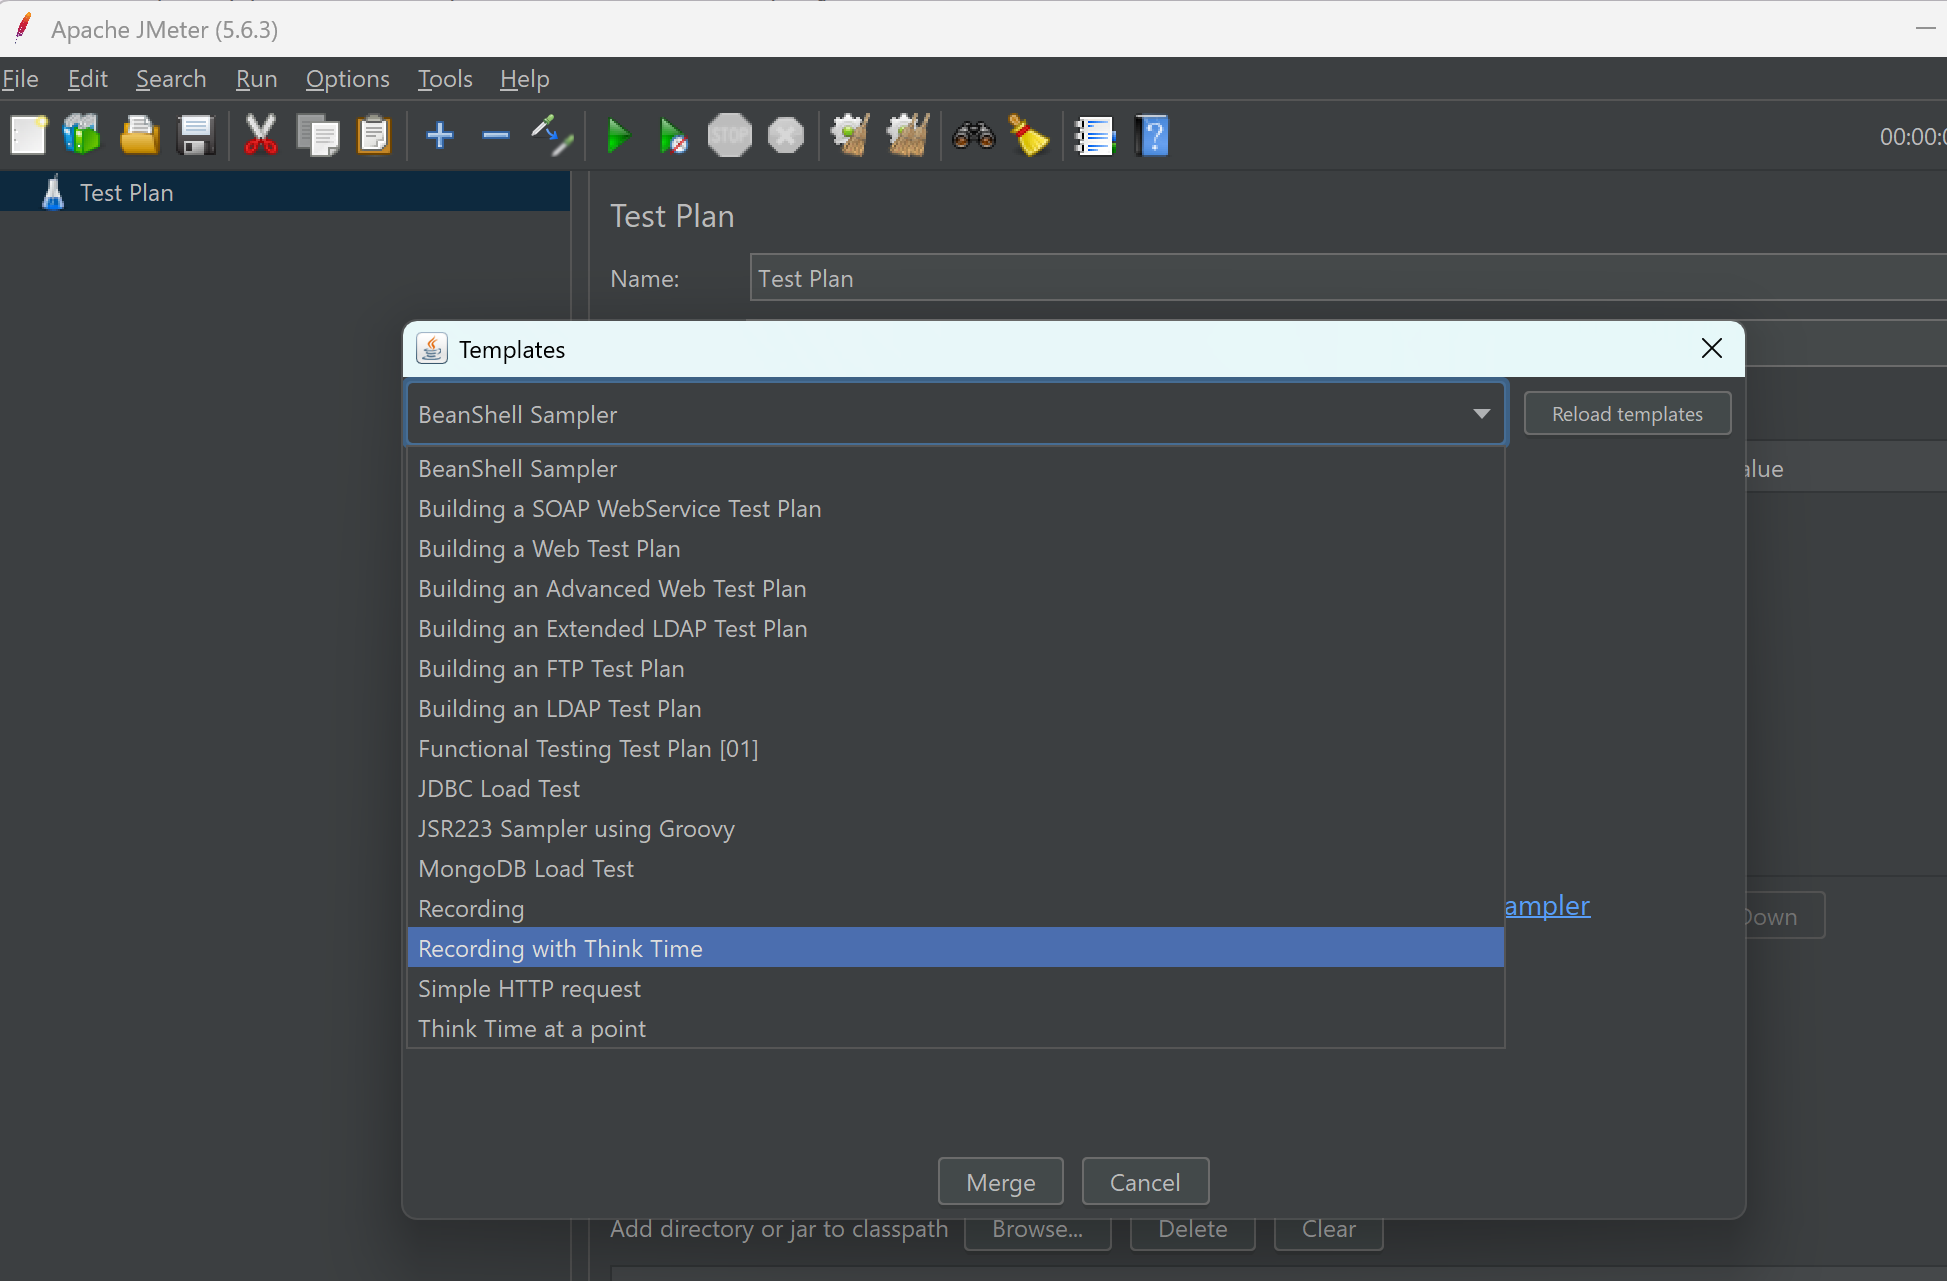
Click on "Create" to load the template.
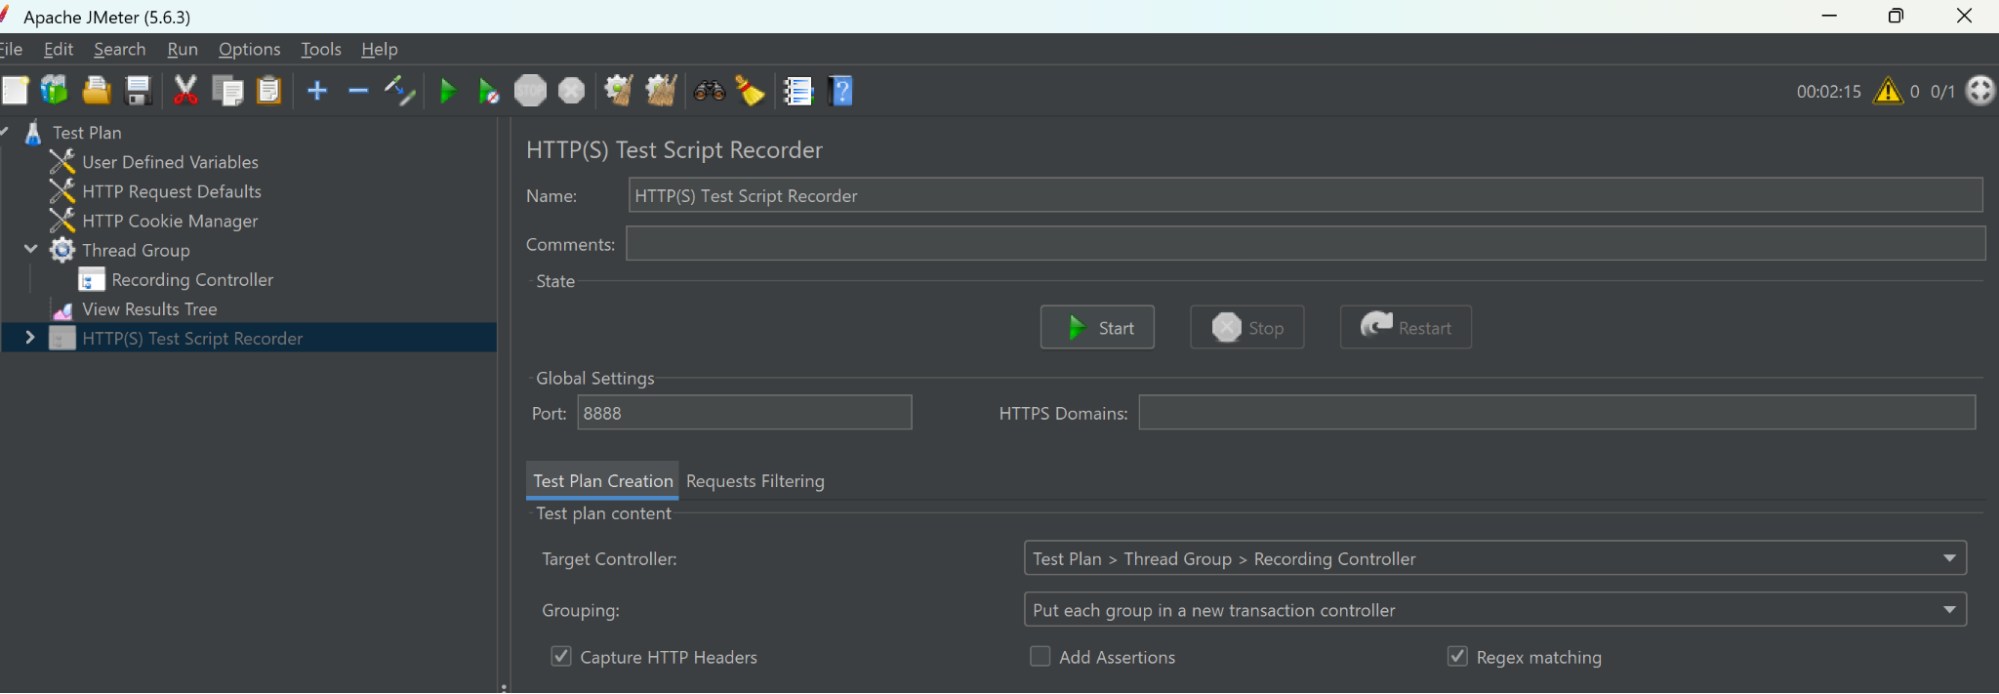
Once the template is loaded, you'll see a screen that resembles the one below.
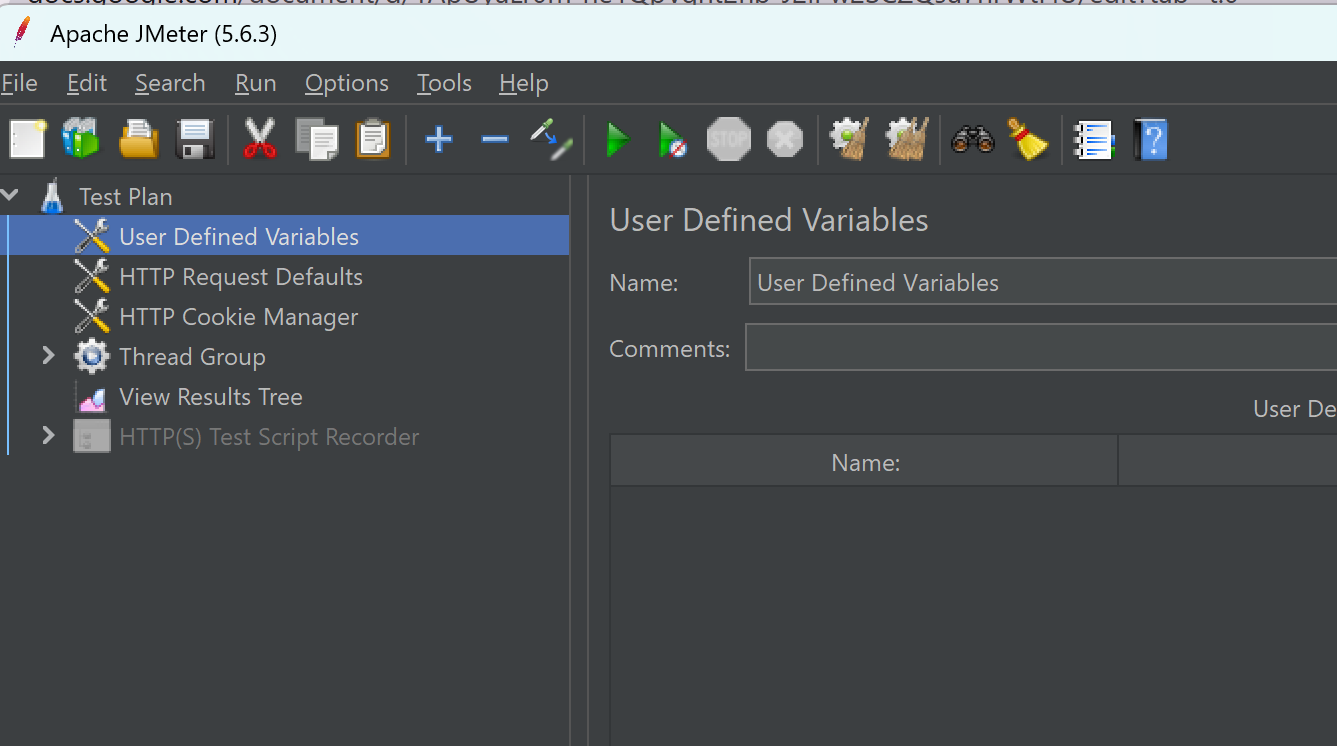
The advantage of the template is that it loads some good stuff that your script might need, like a Cookie Manager, and provides space for user variables, etc.
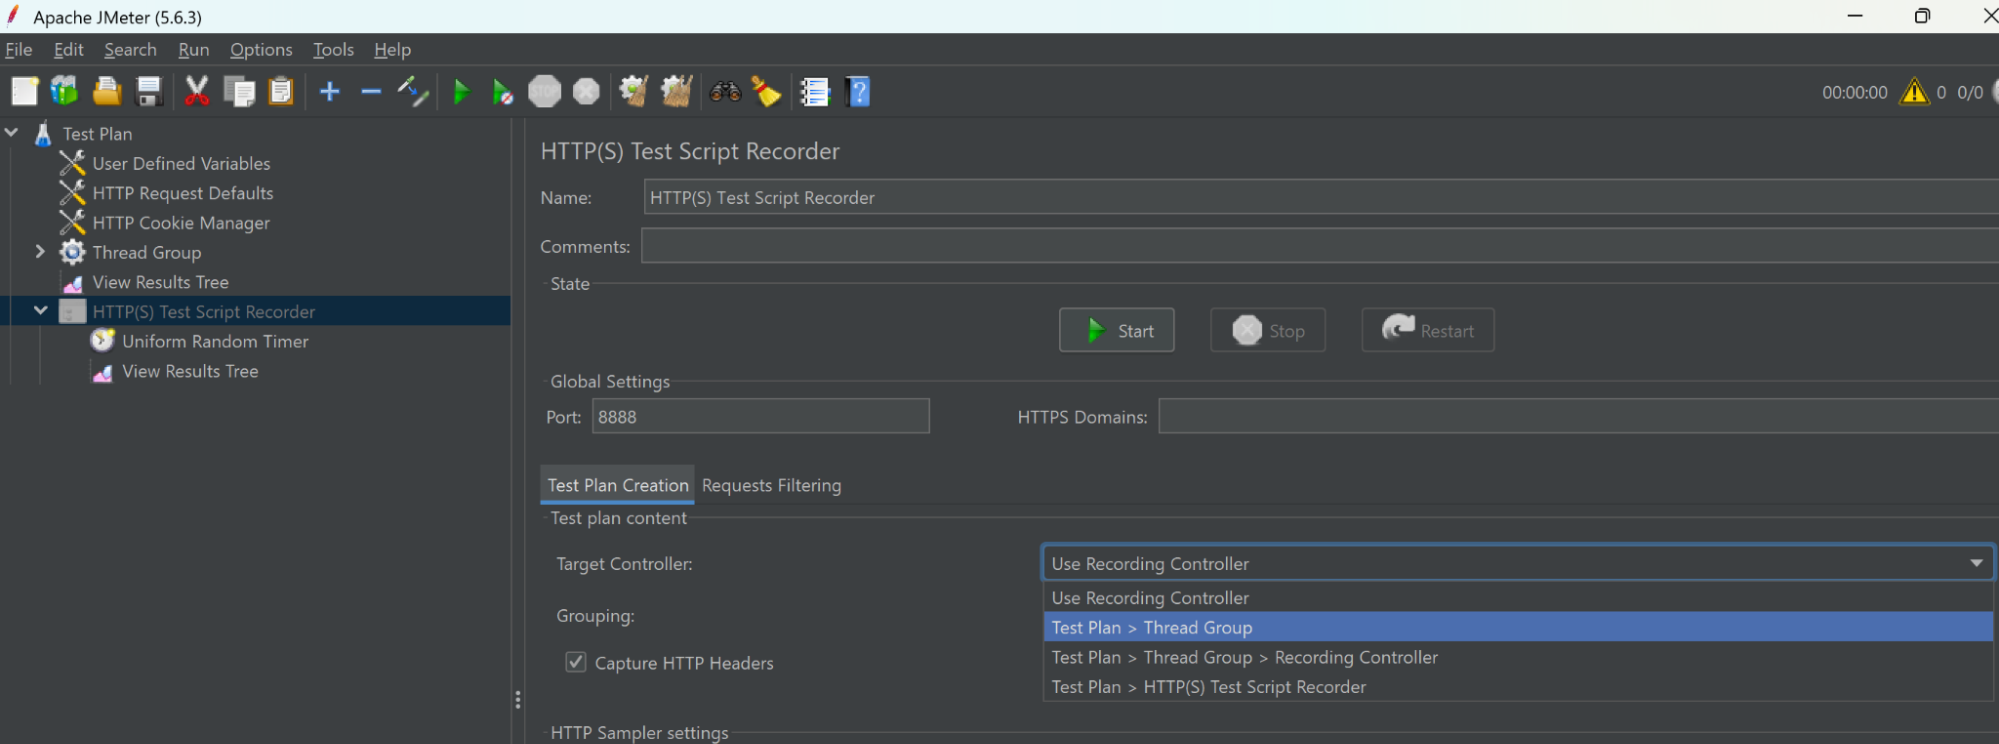
The HTTP(S) Test Script Recorder is greyed out, so first right-click on the HTTP(S) Test Script Recorder and select Enable. Next, you need to configure this, so click on it.
You need to tell JMeter where to place the recorded samplers, as this is a new script. Select Test Plan > Thread Group
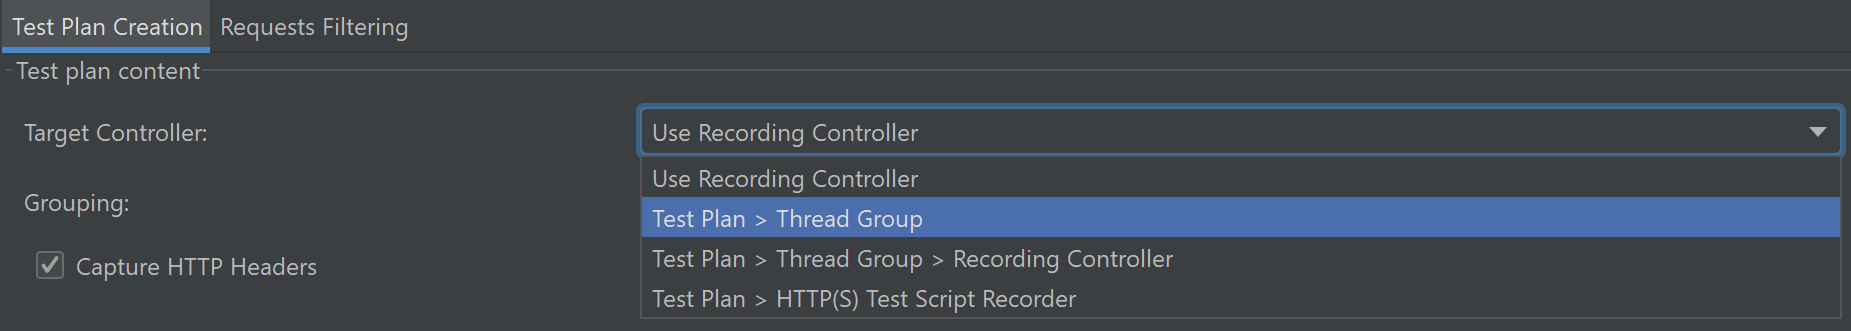
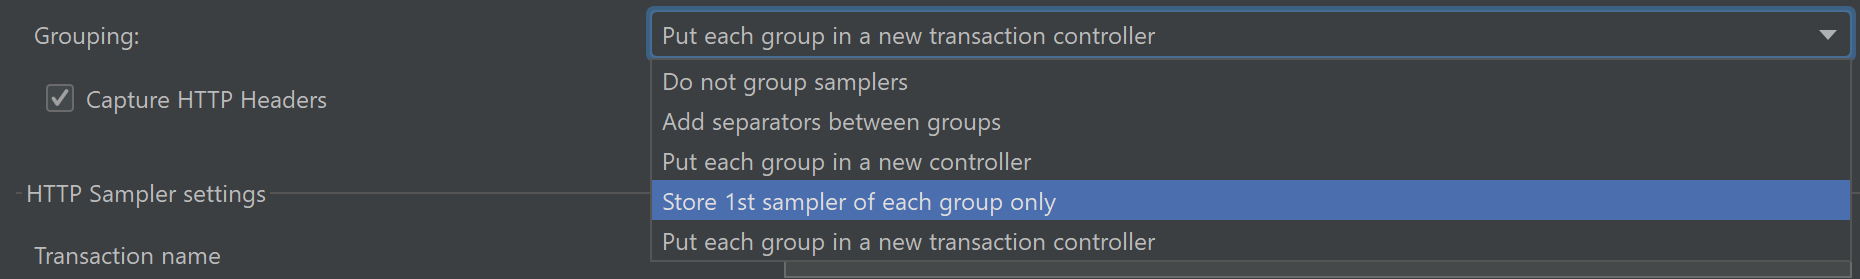
Next, select or check the grouping method for the transaction controller. Select 'Put each group in a new transaction controller.'
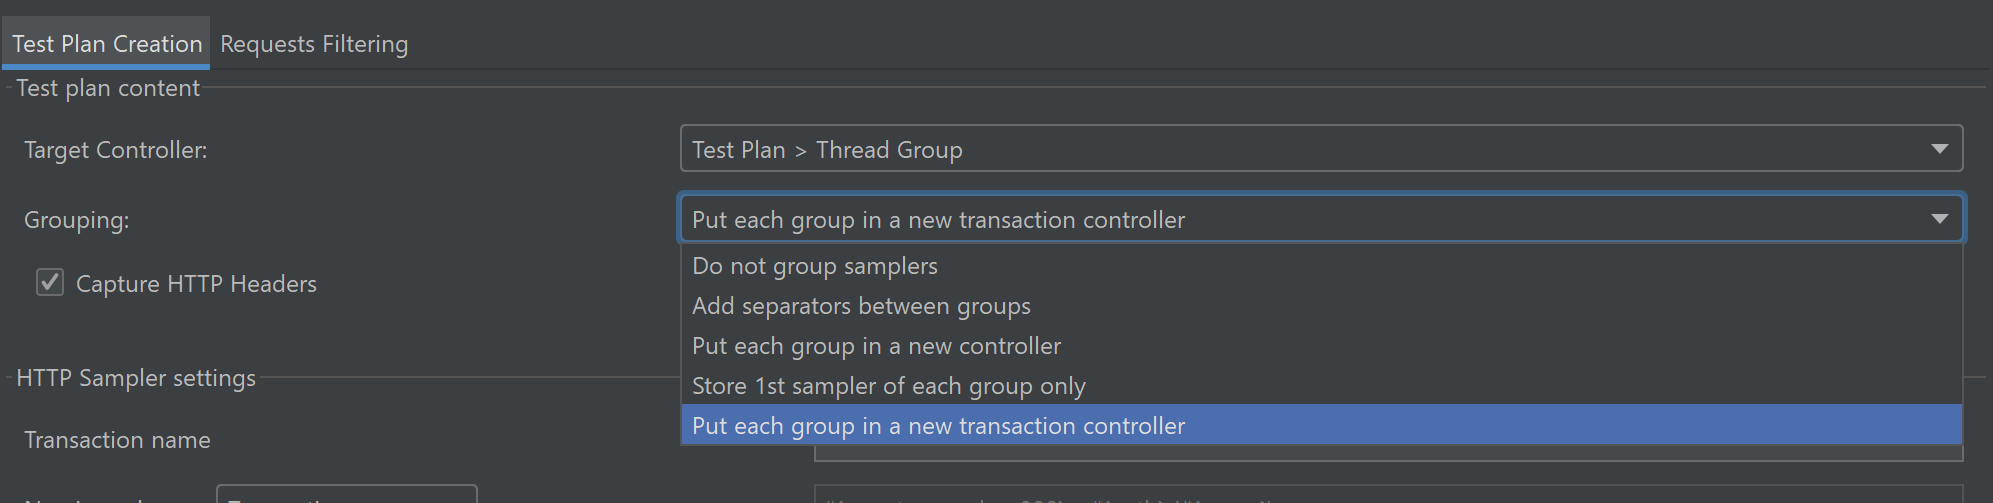
So, why did I tell you to "Put each group in a new transaction controller"? Because the action of clicking on a link might invoke several HTTP requests, and the combined time is the time delay the user will experience. If we put these into what JMeter calls transactions, then we capture these and can report response times at the transaction level—aka the user level.
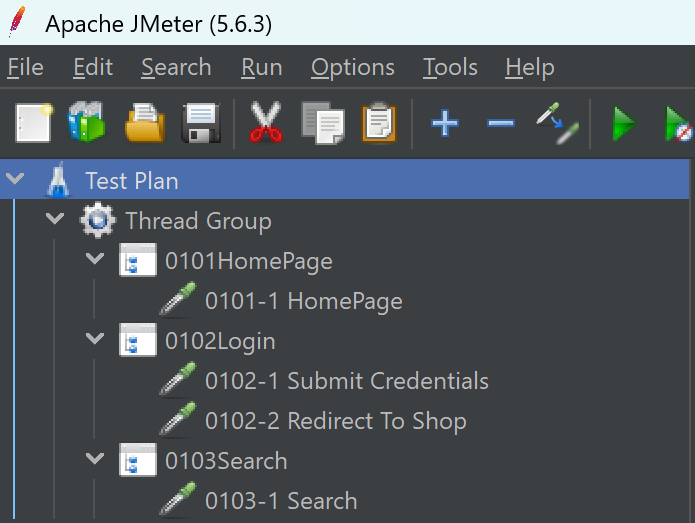
An example might be you're seeing something like this, where for login, it's two HTTP requests: the first to validate the user and the second to navigate to the authenticated page.
Finally, you need to check that the port is set to 8888. This is the port JMeter will listen for your HTTP traffic, and therefore you need to set your browser to use 8888 (more on that later).
In reality, it doesn't have to be port 8888—just an unused port number, but the same in JMeter and your browser!
Now you need to configure the browser and import the certificate. The easiest way to generate the certificate is just to click Start in the HTTP(S) Test Script Recorder. This will generate the certificate in the JMeter bin directory. You can click stop.
Browser Setup
Next, you need to set up a browser for the recording. To be honest, I'm a Chrome user, but I record with Firefox.
Why? I can keep Firefox just for script recording. JMeter will record all traffic from the browser, so I find it picks up background traffic from other websites I have open in Chrome. While Firefox is "clean" just for the recording. I'm providing the instructions for Firefox, but these can be applied, albeit with different button pushes for other browsers.
Route Traffic to JMeter
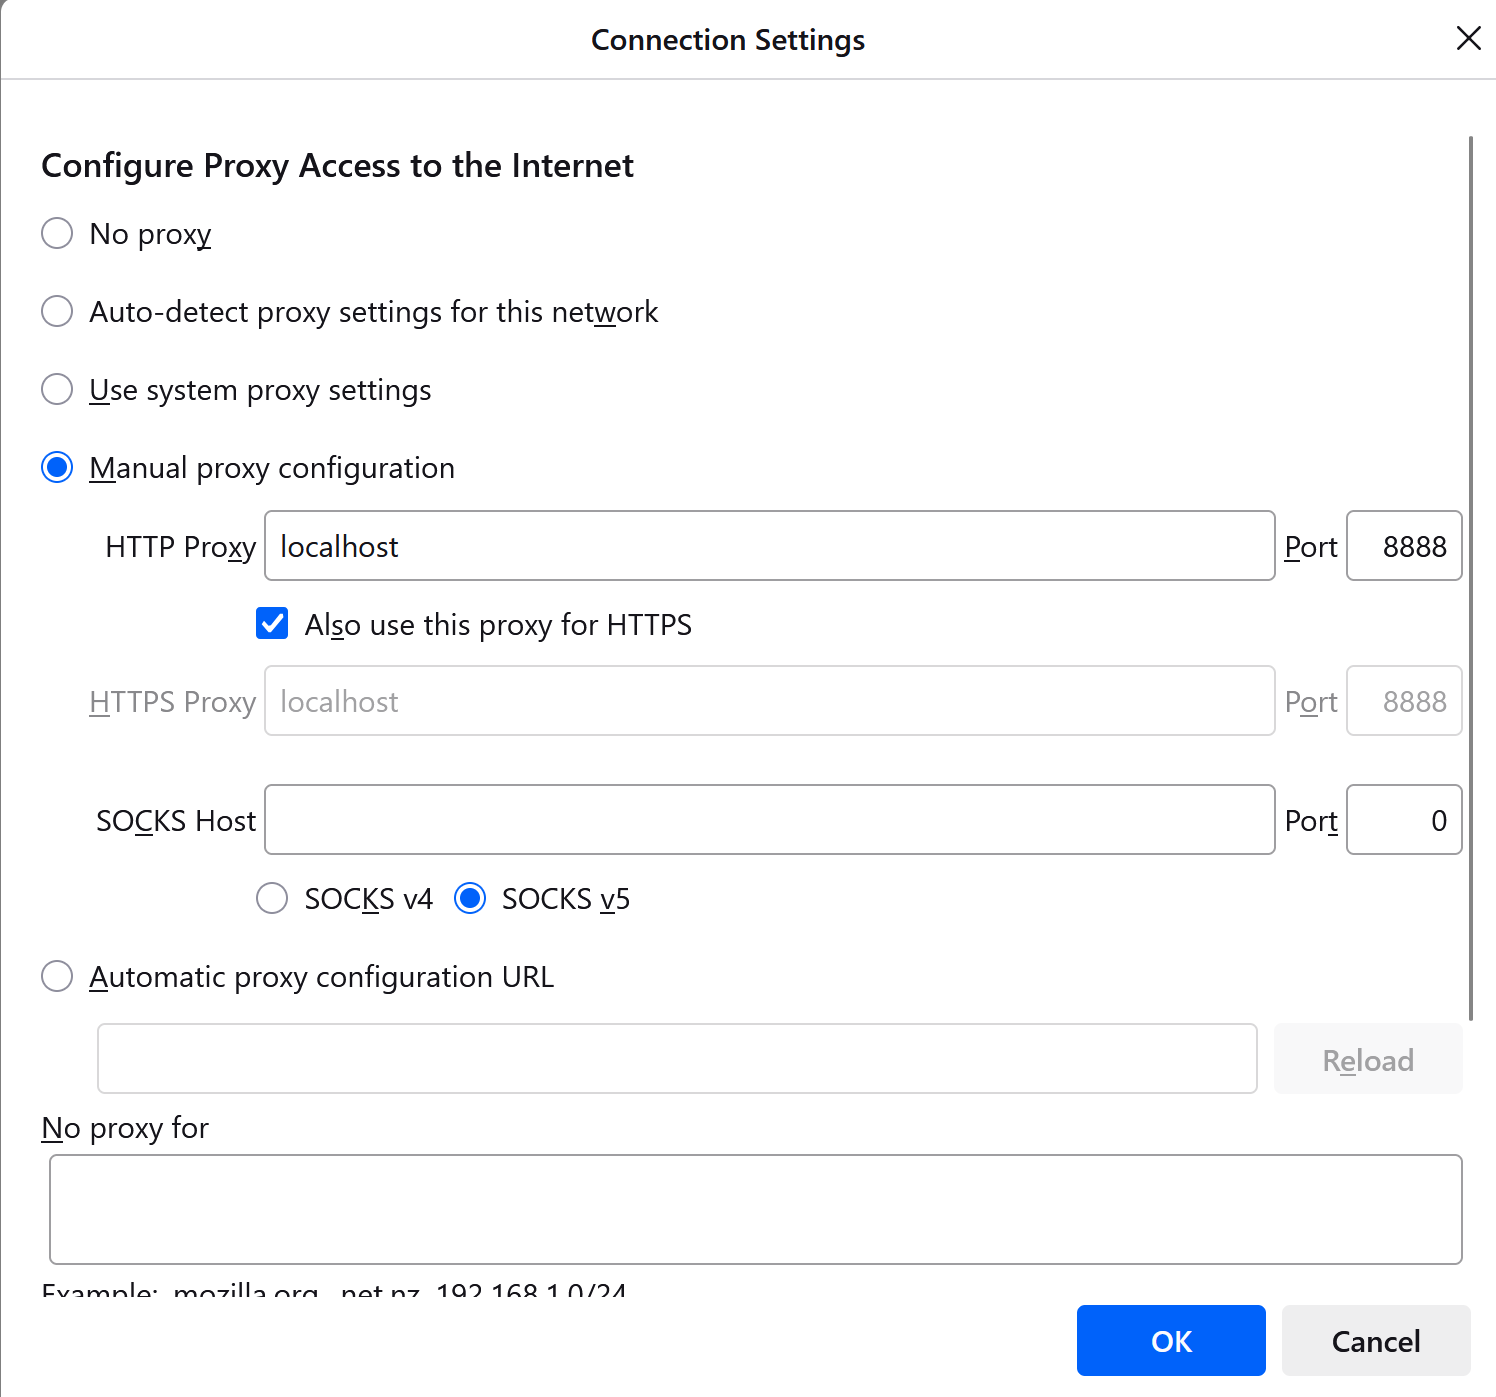
Next, set up Firefox to route traffic through JMeter. To do this, you adjust the proxy settings:
- Go to
Settings→General→Network Settings→ "Settings" button - Select "Manual proxy configuration"
- HTTP Proxy:
127.0.0.1Port:8888 - Check "Use this proxy server for all protocols"
After doing that, it should look like below:
Trust the Certificate
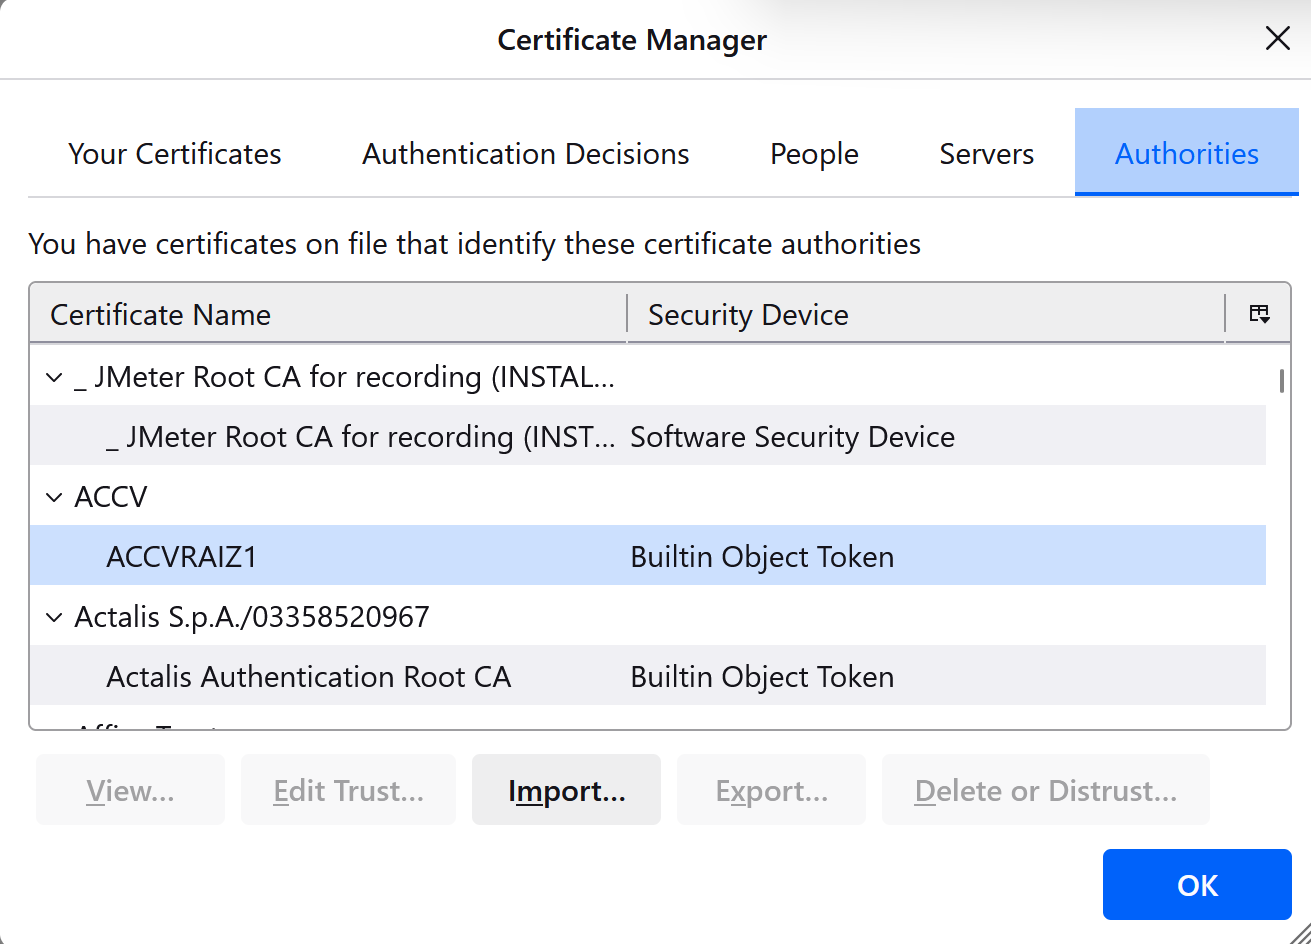
Next, follow these steps to import the certificate so that JMeter can decrypt any HTTPS traffic:
- Go to
Settings→Privacy & Security→Certificates→ "View Certificates" - Click "Authorities" tab → "Import"
- Select the
ApacheJMeterTemporaryRootCA.crtfile from JMeter'sbinfolder - Check "Trust this CA to identify websites"
After you install the certificate, it should look like this:
Reduce Background Noise
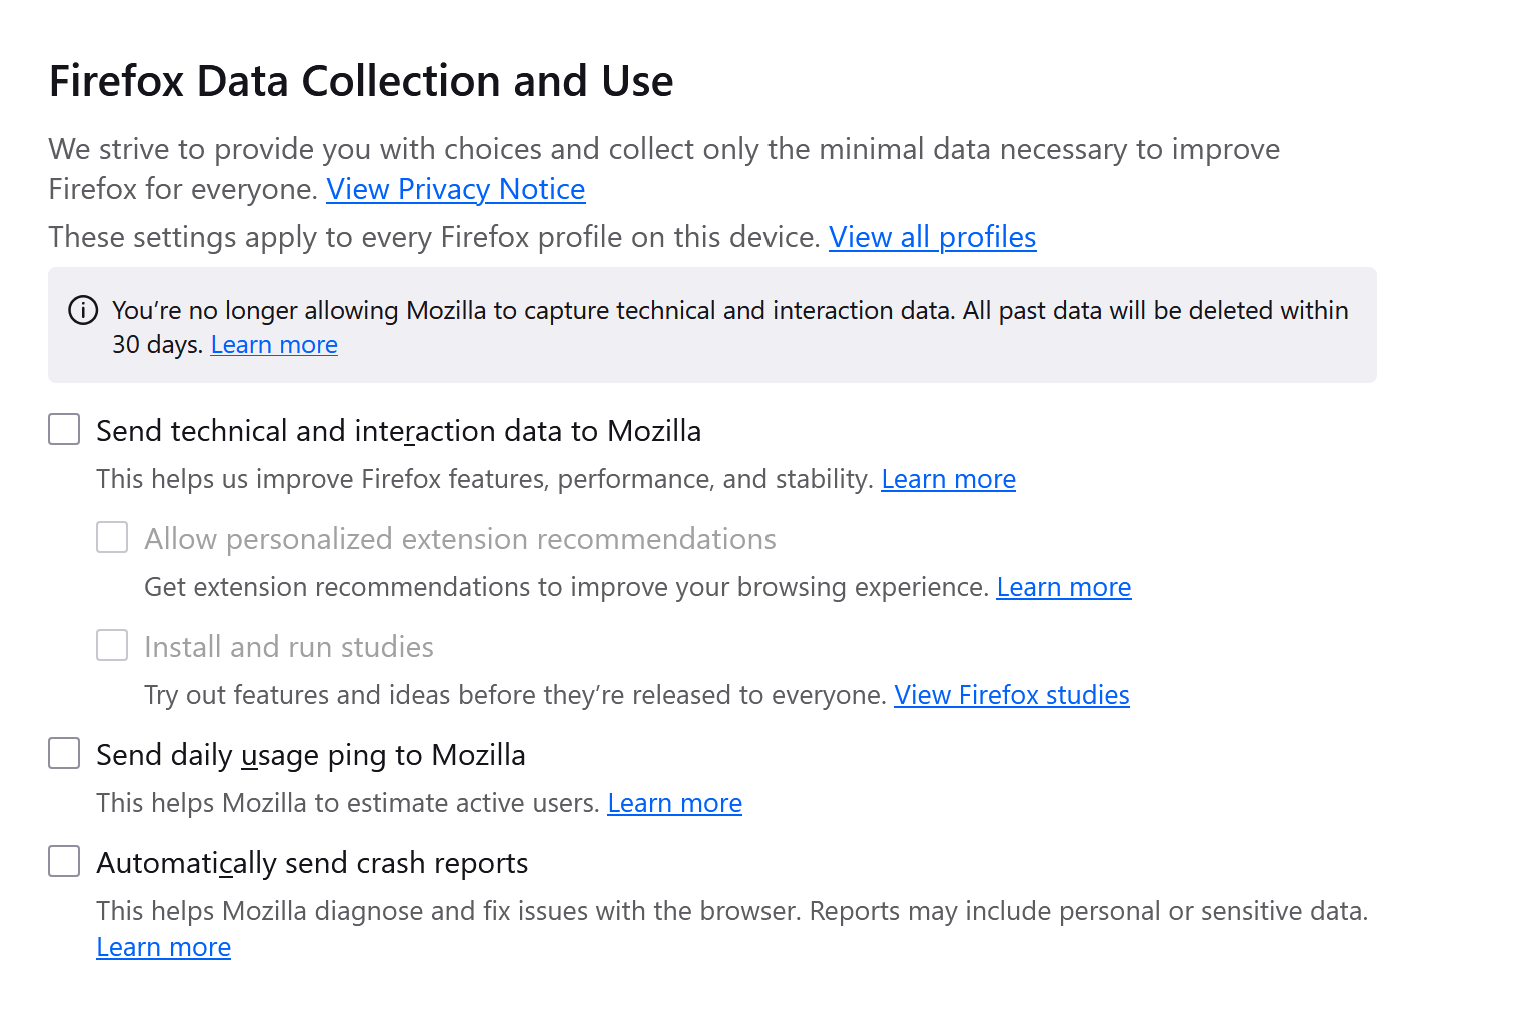
The next step is optional, but worth doing. It stops JMeter from recording the detritus that Firefox sends. This will make your script recording simpler as you won't have to go and delete unwanted HTTP samplers. As you become more proficient with JMeter, you'll learn to specify filters in the HTTP(S) Test Script Recorder.
Go to Settings → Privacy and security and scroll down to Firefox Data Collection and Use and untick any data collections active.
Start Recording
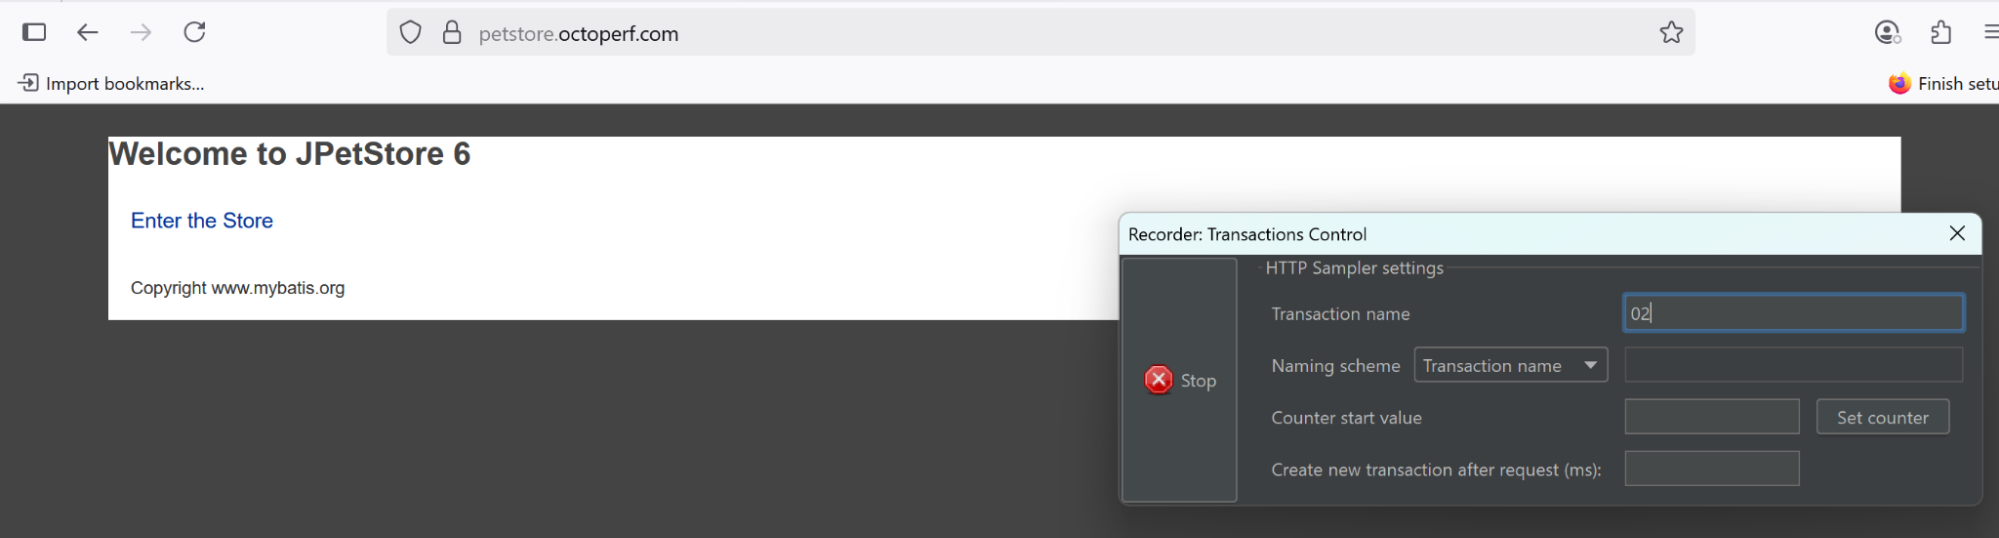
You're now ready to begin. Go back to the HTTP(S) Test Script Recorder and click start. The Record Transaction Control window will pop up into focus, so you're ready for the first transaction.
Enter 01 into the transaction name, then go to Firefox and enter https://petstore.octoperf.com/. The first page should appear, as below. You're now on step 02, so enter 02 in the transaction name and click Enter the Store.
Continue with the other steps in the user journey, entering the step number in the transaction name.
Once you've done step 04, click stop and look at JMeter. You should see something like this.
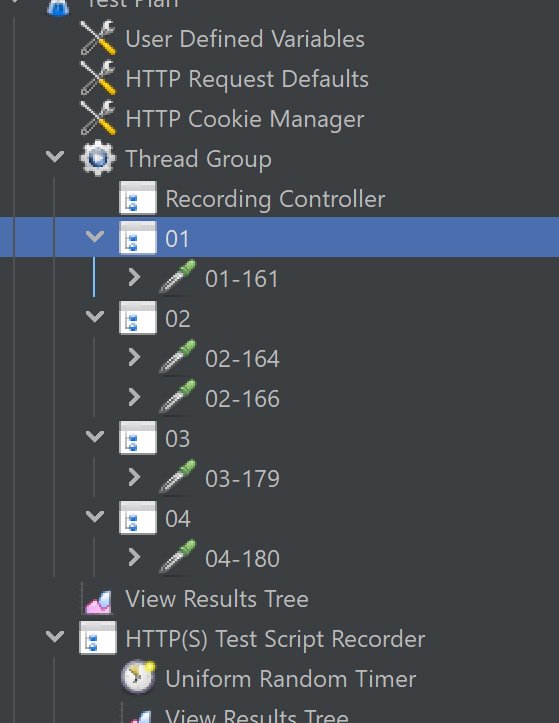
The numbers after the step number in the sampler (the -XXX) may change for each of the samplers, depending on how many tries it's taken you to get a clean recording. :-)
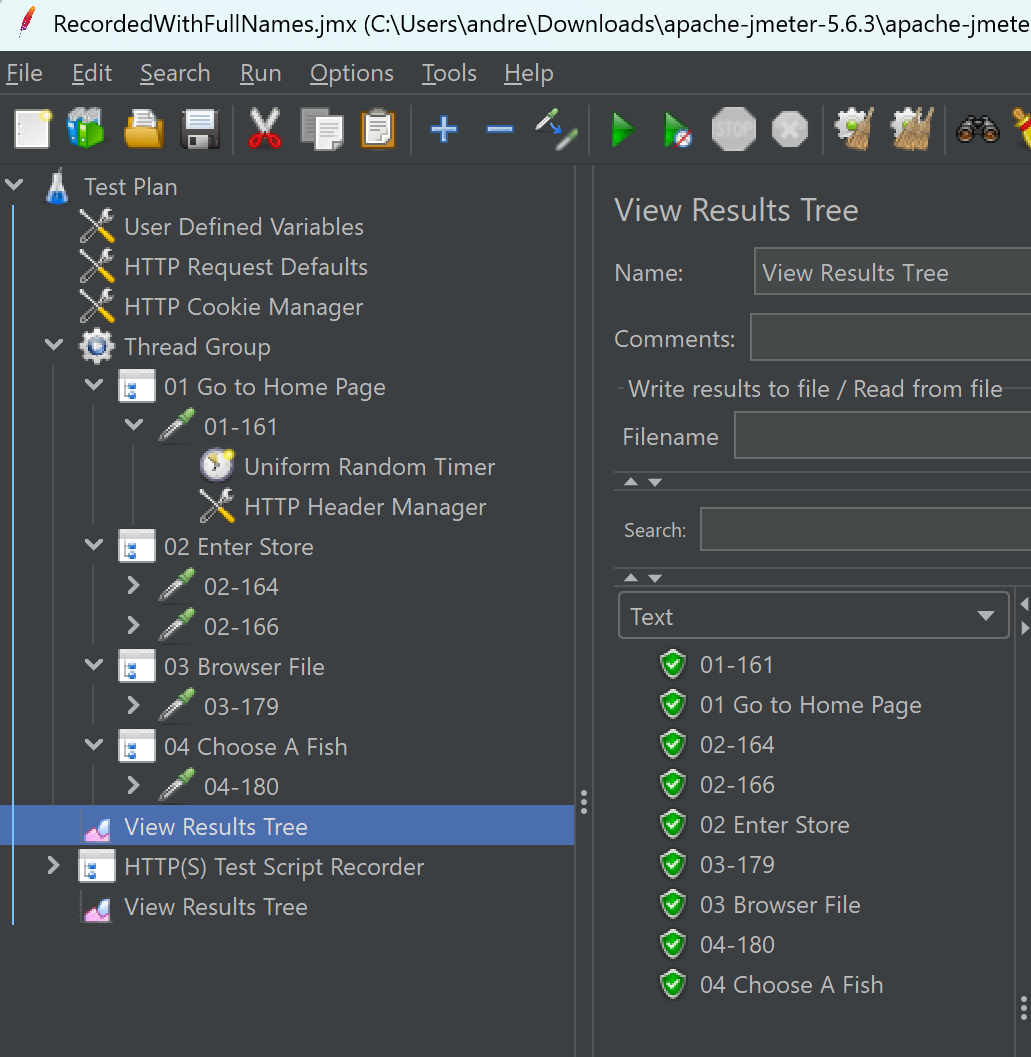
Now you can properly name your steps. Click on each transaction controller and update the transaction name to the full name, e.g., 01 becomes Go To Home Page.
Now save the script and press play (green play icon with the circle). Go to the View Results Tree and see if you've got lots of green! Remember, at the moment, a green shield means that the website has returned a valid 200 response. If you get red, it's most likely you haven't deleted a sampler that isn't part of the pet store app.
Now that you've finished recording, you can reset the browser proxy setting. Go back to your browser proxy settings and disable proxy, or set back to "No proxy" to restore normal browsing.
Tidying the Script
You have a working script, but you now need to do a few things to tidy it up.
Timers
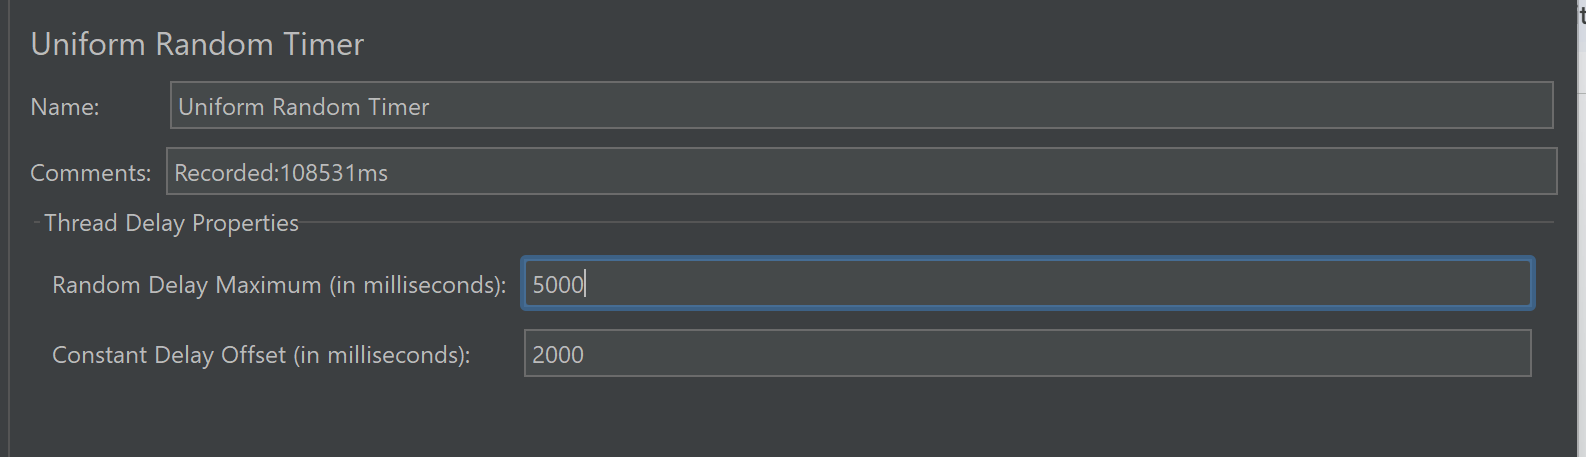
Look at the timer for each transaction and change this to what you think is representative for your users/test case.
By default, JMeter uses a Uniform Random Timer. Think of this as selecting a minimum and maximum think time, and JMeter will evenly pick a time between the minimum and the maximum each iteration.
The maximum delay will be the sum of both the values.
Response Assertions
I'll mention this briefly, but consider putting in a response assertion, which checks that the page returned is what you expect. I often use a text check to look for valid text. For example, after clicking on Enter Store I would expect the text "Fish" to be present.
Without doing this, JMeter is just checking the HTTP response code is 200 on a returned request. A lot of websites often return an error screen to the user, but as a valid HTTP 200 code, so it's always good to check.
Parameterization
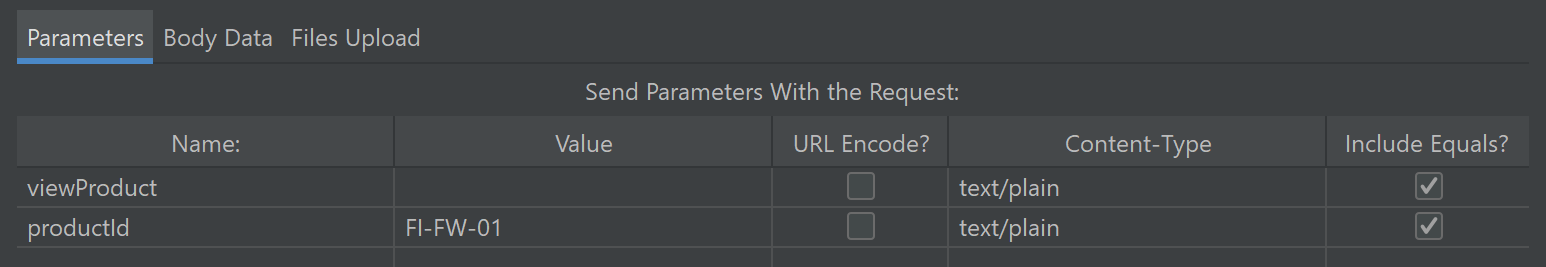
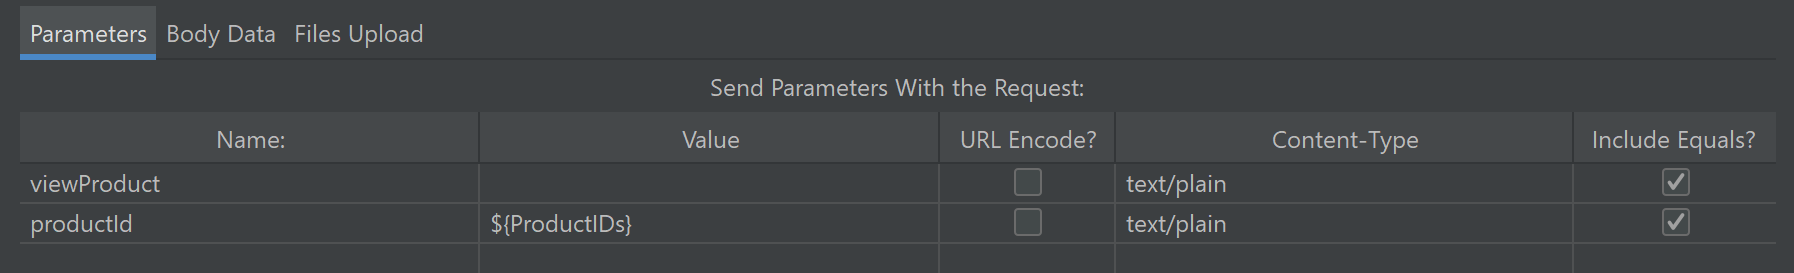
Next, we have to add a bit of randomness to the script. You don't want to test 100 users all looking at the same fish. In the HTTP Listener for step 04, we can see the fish chosen (Koi) is identified by the productId and this maps to the fish on the website (see below).
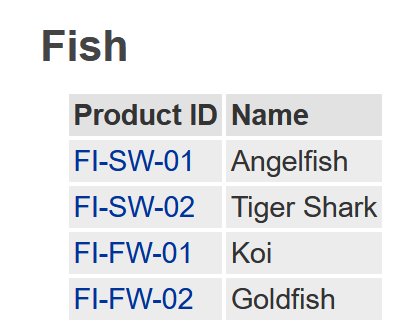
You'll want to pick a different fish, so create a CSV file with the Product IDs and save the file ProductId.csv. Below are the values to put into the file:
- FI-SW-01
- FI-SW-02
- FI-FW-01
- FI-FW-02
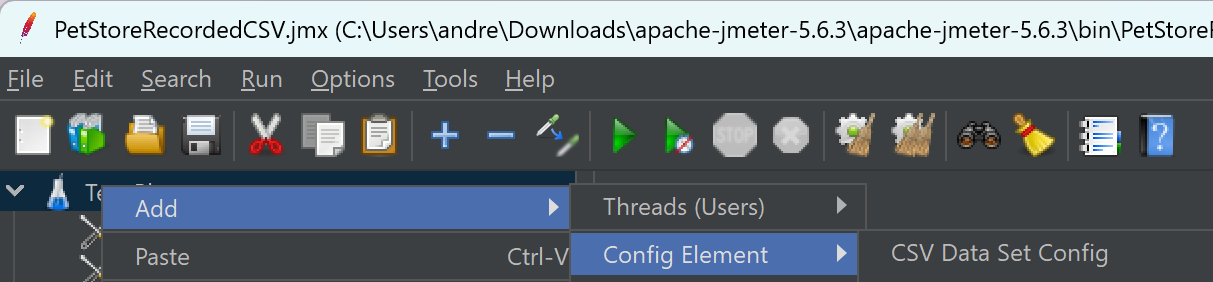
Next, you need to use these, so you must add the CSV Data Set Config element. To add this, right-click on the Test Plan and select Add → Config Element → CSV Data Set Config.
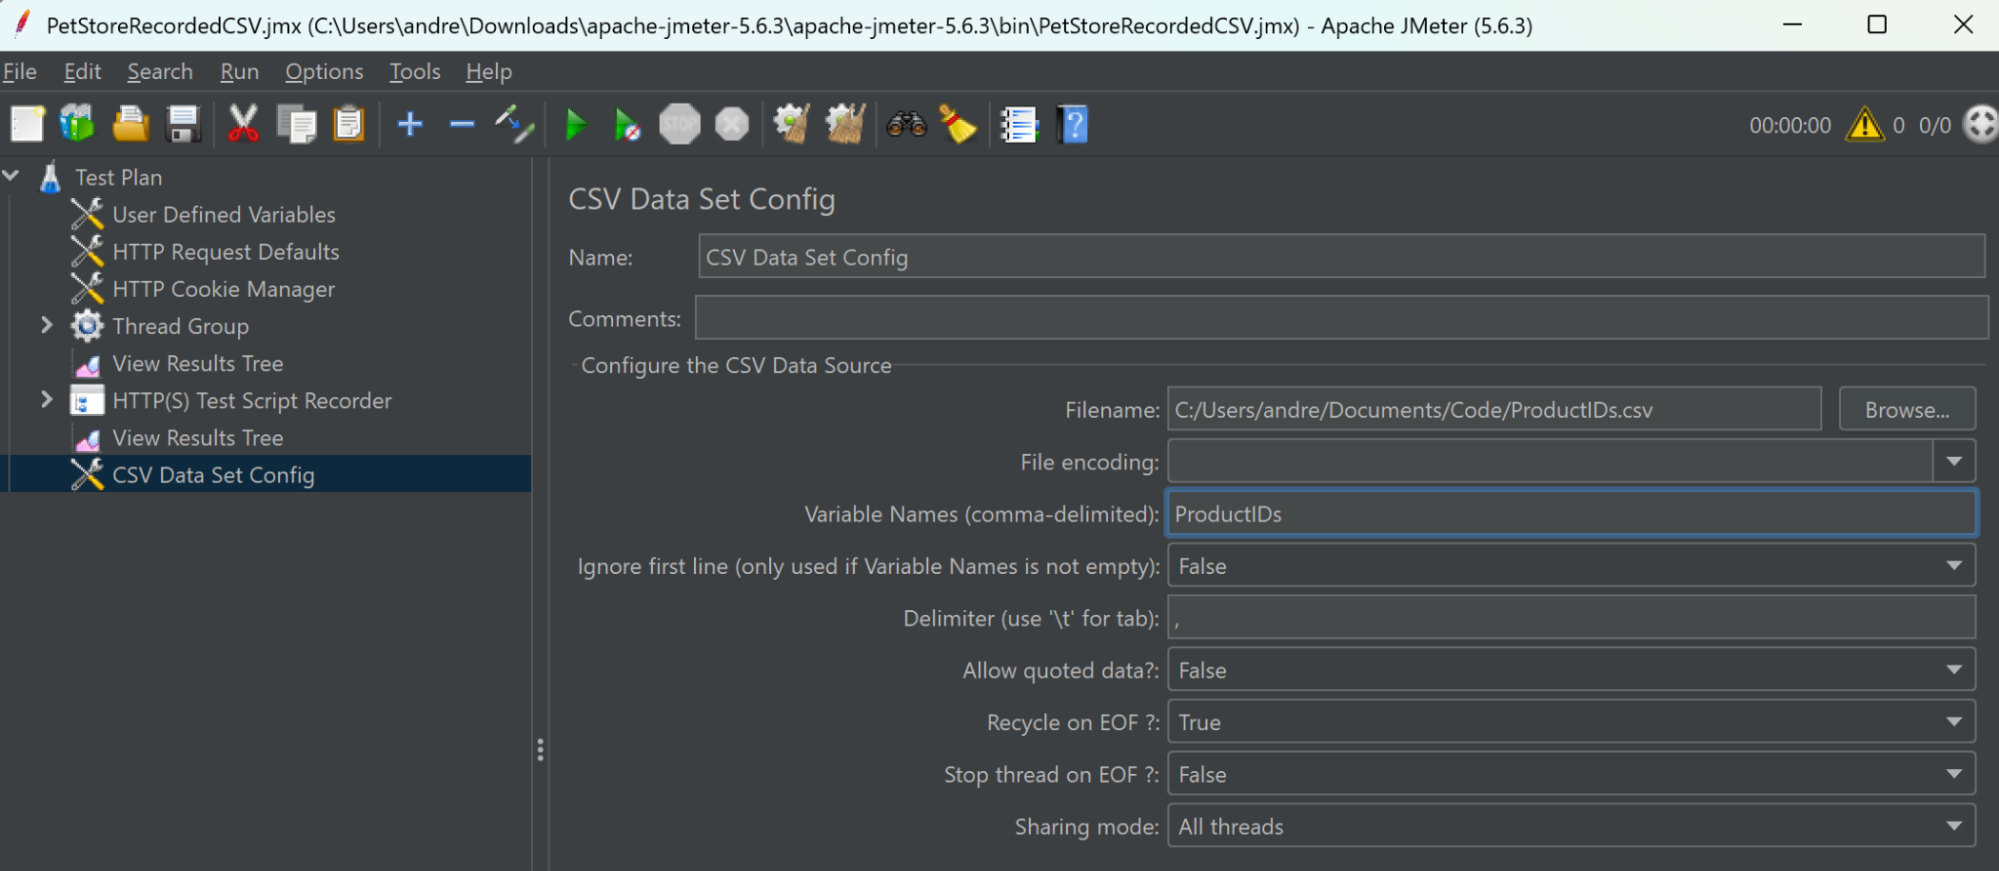
Go to the CSV Data Set Config, and all you need to do for this test is click on the Browse button by Filename and select the ProductId.csv file you just created and tell JMeter what variable name to assign the product IDs. In this case, in the Variable Names field, add the name ProductIDs.
Now, each iteration of your script will pick the next value from the CSV file and start at the top again when all values have been used. Each value gets added to the ProductIDs variable, and so you need to replace the hardcoded product ID in the sampler with the variable. Go to your 04 Choose A Fish sampler and replace FI-FW-01 with ${ProductIDs}. The ${} syntax tells JMeter you're using a variable!
Run your script again and check you're still getting valid responses in the View Results Tree.
Running a Load Test
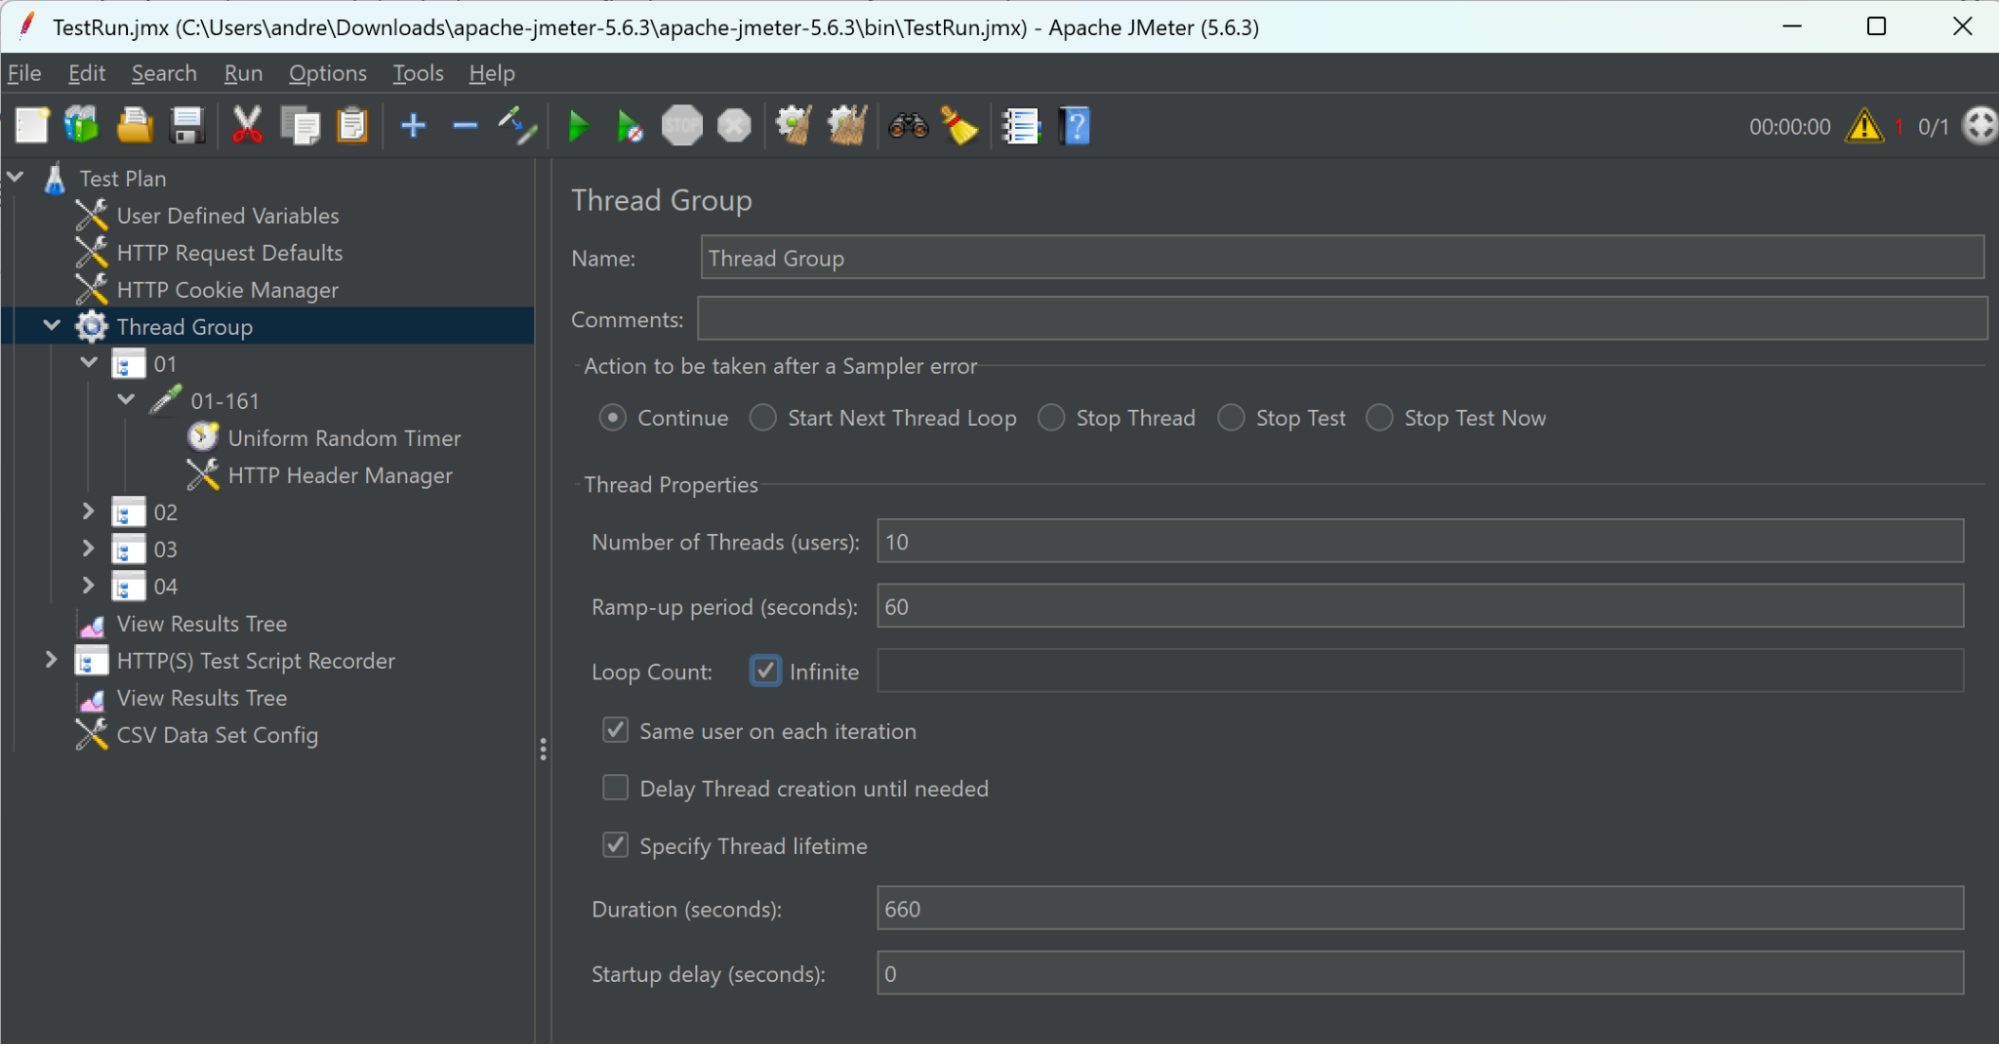
You should now have a working script, so it's time to run a load test. The aim of the load test is generally to identify what backend response times are like at a particular load. For the current script, you do this by setting the number of threads in the Thread Group—the more threads, the more load you'll generate.
In this case, this is a small test, so let's go with 10 threads. You also need to specify the duration of the test. In this case, I want a short 10-minute test (600 seconds).
Now I don't want to start all my threads at the same time in this test—I want a ramp-up period of 1 minute (60 seconds). That means setting the ramp-up period in seconds to 60.
Next, I have to click Specify Thread lifetime and set underneath that Duration (seconds) to 660 seconds. That's 60 seconds for the warm-up and 600 seconds of full execution. Finally, for Loop Count click Infinite and save your test plan.
Remember to now save your script.
Run from the Command Line
You probably noticed the "Don't use GUI mode for load testing! Only for test creation and test debugging." message when you started JMeter. This is because it's inefficient, and if you overload the box running your test you get invalid results. For a small test, you can run from a single box using the command line.
Personally, I like to get the raw results into a CSV file so I can import them to Excel to analyze.
To do this, the command line will be:
jmeter -n -t TestRun.jmx -l results01.csv -e -o dashboard
-n- Run JMeter in non-GUI mode (command line only)-t TestRun.jmx- Specifies the test plan file to execute-l results01.csv- Specifies the output file for test results-e- Generate HTML dashboard report after test completion-o dashboard- Specify output folder for the HTML dashboard (folder must be empty or non-existent)
Make sure you're running this command from the directory where you saved your test plan, or provide the full path to the file.
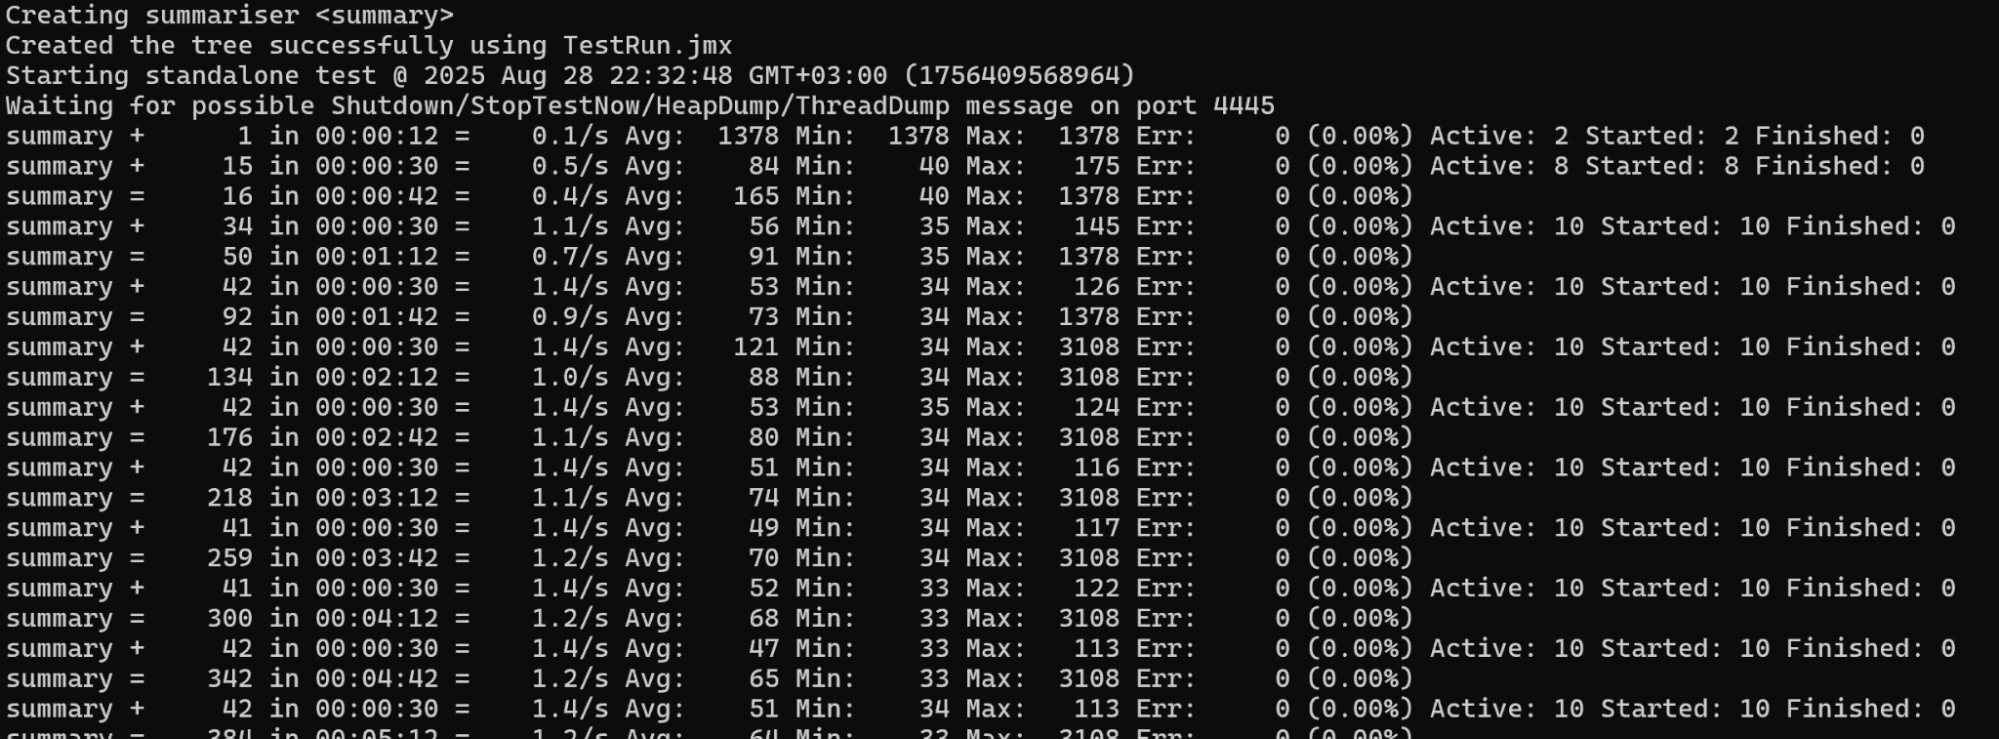
It's a bit dark when JMeter runs from the command line—you don't get a lot of information or flashy graphs. You'll get a periodic summary of the test (see below). The key thing to check is that threads are starting and stay active during the test, and the Error percentage is low to zero.
Data Analysis
As I mentioned, I like to mess about with the data in Excel as it allows me to focus on the response times for the steps in the user journey (transaction controllers) and also remove the ramp-up time.
However, in the command line above, it also generated a dashboard. It's worth opening this up after the test to get an early view of the results.
I check the dashboard for percentage errors and then look at the response time, etc. The error percentage is important, as a high number of errors means you may have a problem either in your test script or you've unearthed a problem with your website. It's important to check the errors for each transaction in your test, as sometimes they can be concentrated to a single transaction.
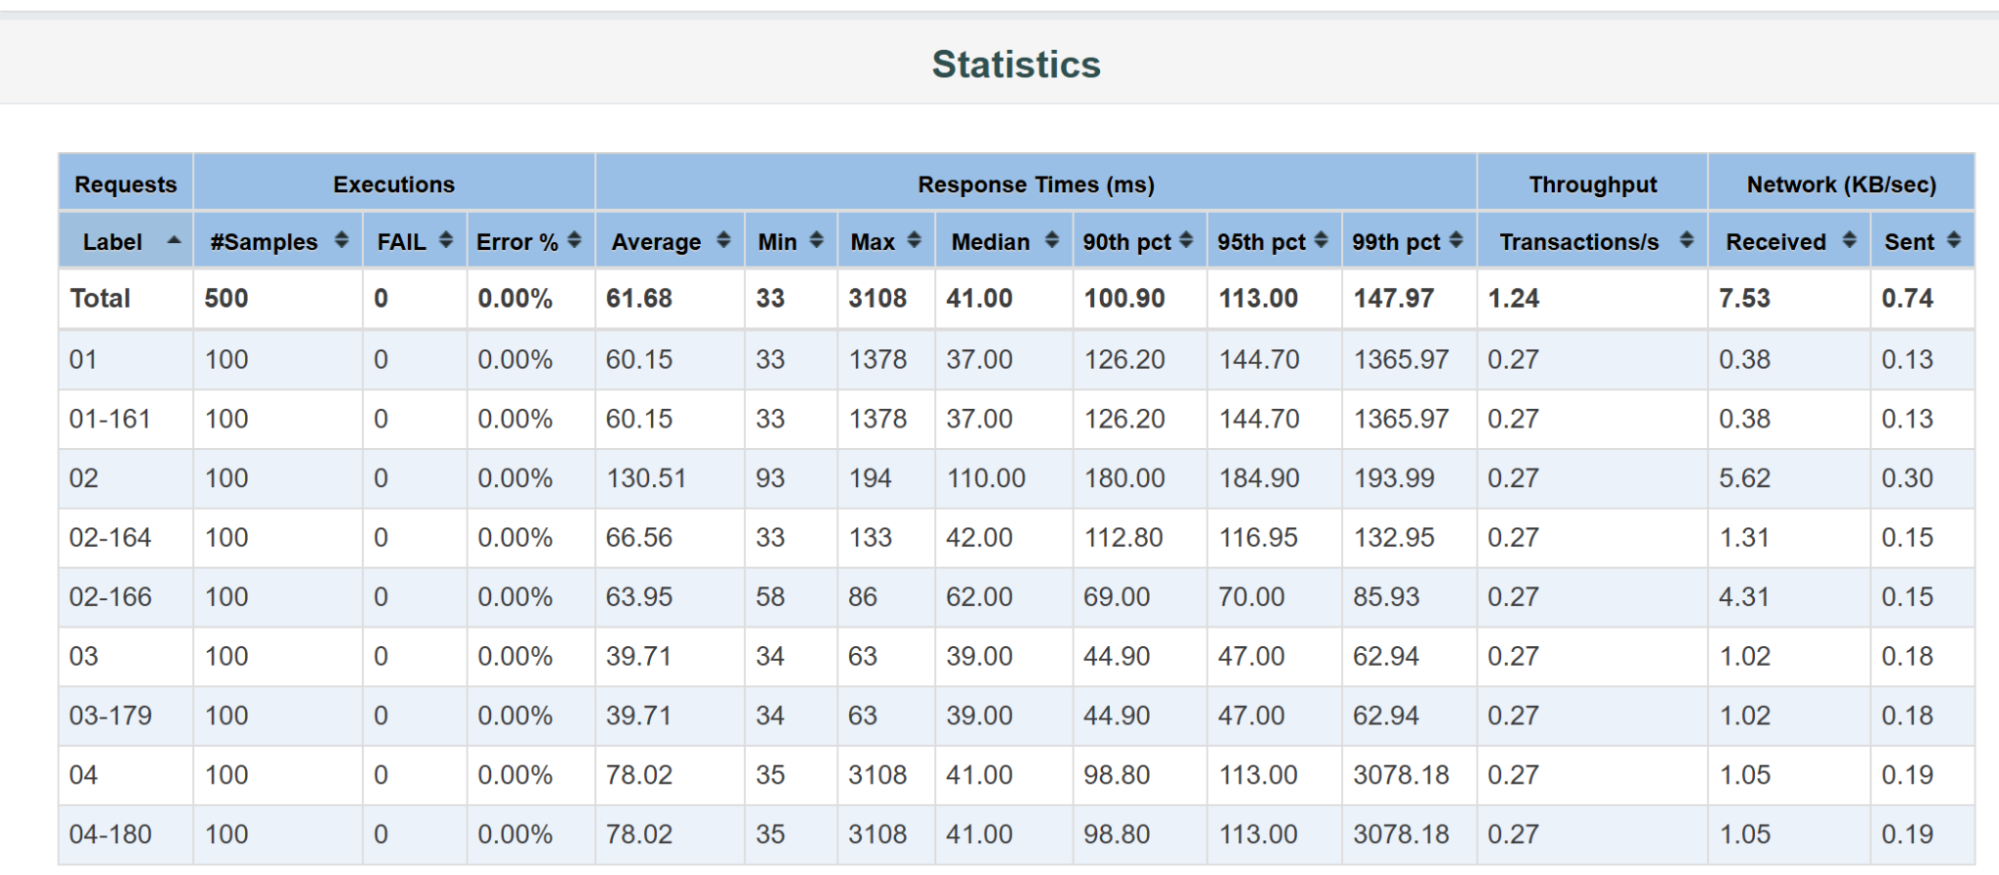
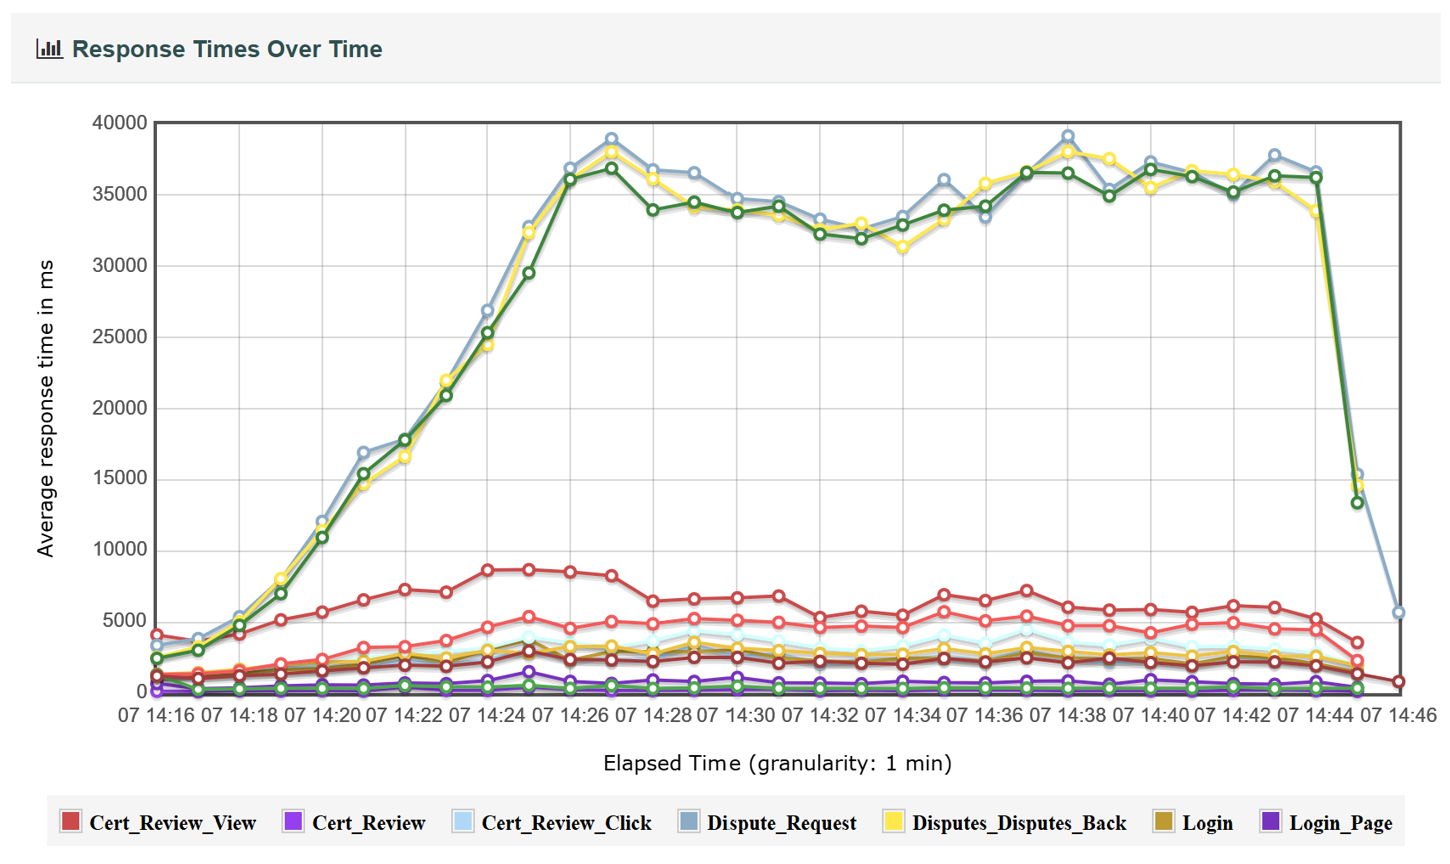
What you'll look for are response times that are longer than you think your users will accept or what you want to deliver.
We normally focus on the percentile measures, e.g., 95th percentile. This tells you that 95% of your requests completed faster than the value displayed, and is better, as averages can be easily skewed by outliers.
Look for transactions where you think less than 95% of your user base would be happy with the values displayed. These are the transactions you want to investigate, but that's out of scope for this article.
Summary
I hope you enjoyed this introductory tutorial to using JMeter. It is, of course, only an introduction, and there's much more to learn about JMeter and backend Performance Engineering.
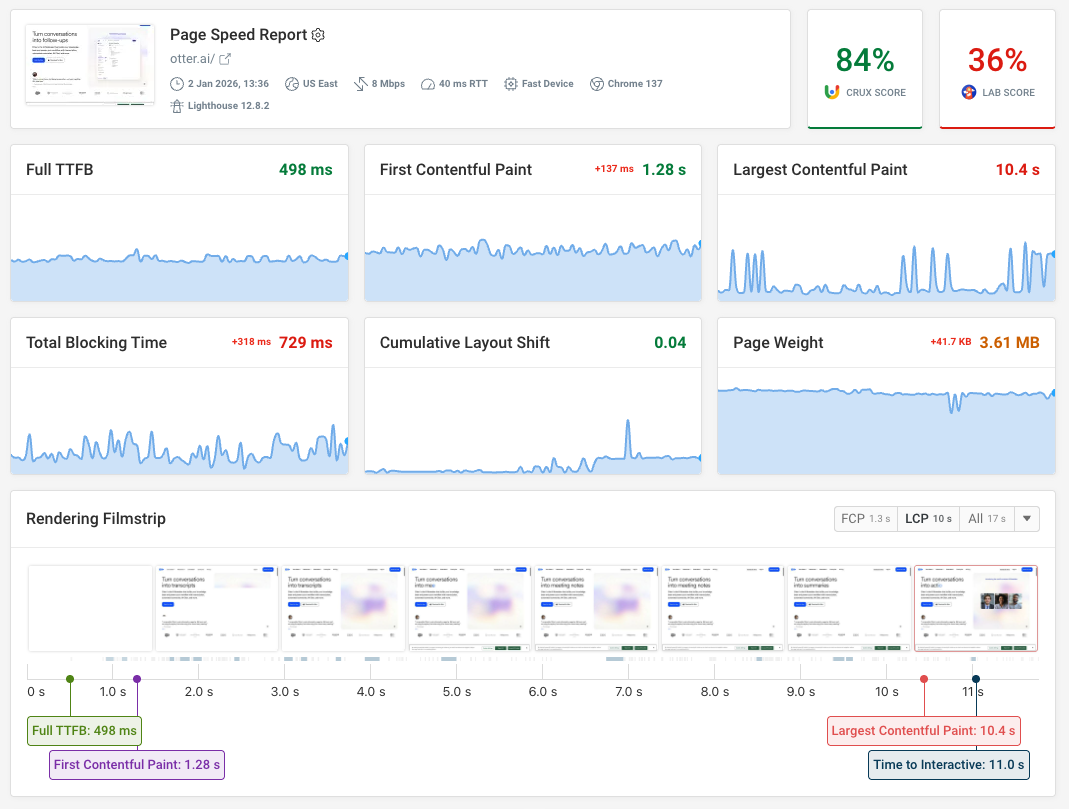
If you'd like to measure real user website performance you can try out DebugBear to see how visitors experience your website and where you can improve.
You can also set up continuous synthetic performance tests to see how front-end code is impacting page load time. Get alerted when performance gets worse and see exactly what change caused the regression.
DebugBear also provides custom performance recommendations and an in-depth request waterfall to help you identify and fix performance bottlenecks. Sign up for a free trial.


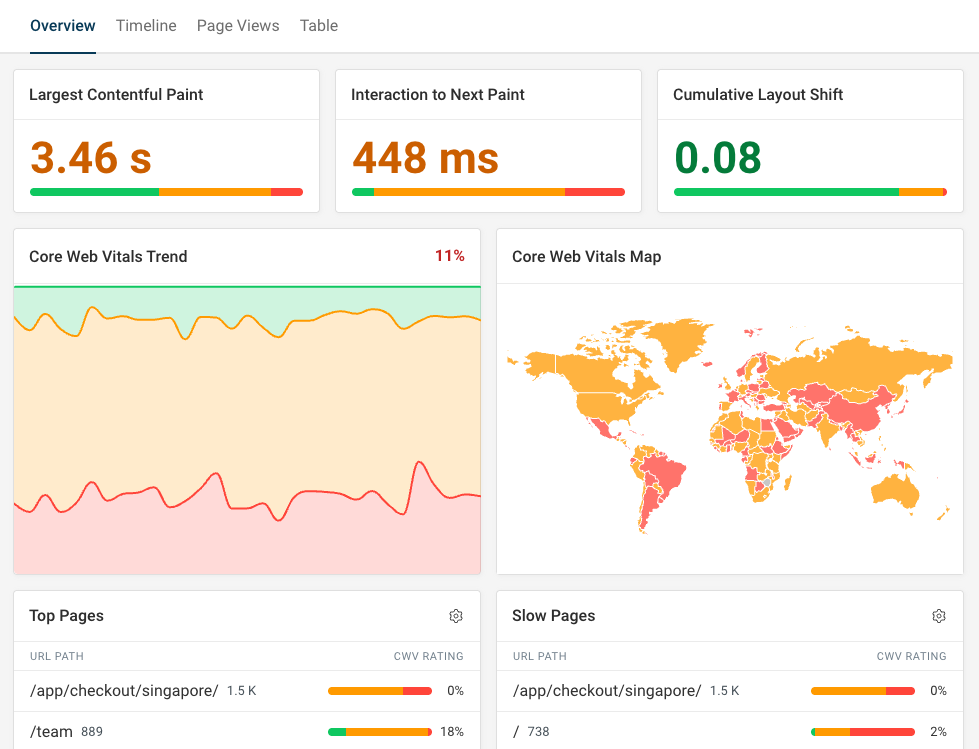
Monitor Page Speed & Core Web Vitals
DebugBear monitoring includes:
- In-depth Page Speed Reports
- Automated Recommendations
- Real User Analytics Data