
Google developed the Core Web Vitals as a way to measure key user experience metrics across the web.
Initially these metrics were only available in Chrome. However, the latest versions of Firefox and Safari now support the Largest Contentful Paint (LCP) and Interaction to Next Paint (INP) metrics.
LCP and INP support in Safari 26.2
Apple released Safari 26.2 on the 12th of December 2025.
The release included support for the Largest Contentful Paint metric and the Event Timing API that powers Interaction to Next Paint.
The Interaction to Next Paint implementation in Safari still has some bugs, so the reported INP scores are sometimes unreasonably high.
INP support in Firefox 114
Mozilla released version 114 of Firefox on the 14th of October 2025. It added support for the interactionId property that's needed to measure INP.
Firefox has already supported LCP since January 2024.
Why does cross-browser support for Core Web Vitals matter?
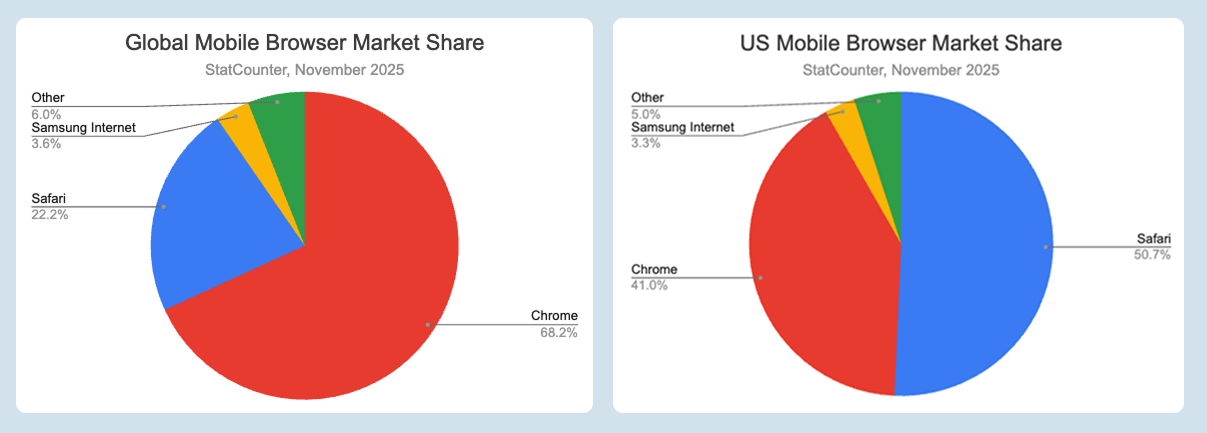
Chrome is the web browser with the largest market share. However, that still leaves 30% of visitors using other browsers. In the US, Safari is the most popular browser on mobile with over 50% of the market.
Previously, these visits were practically invisible when measuring real user performance. Websites could measure older metrics like Time to First Byte and First Contentful Paint, but these don't capture what really matters to users.
How to try out the newly available APIs
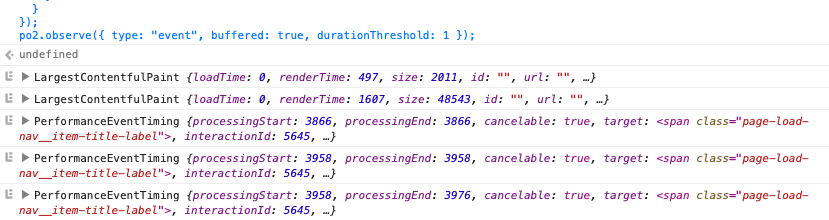
To surface LCP and INP measurements, set up a PerformanceObserver for the largest-contentful-paint and event entry types.
Try running this code in the browser console.
let lastLcp;
const po = new PerformanceObserver((entryList) => {
  const entries = entryList.getEntries();
  for (const entry of entries) {
    console.log(entry);
  }
});
po.observe({ type: "largest-contentful-paint", buffered: true });

const po2 = new PerformanceObserver((entryList) => {
  const entries = entryList.getEntries();
  for (const entry of entries) {
    if (entry.interactionId) {
      console.log(entry);
    }
  }
});
po2.observe({ type: "event", buffered: true, durationThreshold: 1 });
The paint and interaction timings data is then logged as the page renders and the user interacts with the page.
The INP metric is calculated based on multiple page interactions. Use Google's web-vitals.js library to easily calculate all Core Web Vitals metrics.
What about Cumulative Layout Shift?
CLS was not part of the Interop 2025 initiative. There is a proposal to include it next year. However, whether it will be included has not been decided yet.
Safari support for the Navigation API
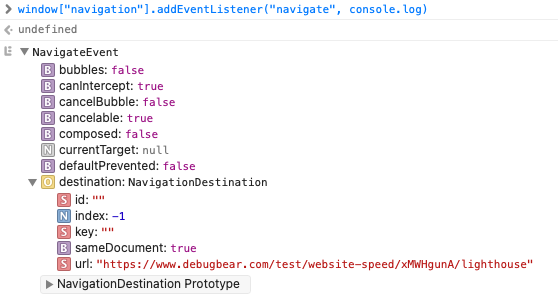
Safari 26.2 also added another useful feature: the Navigation API. It provides a number of useful features for building single-page applications.
It's also useful for measuring SPA performance as it makes it easy to detect URL changes with the navigate event:
window.navigation.addEventListener("navigate", console.log);
The browser then logs any navigations and their destination URL.
Will this impact CrUX data?
CrUX is the Chrome Use Experience Report. That means it will continue to only report metrics for logged-in Chrome users who've opted into analytics data collection.
This might mean you'll see a greater discrepancy between real user data and CrUX metrics. However, you can always filter your data to just look at Chrome visits.
Adoption of new browser versions
Before you can start measuring LCP and INP in Safari and Firefox, your users first need to update to the latest browser versions, for example by updating iOS.
That means it's going to take a few months for widespread adoption, and legacy browsers will remain in use for a while. The Baseline project considers a feature to be widely available 30 months after it has broad browser support.
Visitors that don't update their browser are also likely to have less powerful devices, so their Core Web Vitals metrics are likely to be worse.
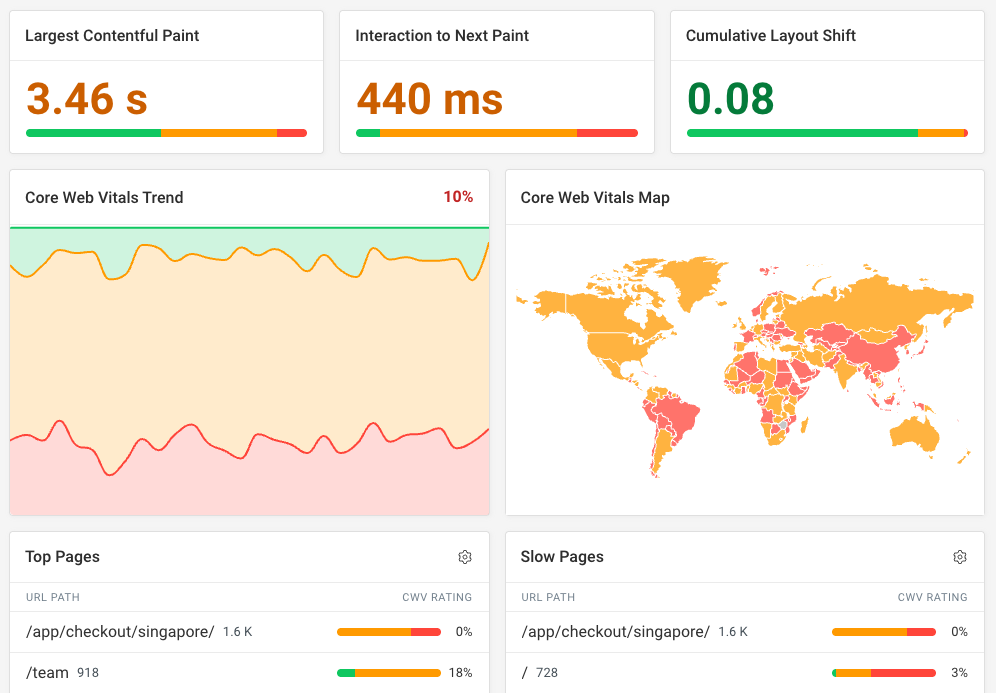
Measure cross-browser Core Web Vitals with DebugBear
DebugBear makes it easy to track Core Web Vitals and other performance metrics on your website. Identify slow pages, diagnose what's causing poor performance, and get alerted to any page speed regressions.


Monitor Page Speed & Core Web Vitals
DebugBear monitoring includes:
- In-depth Page Speed Reports
- Automated Recommendations
- Real User Analytics Data