
What do you need to do to improve visitor experience on your website? In this article we'll take a look at the Splunk homepage as a real-world example of a website that can be optimized and identify what's slowing it down.
A high-level look at Core Web Vitals
Google's Core Web Vitals metrics can be used to assess the loading time and other user experience factors of a website.
As part of the Chrome User Experience report (CrUX), Google also publishes real visitor data for many websites as well as individual page URLs.
That means you can test your website with a tool like PageSpeed Insights or the DebugBear website speed test to see how well a website performs for real visitors.
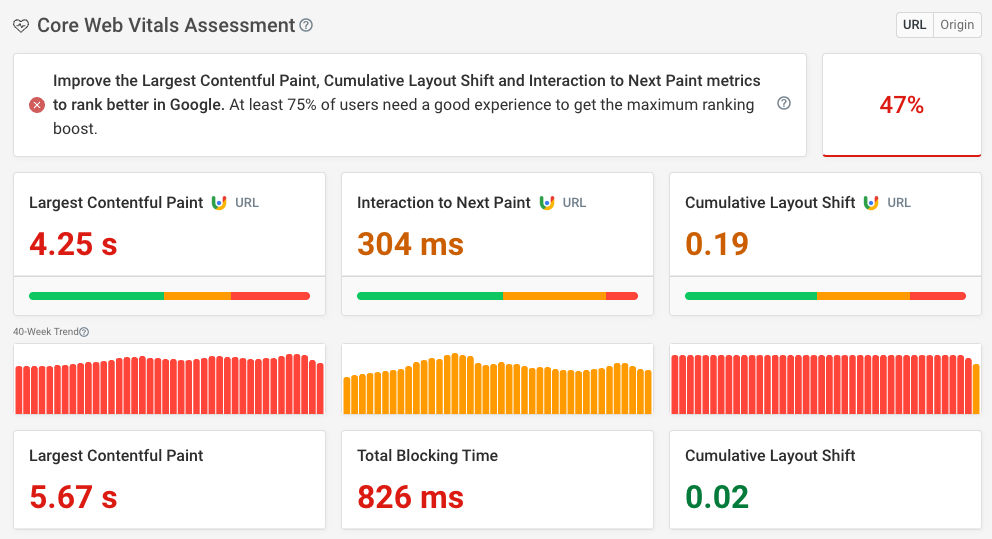
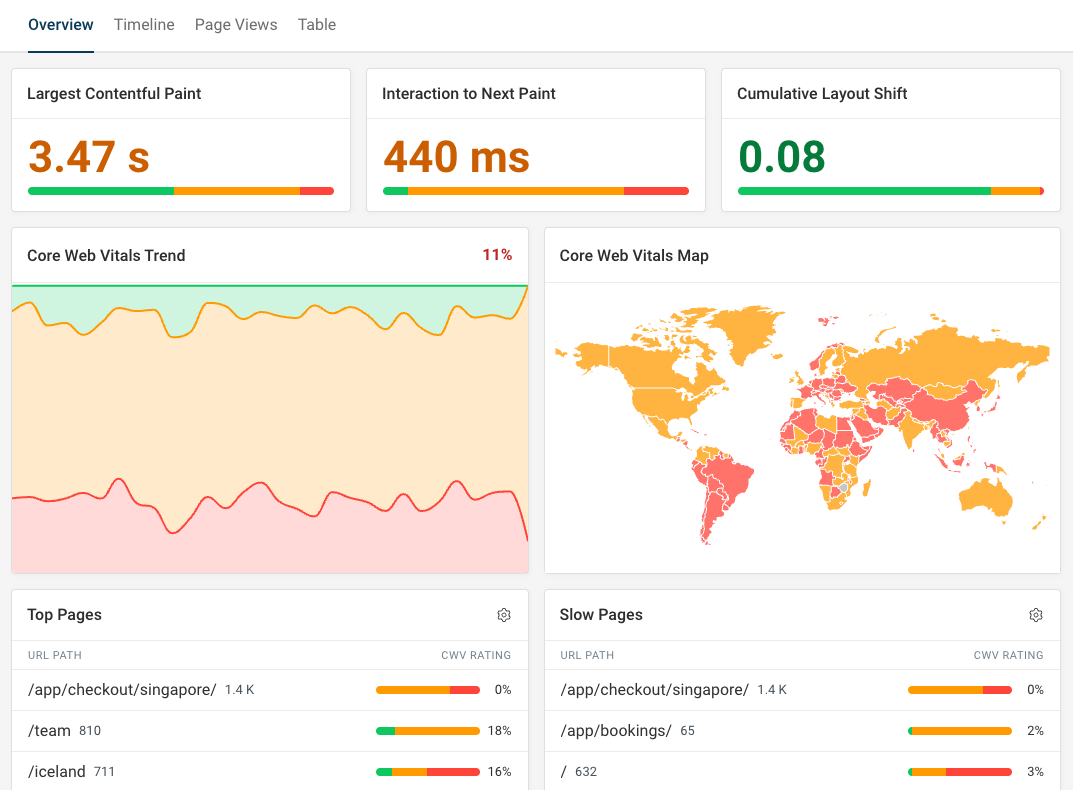
When testing the mobile Splunk homepage we find that it does not do well on any of the three criteria:
- It takes 4.25 seconds for the main page content to show up
- User interactions result in a delay of 304 milliseconds before the page responds
- Page content shifts around after first appearing on the page
Let's go through these problems one by one.
Slow page load time
Google's CrUX data is great to see how fast a website loads for real visitors. But it's not very detailed, which is why we'll look at synthetic test data to identify optimizations.
Lab-based tests provide more in-depth technical reporting of what's happening when a website is loading, and can also help us automatically identify potential optimizations.
A/B tests hiding page content
A/B testing tools often come with so-called anti-flicker snippets. These snippets hide page content until A/B tests have been loaded and applied.
If we look at the HTML we find a script that adds an async-hide class to the body, which in turn sets the body opacity to zero.
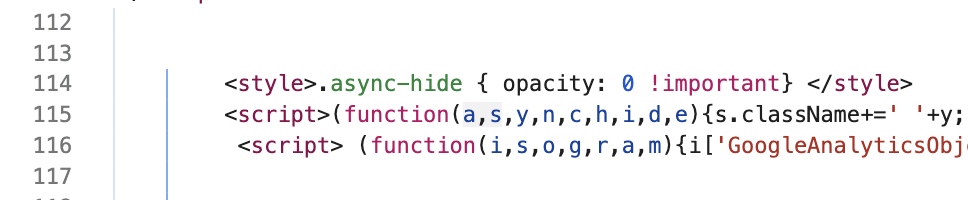
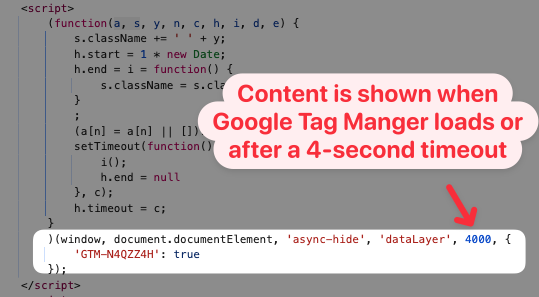
That means content is hidden even after it's been loaded, until it's removed either by some code loaded via Google Tag Manager or after a 4-second timeout (so that if GTM doesn't load the page can still render eventually).
Content hiding can often be restricted to specific page elements that are subject to A/B tests, and it's also best to only hide content on pages where you're actually running tests.
However, in this case I don't think there's any need for hiding any content. The function(a,s,y,n,c,h,i,d,e) function usually comes from Google Optimize. However, this service was shut down in September 2023, so the anti-flicker snippet is no longer necessary.
It looks like the A/B testing code in the Splunk homepage HTML just hasn't been removed yet.
Embedded images in the HTML
One suggestion that the DebugBear test offers is reducing the size of the HTML code. It's a 344 kilobyte download, with a size of over one megabyte after decompression.
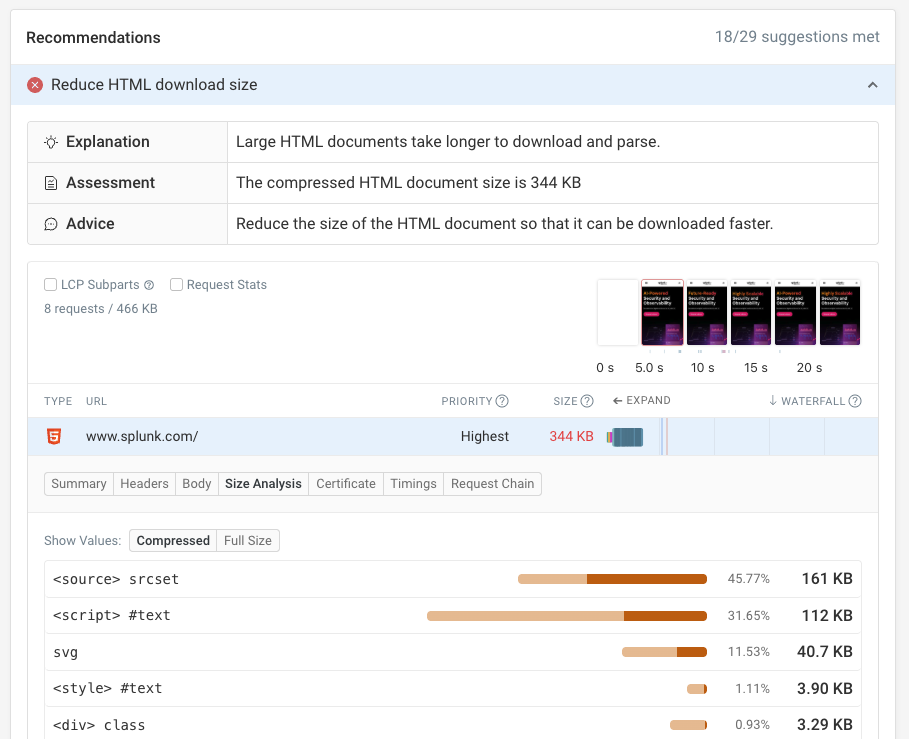
Most of the data comes from embedded Base64 images in the HTML.
The srcset HTML attribute is used for responsive images that let developers load images at a size appropriate for different devices as well as adjusting image content depending on the amount of space available.
In theory that's good for performance, as each device can load the most applicable image. However, in this case, mobile devices always have to load the desktop image as well, as the image content is directly embedded in the HTML code.
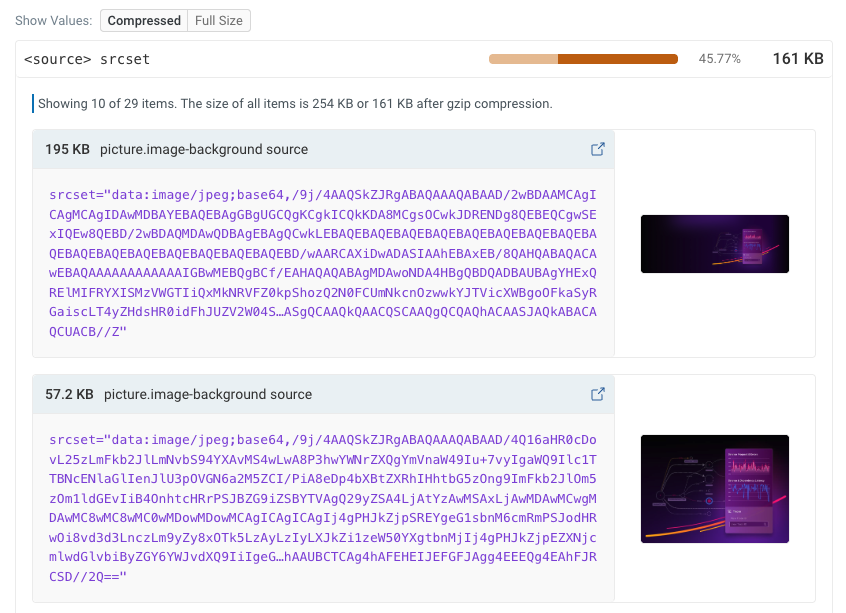
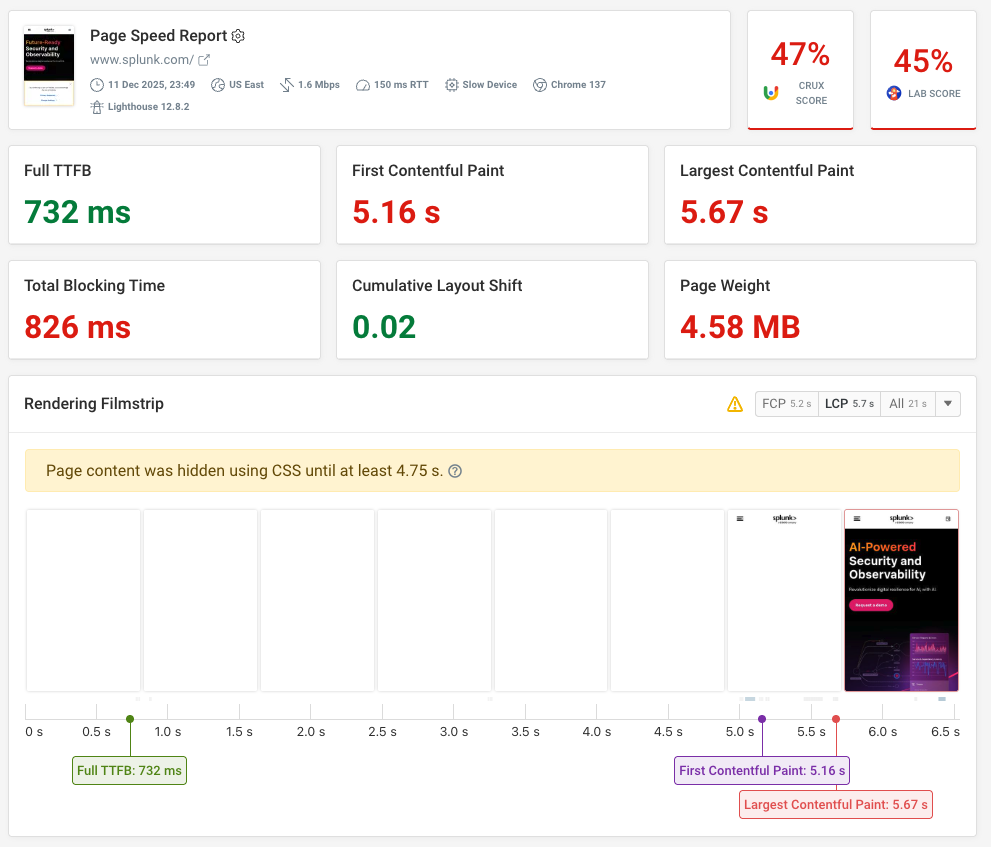
In this case the large embedded images are actually responsible for the rendering the largest content element on the page, so optimizing the page to load these images quickly is a good idea.
However, I'm generally pretty skeptical of inlining other files directly in the HTML or CSS. Adding the fetchpriority="high" attribute to the image will ensure that the browser loads external image files early.
On the Splunk homepage the inline image also appears ahead of the page title in the HTML, which means the text can't show until after the image has been downloaded.
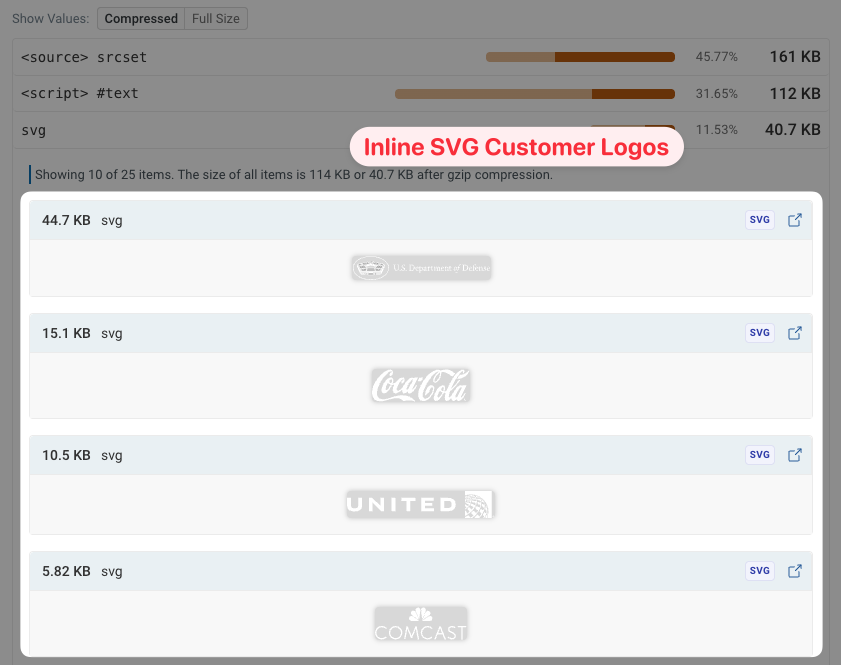
If we investigate further we also find a number of inline SVGs for different customer logos in the HTML. These could also be loaded as separate image files, to reduce bandwidth competition with the most important page content early on.
No support for the back/forward cache
When navigating around a website, visitors often revisit previous pages by navigating back in the browser. The back/forward cache allows browsers to restore previous pages instantly, without having to reload the page.
The Web Vitals tab in DebugBear shows us that 10% of mobile homepage visits on the Splunk website are back/forward navigations.
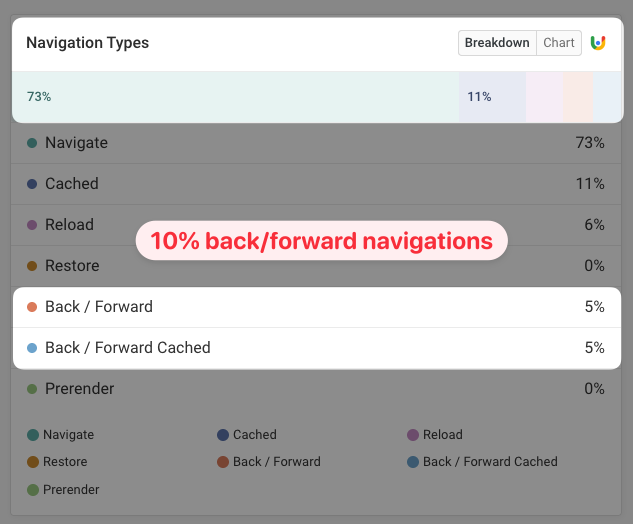
However, only half of these pages could be restored from the back/forward cache. Certain page behaviors prevent the back/forward cache from being used.
The "Page prevented back/forward cache restoration" Lighthouse audit can point us to what on the page is causing this problem.
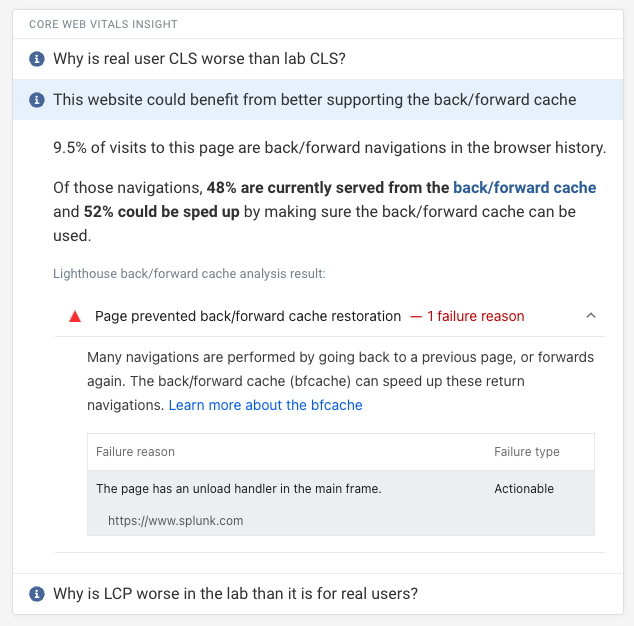
In this case, Lighthouse detects an unload handler that prevents the page from being eligible for the back/forward cache.
If we go into Chrome DevTools and dig a bit deeper, we find that fbevents.js and a custom script are adding unload event handlers.
If these unload handlers were removed then the page could load instantly 10% of the time!
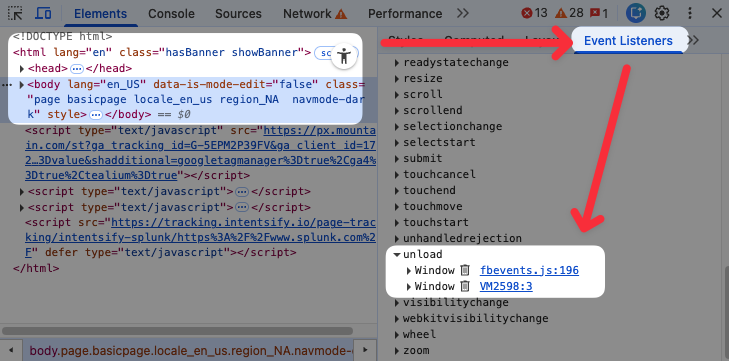
Why does this only impact some customers? If you decline cookies in the consent manager then no unload handler is added.
Debugging slow user interactions
Google reports an Interaction to Next Paint score of 304 milliseconds at the 75th percentile. For 12% of visitors the page freezes for over 500 milliseconds after an interaction.
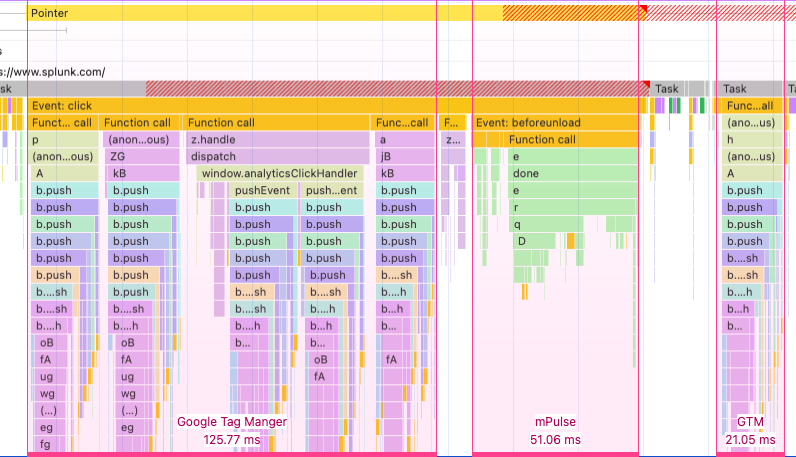
If we record a DevTools performance profile and interact with the page we can see what scripts are slowing down interactions.
A link results in various tracking events being sent, which are then processed by Google Tag Manager. It also triggers a beforeunload event, which results in mPulse presumably sending performance data back to the server.
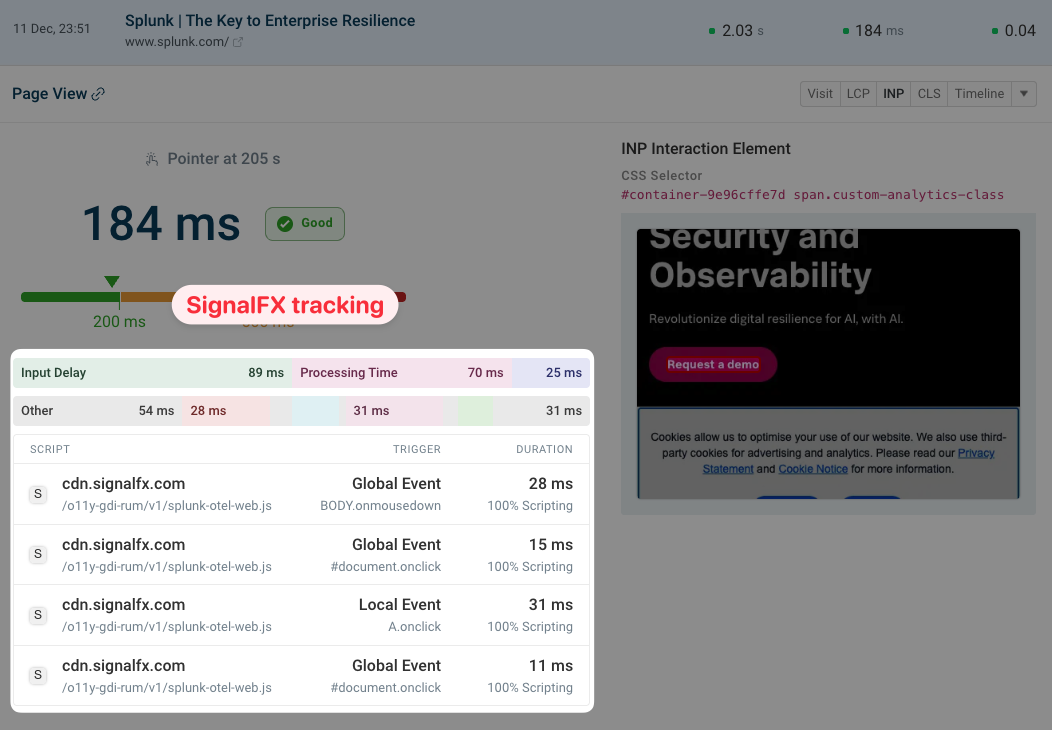
If we load an event from Splunk into the DebugBear real user monitoring dashboard we can also see several scripts from SignalFX delaying an interaction.
Overall, the interaction delays on the Splunk homepage are the result of various tracking scripts.
You can identify scripts that slow down visitor interactions using the Long Animation Frames API.
Visual instability
Content that shifts around on the page disorients visitors when reading, and can also result in accidental clicks.
What's causing layout shift on the Splunk homepage? Currently it's mostly a banner that's inserted at the top of the page to announce the recent acquisition of Splunk by Cisco.

Once the promo banner becomes visible that's detected using an IntersectionObserver. Since the main content is now overlapped by the banner, the page uses JavaScript to add margin at the top of the main content so that it remains visible. This margin causes the content to shift down.
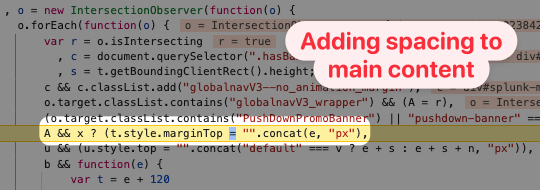
I found this code by adding an attribute change DOM breakpoint in Chrome's JavaScript Debugger.
Audit your own website
Hopefully you've found this real world performance audit useful!
If you're working on your own website performance, DebugBear is a monitoring and optimization tool for page speed and Core Web Vitals. Get detailed performance reports and use real-user monitoring to see how visitors experience your website in real time.


Monitor Page Speed & Core Web Vitals
DebugBear monitoring includes:
- In-depth Page Speed Reports
- Automated Recommendations
- Real User Analytics Data