
Slow websites continue to be a problem and a lot of work is being done so developers can measure performance more effectively and fix performance issues.
This article contains a list of what's changed in web performance in 2025 and what to look forward to next year. Previously in this series: 2024, 2023, 2022.
1. Cross-browser support for Core Web Vitals
Google originally announced the Core Web Vitals in 2020. It's a set of three metrics that measure website speed and user experience. Today, these metrics are:
- Largest Contentful Paint (LCP): how fast does the page load?
- Interaction to Next Paint (INP): how quickly does the page respond to user input?
- Cumulative Layout Shift (CLS): is page content stable after rendering?
For a long time, these metrics could only be measured in Chrome. Then in January 2024, Firefox added support for the Largest Contentful Paint metric.
However, the Core Web Vitals were still mostly Chrome-only metrics. That has started to change with the Interop 2025 project. Firefox and Safari started work on the Largest Contentful Paint and Interaction to Next Paint metrics.
Support for Cumulative Layout Shift is not currently planned, although there is a proposal to include it in Interop 2026.
Firefox has supported Interaction to Next Paint since the release of version 144 in October 2025. Safari has started to implement the two metrics, although they are currently only available in the Safari Technology Preview version (INP, LCP).
2. Insights audits in Lighthouse
Lighthouse is a free tool that lets you measure your page speed and get recommendations to improve it. It's also what powers the diagnostics on PageSpeed Insights.
Last year Google did a lot of work on improving performance tooling in Chrome DevTools. That included highlighting possible performance optimizations directly in the DevTools Performance tab.
Instead of maintaining two separate engines for identifying performance recommendations, wouldn't it make sense to re-use the same code in both places? That's what Google did with the new performance insights audits, which are available in both the Lighthouse report and in Chrome DevTools.
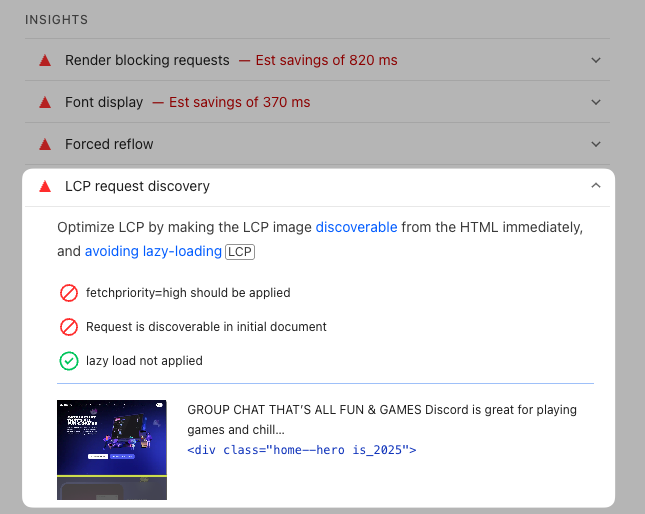
For example, this is the LCP Request Discovery audit in Lighthouse.
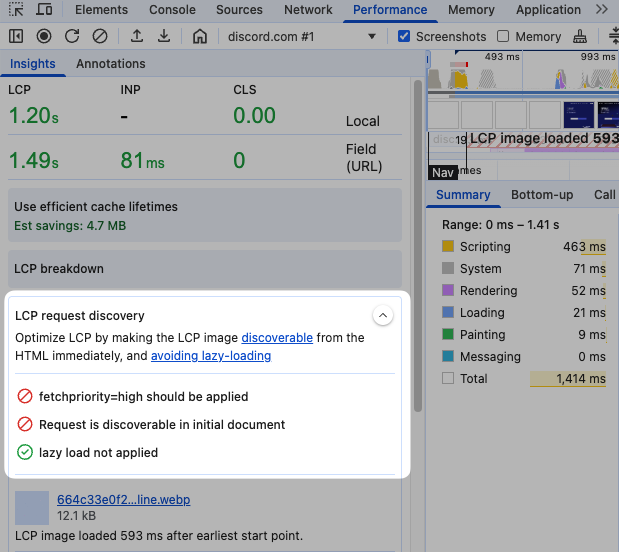
And here is the same audit in the Insights sidebar of the DevTools Performance tab.
3. Use the Scheduler API in Firefox
CPU processing in the browser has a big impact on user experience. Different processing tasks run at different times, and some are more important than others. Long processing tasks cause more interaction delays than multiple shorter tasks.
The Scheduler API makes it easier for developers to control when different tasks run. For example, the scheduler.yield() method provides an easy way to break up tasks by yielding control back to the browser's scheduler in the middle of a job. The browser can then handle other work, like handling user interactions, before continuing with the job that was in progress.
Chrome introduced this new API in 2024, and since August 2025 it's also available in Firefox. Safari does not support the Scheduler API yet.
4. New free website testing tools
At DebugBear we've long maintained a number of free tools that you can use to test the performance of your website.
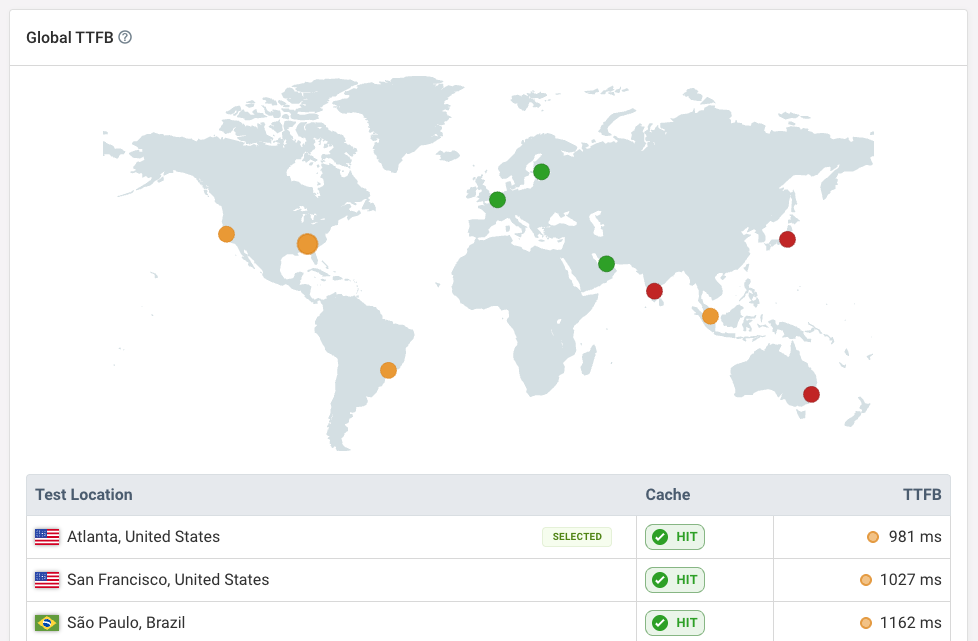
This year we added the global TTFB test that lets you see what server response times look like for your website across the world. You can also check whether responses were served from a CDN cache at each location.
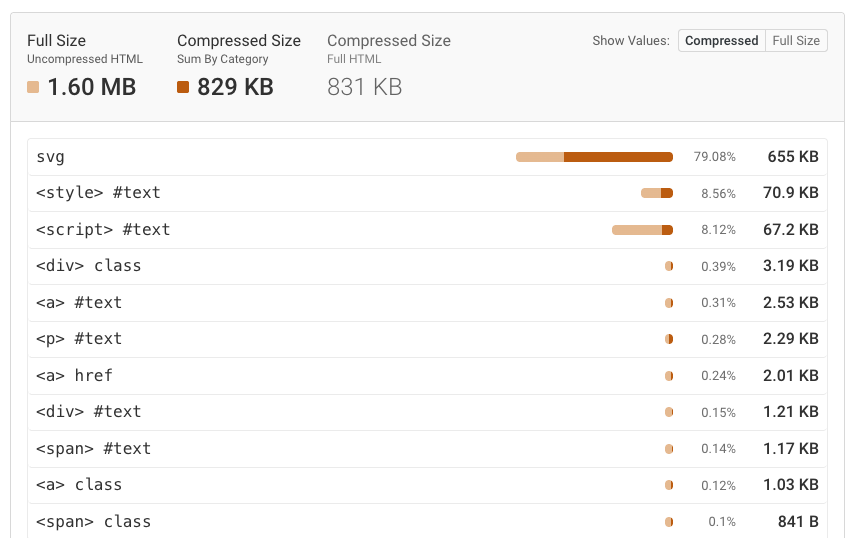
We've also completely rebuilt our HTML Size Analyzer, which lets you detect large images, fonts, or JSON data inside of your HTML code.
I wrote about different causes of large HTML documents for the Web Performance Calendar earlier this month.
The new HAR File Analyzer lets you visualize HAR files as a request waterfall. The NoScript Test checks how your website loads with and without JavaScript enabled.
5. DevTools MCP and AI features
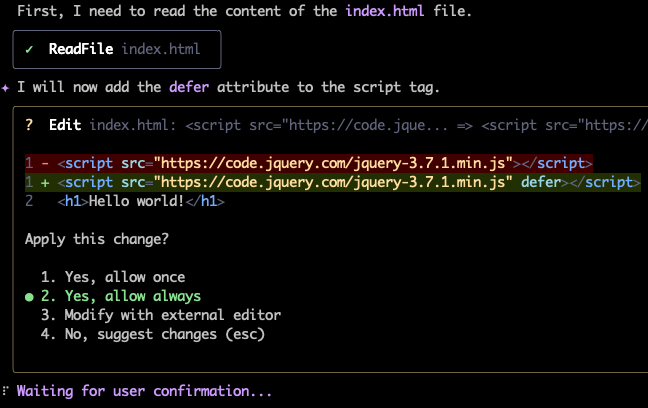
Google launched a Model Context Protocol (MCP) server that lets you control Chrome and retrieve performance data for your website.
Based on that your AI model can then make local code changes and re-test your website to see if it loads faster now.
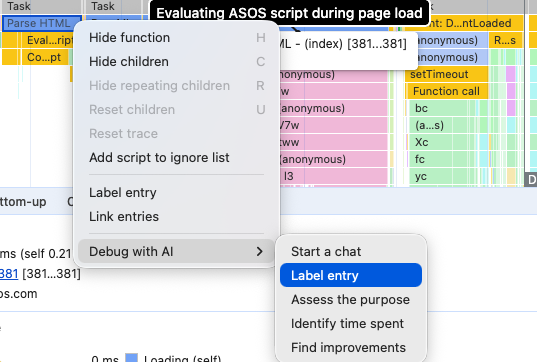
In DevTools itself, the AI debugging feature was first introduced in November 2024, and Google has continued to add AI throughout DevTools.
For example, you can use an LLM to auto-generate an annotation for different tasks in the Performance panel, or ask it to analyze a specific slow task.
6. LCP subparts in the Chrome User Experience Report
The Chrome User Experience Report (CrUX) provides real-user performance metrics for millions of websites as well as specific high-traffic URLs.
When running a lab-based test you never know if it matches real user experience. Thanks to the CrUX dataset, most website operators now have some idea of how well their website really performs on the Core Web Vitals metrics, and how often visitors have a bad experience.
It's good to know that your website is loading slowly. But what's responsible for that? A slow server response? An image that takes too long to download? Or is the content being hidden even after it's loaded?
That's why it's useful to break the Largest Contentful Paint down into LCP subparts. Since February 2025, Google has published real user data for each of these components.
This data is not surfaced on PageSpeed Insights, but you can view it in CrUX Vis or through the DebugBear website speed test.
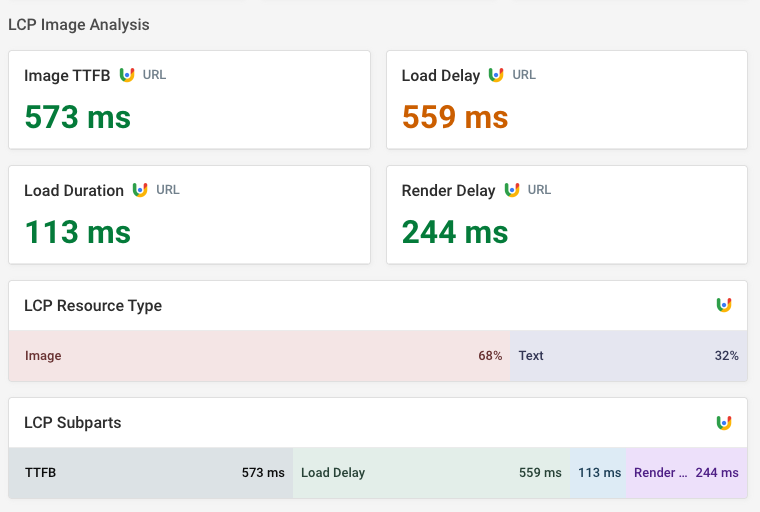
The CrUX LCP subparts data only applies to page visits where the largest content element is an image. The LCP resource type breakdown tells you for what percentage of visits that was the case.
7. Performance in the real world
The supermarket self-checkout latency analysis was by far the most fun article I worked on this year! I went around town to measure the best and worst interaction times at different shops.
Check out that extraordinary speed at the Lidl checkout 🤯
Other article highlights of the year
- A new in-depth guide on improving website performance
- Accessing a locally blocked site with speculation rules in Google search results
- How web pages start loading in tight mode and how that impacts performance
8. Positive signs for JPEG XL
Images account for a large amount of overall page weight. Modern image formats make it easy for developers to speed up websites without any negative user impact. AVIF and WebP are now both widely supported.
JPEG XL is a newer format and Google started working on supporting it in Chrome in 2021. However, this code was removed in October 2022, citing a lack of interest from the ecosystem for continuing to explore the new format. Google also didn't consider the benefits of JPEG XL to be large enough to justify the maintenance burden.
In most of this post I've talked about Google introducing a new feature long before it gets implemented in Firefox and Safari. Here it's the other way round: Apple introduced JPEG XL support in September 2023.
Mozilla was reluctant to move forward with JPEG XL due to security concerns. Complex new code always comes with security risks, especially when written in a relatively low-level language. However, they changed their position in September 2024 after discussing a possible Rust-based decoder with Google.
In November 2025 Google also announced that they are not opposed to supporting JPEG XL in Chrome, citing continued developer interest. Note that this does not mean that Google has plans to invest in implementing and maintaining JPEG XL support.
So, maybe one day, there will be a new image format that's widely supported on the web.
What are the advantages of JPEG XL over existing formats? According to Jon Sneyers from Cloudinary:
- Smaller file sizes at the same quality
- Faster encoding (which means servers don't have to pre-generate the files)
- Progressive image decoding (enabling image previews after a partial download)
- Recompression without visual changes (so no gradual build-up of artifacts)
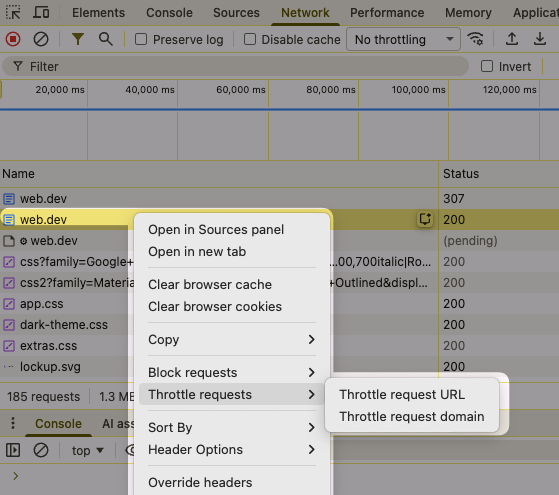
9. Throttle specific request in Chrome
Throttling the network in Chrome DevTools lets you test how your website would perform on a slow mobile connection while working on wifi. Normally all requests are throttled.
However, DevTools is now introducing support for slowing down just specific requests. Currently it's only available in Chrome Canary, but it will arrive in Stable in January 2026.
10. A new soft navigations origin trial
Today many websites don't fully reload every time the URL changes. Instead, they are built as single-page JavaScript applications where clicking on a link just results in a soft navigation.
The Largest Contentful Paint metric currently only measures load time for the initial navigation. That means website operators and developers can have a significant blind spot when looking at their performance data.
Google experimented with better ways to measure soft navigation performance in 2024. This is done through origin trials where websites can opt into new experimental features to try them out in the real world and provide feedback. However, this did not result in a finished API.
In August 2025 Chrome launched a new origin trial for soft navigations. The proposed API can detect when soft navigations take place and observe DOM modifications that take place in response to an interaction. As a result, the browser can measure load times for each soft navigation.
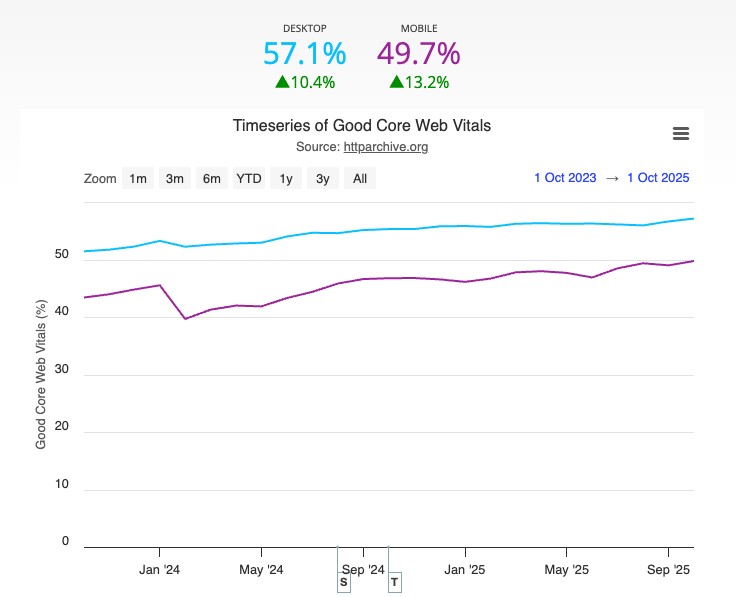
11. Gradual improvements in Core Web Vitals scores
According to the HTTP Archive CrUX Report, 57.1% of websites currently pass the Core Web Vitals assessment on desktop, compared to 49.7% of mobile websites. That means that they mostly provide a good experience across all three Core Web Vitals metrics.
There will still be many poor experiences though, as the web vitals usually look at the 75th percentile of visitor experience. The other 25% can be worse than reported.
Let's compare the October 2025 data to 2024 and 2023. Starting with desktop data:
| Month | Good Scores | Change |
|---|---|---|
| October 2025 | 57.1% | +1.8% |
| October 2024 | 55.3% | +3.9% |
| October 2023 | 51.4% |
We can see that the pass rate has increased on desktop by 1.8% over the course of one year.
On mobile there is more potential for improvement, and pass rates are still increasing by 3% each year.
| Month | Good Scores | Change |
|---|---|---|
| October 2025 | 49.7% | +3.0% |
| October 2024 | 46.7% | +3.3% |
| October 2023 | 43.4% |
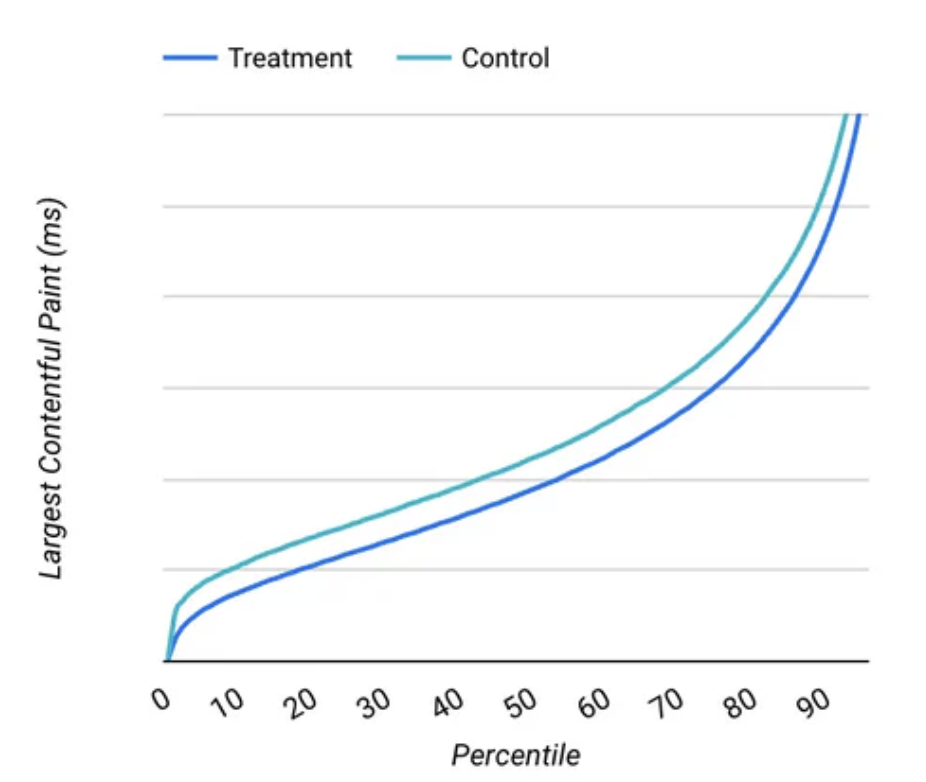
The chart above shows a big decline in mobile pass rates in February 2024. I think that's when the older First Input Delay metric was replaced with Interaction to Next Paint.
This would suggest that there have been significant improvements in website responsiveness in the months following this change, both through browser optimizations and website updates.
12. Better website monitoring
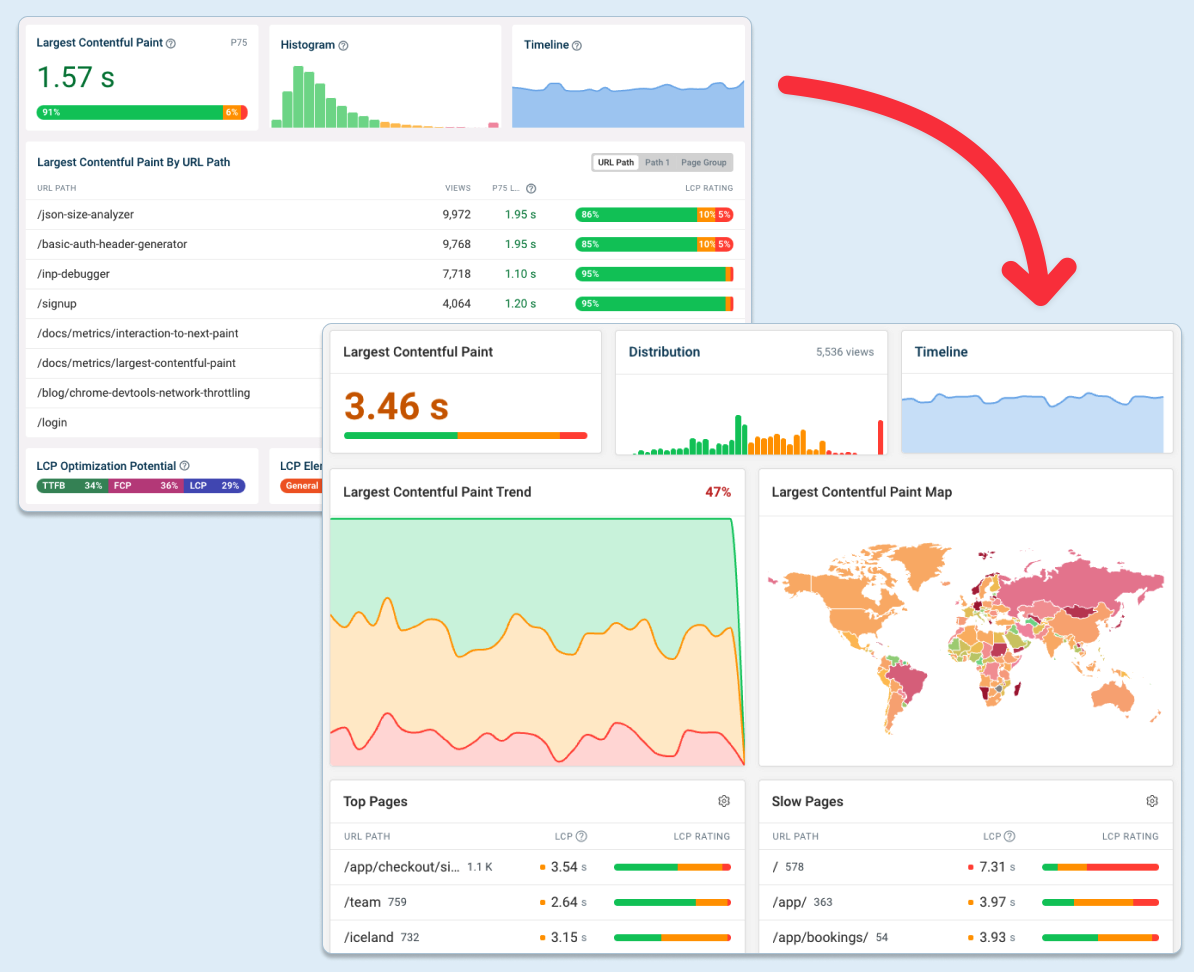
At DebugBear we've spent a lot of time this year making our product more intuitive and surfacing important data proactively.
We still show you all the technical details you need to speed up your website. But rather than starting with that, our dashboards now provide an overview of your page speed and point out specific slow pages that need to be optimized.
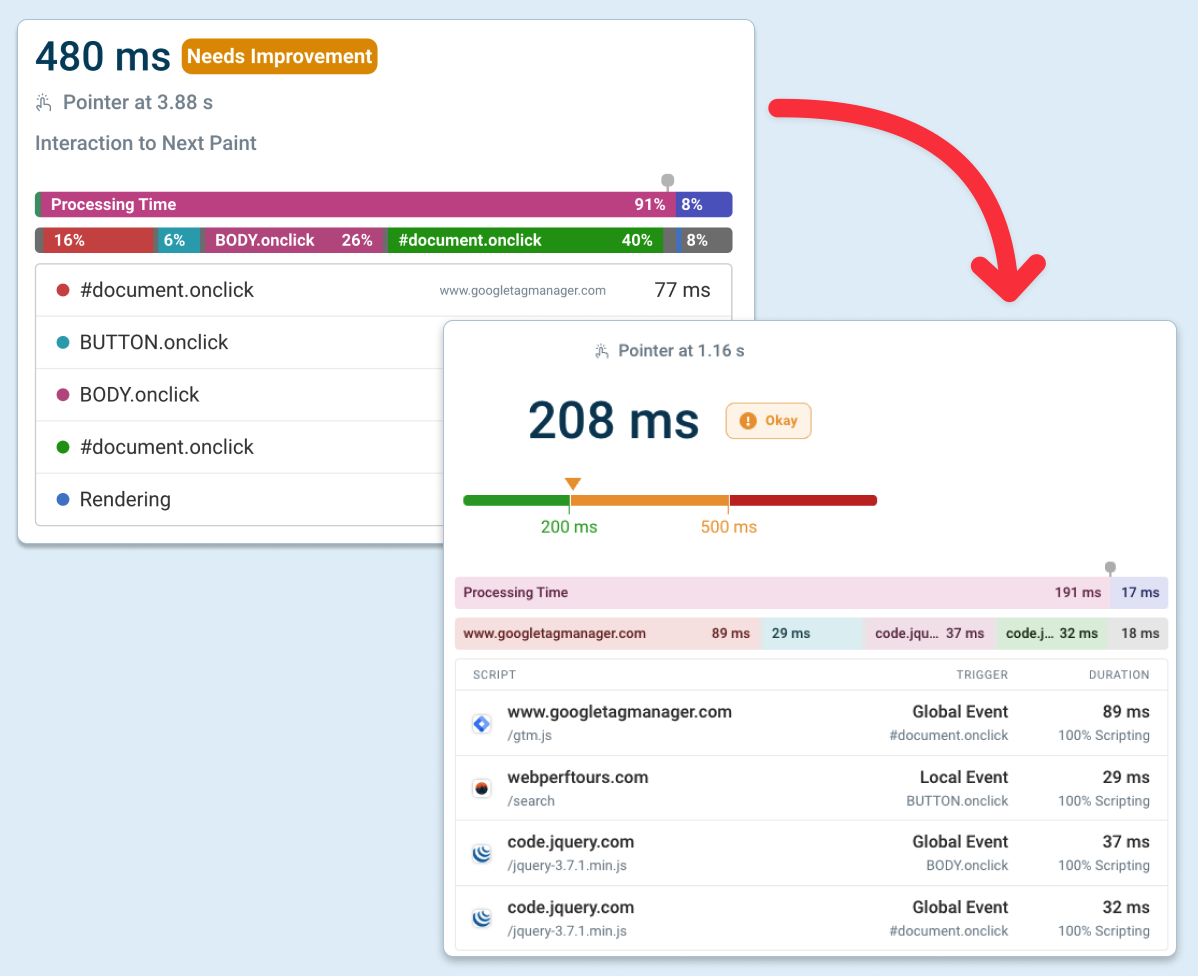
I'm especially proud of how we display the scripts that delay user interactions, based on the Long Animation Frames API.
Each script has a favicon, an explanation of why it's running, and a breakdown into scripting or layout work.
13. Changes to how TTFB, LCP, and INP are measured
After the initial release of the Core Web Vitals metrics, Chrome made many gradual changes to how these performance metrics work. Now the metric definitions are relatively stable.
Still, there are reasons why your metrics might change even when everything on your website stays the same!
TTFB and early hints
The Time to First Byte metric measures how quickly the data arrives for the HTTP response. Usually that means the content of the HTTP document.
However, early hints are an HTTP feature that lets servers tell the browser about resources that will be needed to render the page before the server has finished generating the HTML.
This request waterfall shows an example of a website that's preloading two web fonts using early hints.
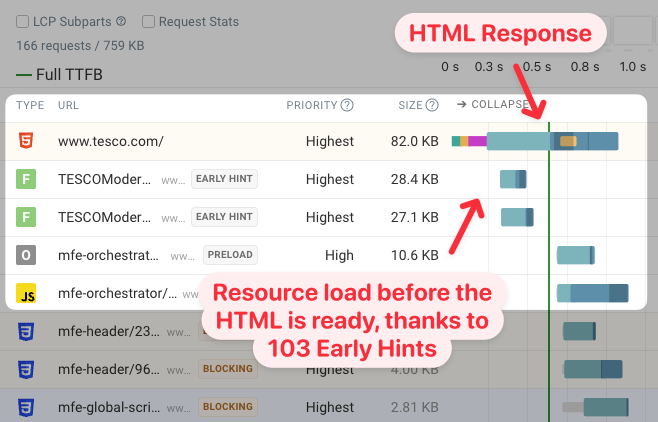
So when does the first response byte arrive now? The server is certainly responding with bytes long before any of the HTML arrives!
Since 2023 Chrome reported the responseStart value as the time when the HTML document response starts coming in. However, in Firefox and Safari the early hint response data also counted.
In February 2025, Chrome changed its behavior to align with Firefox and Safari. As a result, TTFB scores for websites using early hints improved.
Early hints mean that TTFB score comparisons across platforms can often be confusing. For example, Shopify responds with a preconnect hint to its CDN server, and Vercel returns an empty early hints response. As a result these platforms have extremely low TTFB.
LCP and cross-origin images
The Largest Contentful Paint metric often depends on when an image is rendered. For a long time Chrome did not allow websites to measure this for cross-origin images unless the server included a Timing-Allow-Origin response header. Instead real user monitoring tools had to report the time when the image was loaded, even if it was not visible yet.
Chrome changed this in February 2025, resulting in more accurate (if sometimes slightly worse) LCP scores.
INP and text highlighting
Highlighting text on a web page usually counts as a user interaction that contributes to the Interaction to Next Paint score.
Chrome rolled out a small change to this in early 2025: text highlighting no longer increases INP when the user reaches the edge of the window and triggers scrolling.
Separate LCP paint and presentation time
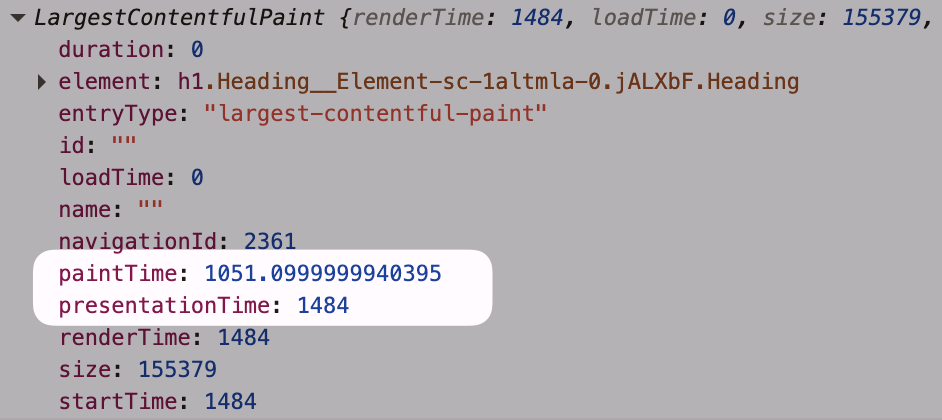
Once a browser has updated the page layout and finished painting the content that does not mean that the user can actually see it right away. Additional work is needed to actually present the content that's been rendered.
Chrome now reports more nuanced data for paint timings:
paintTime: when browser rendering is completepresentationTime: when pixels appeared on the screen
This change does not impact existing scores, but it provides a more nuanced view of what the timing is actually referring to.
14. Increased adoption of speculation rules
Speculation rules enable speculative loading of resources that might be needed for a future navigation. For example, you can pre-render an entire page automatically, or start loading the HTML document when a user hovers over a link.
Currently Speculation Rules are only available in Chrome and Edge. However, Firefox is working on a prototype and Safari has a working implementation, though it's not currently enabled by default.
The Safari implementation was implemented by Yoav Weiss from Shopify. Why is Shopify investing in this? It's because Shopify started using speculation rules across their platform in June 2025. They report a meaningful improvement in page load time:
WordPress also started using speculation rules in 2025. Most people don't build their own custom websites, so platform-wide adoption of new browser features results in performance improvements across the web.
15. New widely available browser APIs
The Baseline project defines widely available browser APIs as features that have been supported in Chrome, Edge, Firefox, and Safari for at least 30 months.
It's easy to forget that support for some APIs is still relatively new. This website by Rick Viscomi provides a good timeline of when different features became or will become baseline.
If you're measuring performance in the browser, Safari improved support for various features in 2023, resulting in them becoming baseline in September 2025:
- Measuring resources size
- Collecting server timings
As new features get native web platform support less JavaScript is required, resulting in better performance. For example, container queries, the CompressionStream API, and MathML rendering are all widely available since 2025.
A look ahead to 2026
What will happen next year?
It would be great to see support measuring soft navigation performance land in Chrome. There's currently a big gap in performance data. Single-page apps justify their often slow initial load time with the promise of faster navigations later on. Knowing whether that's really the case could help developers make better decisions.
I predict that there will be more AI features in Chrome, DevTools, and everywhere 😅.
AI models have become really powerful when editing code, and this process will become smoother with a tighter feedback loop when communicating with the browser. For example, it would be cool for the DevTools MCP server to support local overrides, so you could try out optimizations without needing to run a local server.
Maybe LLMs will also become better at writing year-in-review articles? I did give it a try this year.
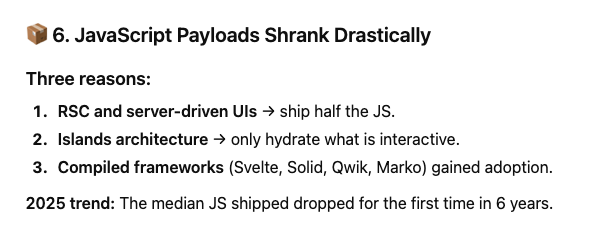
Fact check: HTTP Archive reports a 16% increase in JavaScript payloads, from 540 kilobytes to 757 kilobytes.
A better throttling simulation for Lighthouse
Lighthouse has long used a throttling simulation to determine the reported scores, sometimes resulting in inaccurate data.
For example, Lighthouse sometimes wrongly assumes that preloaded resources block rendering, even when the page content does not depend on them. Ivan Akulov from Framer has been working on updating the Lighthouse throttling simulation to better match real browser behavior.
Fixing some of these inaccuracies would make Lighthouse metrics much more reliable.
Gradual progression in browser support
AVIF finally reaches widely available status in July 2026. And the fetchpriority attribute will become baseline in April 2027.
Compression Dictionaries are a powerful technology to reduce download sizes for repeat visits. They are available in Chrome, and Firefox is actively working on support. However, they are not easy to configure on the server side, so improvements from Content Delivery Networks are also needed to increase adoption. Robin Marx talked about some of Akamai's challenges with that recently.
Once LCP and INP are available in Safari this will provide insight into visitor experience that can currently remain hidden. StatCounter puts the mobile market share of Safari in the UK at 43%. Currently slow interactions or page load delays can easily go undetected.


Monitor Page Speed & Core Web Vitals
DebugBear monitoring includes:
- In-depth Page Speed Reports
- Automated Recommendations
- Real User Analytics Data