Real User Monitoring For Web Performance
Real user monitoring (RUM) allows you to collect data on how real users experience your website. DebugBear measures Core Web Vitals metrics and provides additional data to optimize them.
RUM data stands in contrast to lab data which is collected by loading a page in a controlled test environment.
This article explains how you can use real user data in DebugBear. Learn about setup and configuration here.
Real User Monitoring Demo Video
Watch this video to learn more about how to work with the Core Web Vitals data in DebugBear RUM.
Web Vitals Trends
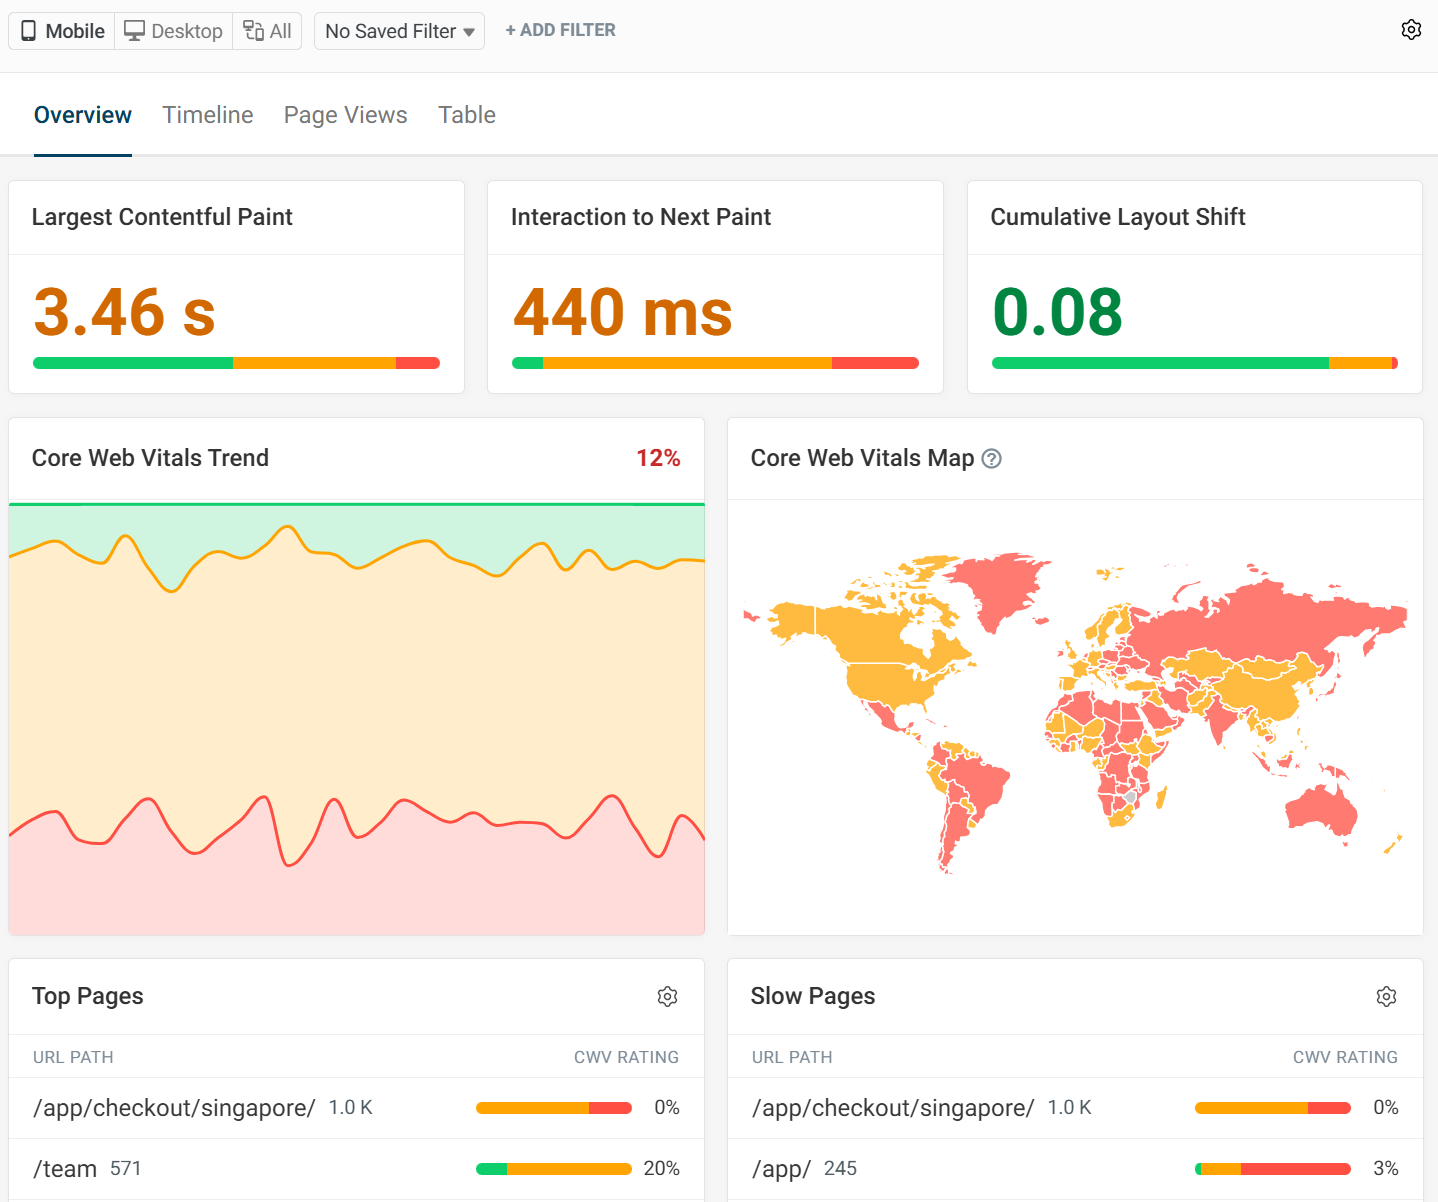
The Web Vitals tab provides a high-level view of your website performance and how it has changed over time.
The Core Web Vital scores for the 75th percentile are presented at the top. With the page table overview below, so you can see the individual scores for your most viewed pages. There is also a colorized trends tab highlighting how Core Web Vitals scores change over a period of time.
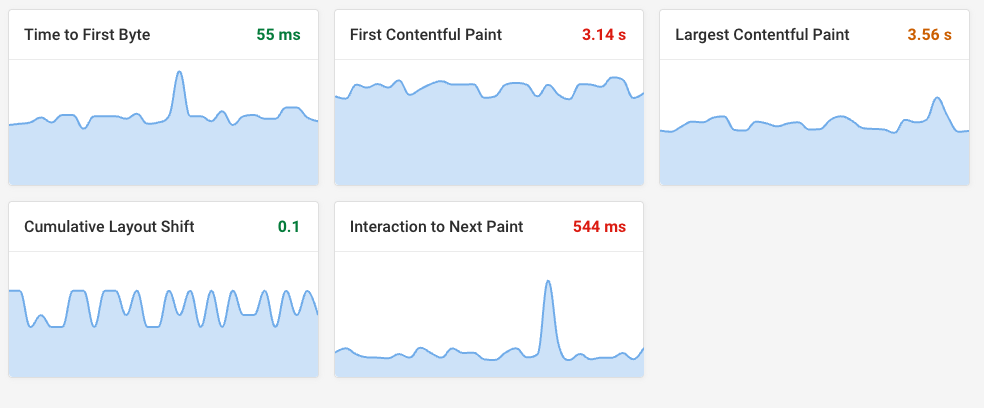
DebugBear collects data for many metrics including these:
- Largest Contentful Paint
- Cumulative Layout Shift
- Interaction to Next Paint
- Time to First Byte
- First Contentful Paint
You can find an overview for all of these metrics by clicking the Timeline tab.
View individual page views
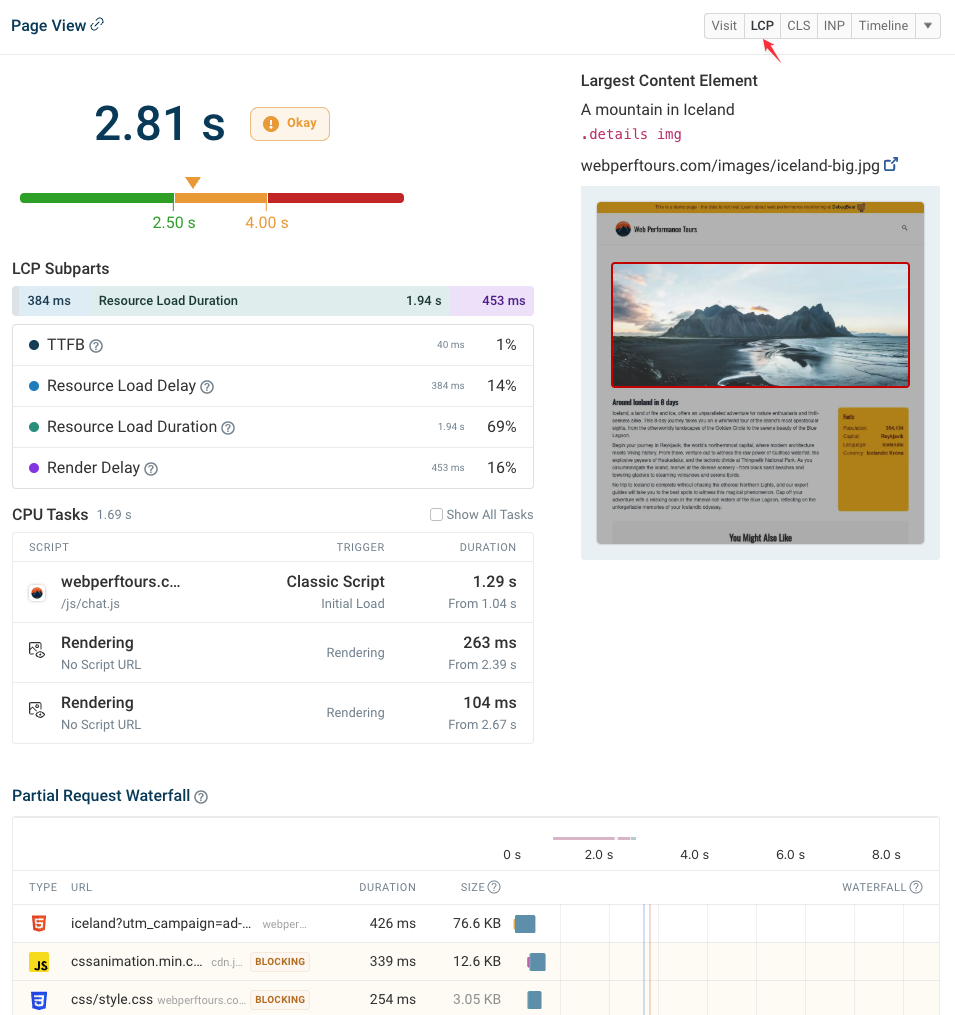
The Page views tab shows you how specific visitors have experienced your website. This detailed data can help you replicate page speed issues and identify ways that a specific user experience could have been faster.
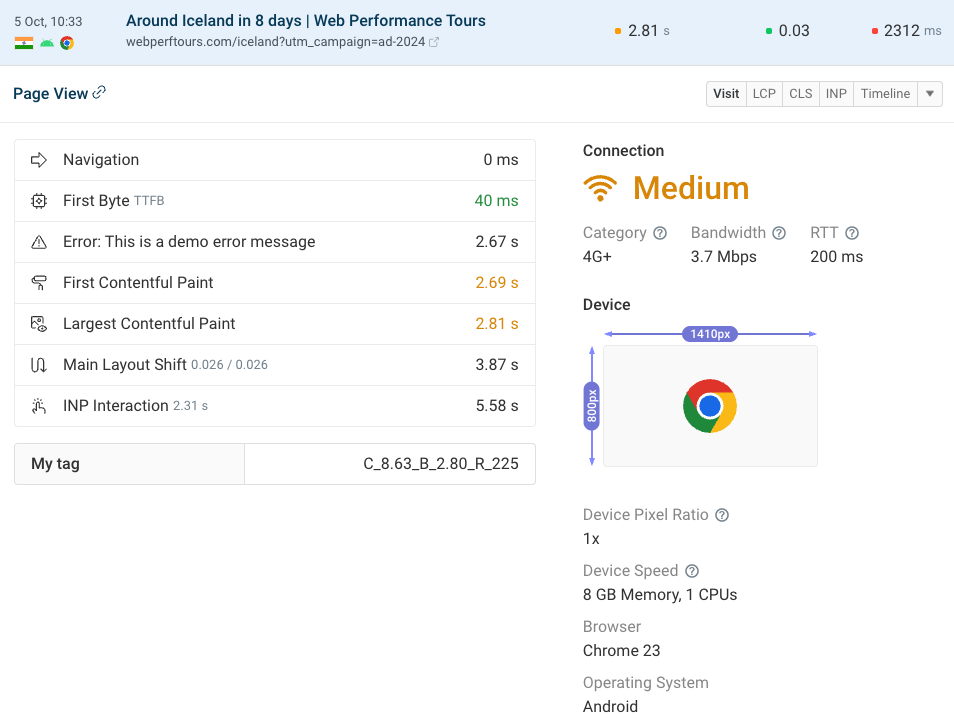
You can also view the component breakdown for a metric such as LCP or INP for that specific visitor.
For example, the LCP details tell you:
- The LCP subparts contributing to the overall score
- Scripts that run during the initial page load
- A network request waterfall
- The name, CSS selector, and URL of the Largest Contentful Paint element
Metric-specific tabs
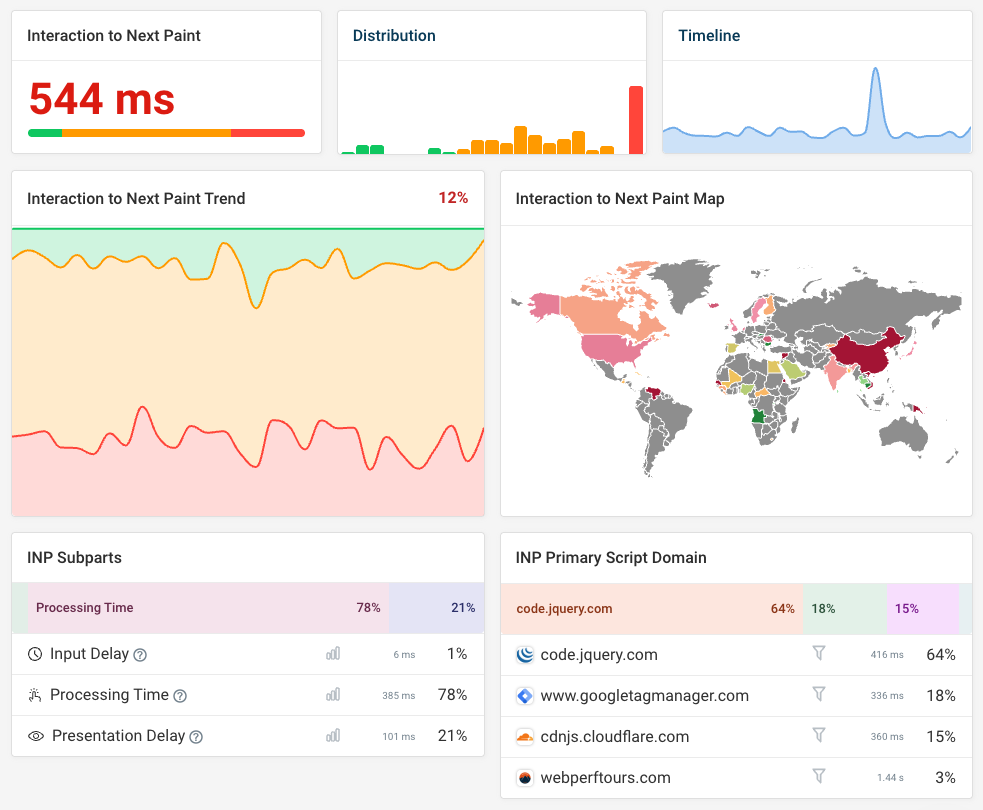
DebugBear also offers specific tabs to help you track and optimize the 5 performance metrics mentioned above.
Even on a slow website some users will have a fast experience. Some pages will be fast and some pages will be slow. The top of this tab shows the metric score and a histogram that breaks down the total number into groups of fast experiences, ok experiences, and slow experiences. As well as a timeline graph which shows any changing trends in the score across a selected period.
Next the table shows the pages with the most traffic and their scores. If you are looking for places to improve your website you can also choose to view the slowest pages on your site.
Clicking the breakdown tab will provide individual charts based on the selected metric. For example, here we can see:
- A larger histogram showing the distribution of INP scores
- Whether slow interactions are click or tap based, or whether keyboard entry is slow
- What kind of element users interact with
- Why the longest INP script is running
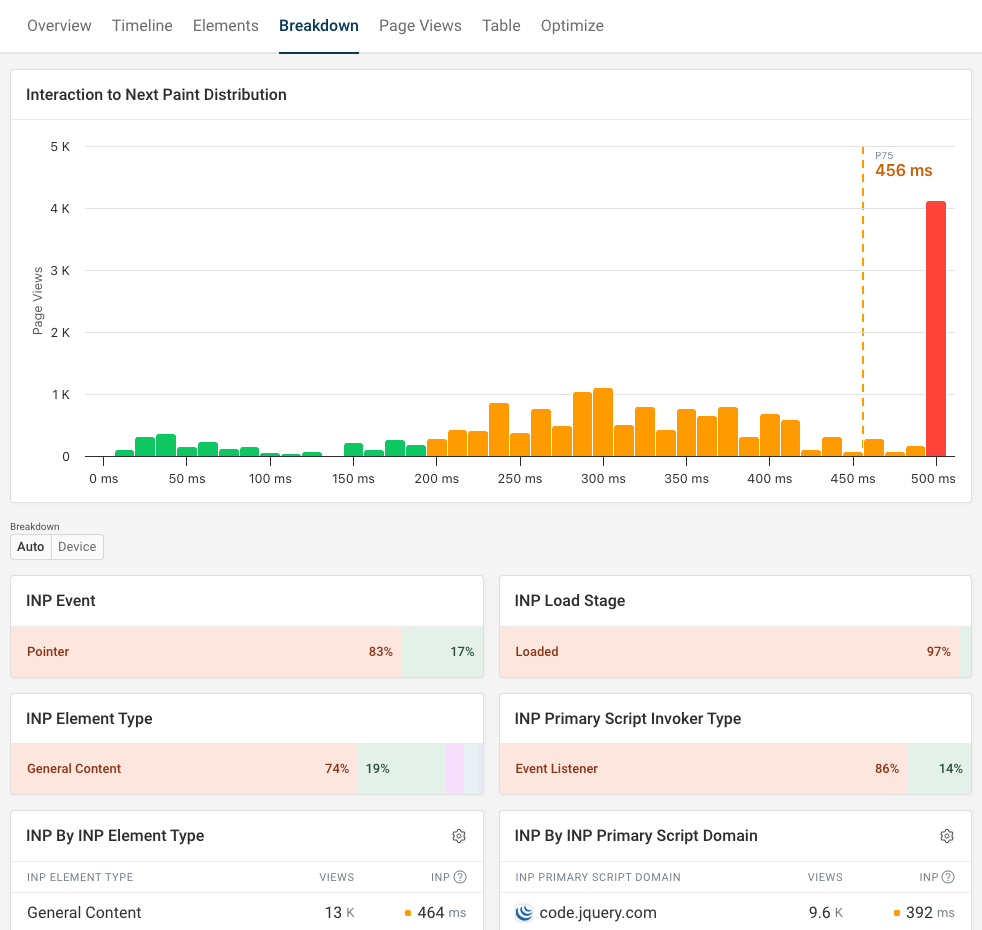
You can hover over each table row and click the funnel icon to apply a filter to the dashboard and only see page views matching that specific property.
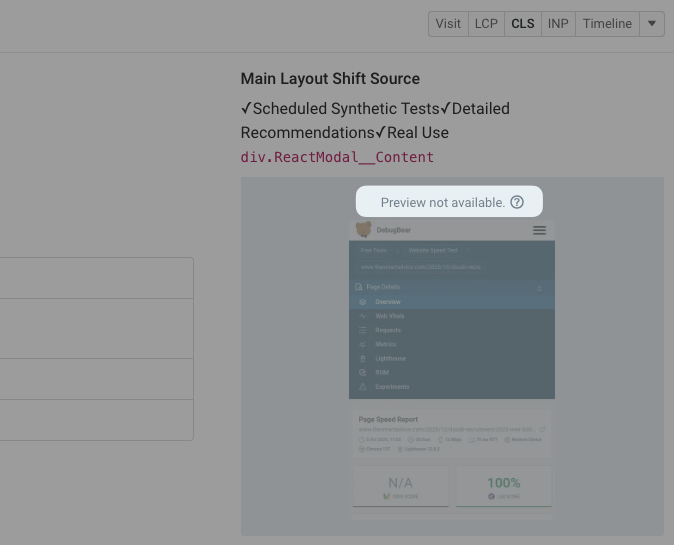
Page element breakdown
For metrics that are related to a specific page element we also provide a breakdown of what this page element is. This applies to the LCP, CLS and INP metrics.
For example, for the LCP metric you can see what piece of content is the largest content element. This can vary based on the device's size and initial scroll position when opening the page.
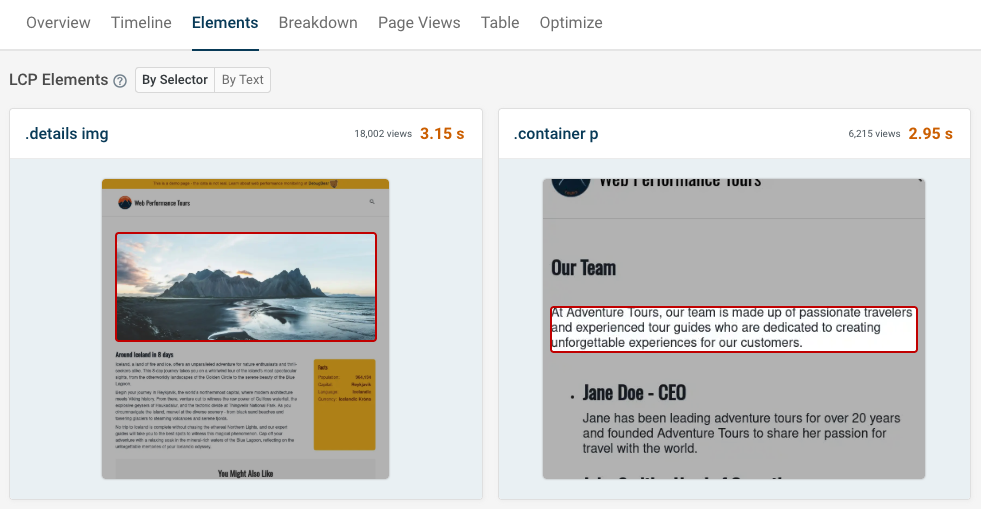
For Interaction to Next Paint, the element that the user clicked on or otherwise interacted with will be shown. When investigating CLS the element that moved around on the page is indicated.
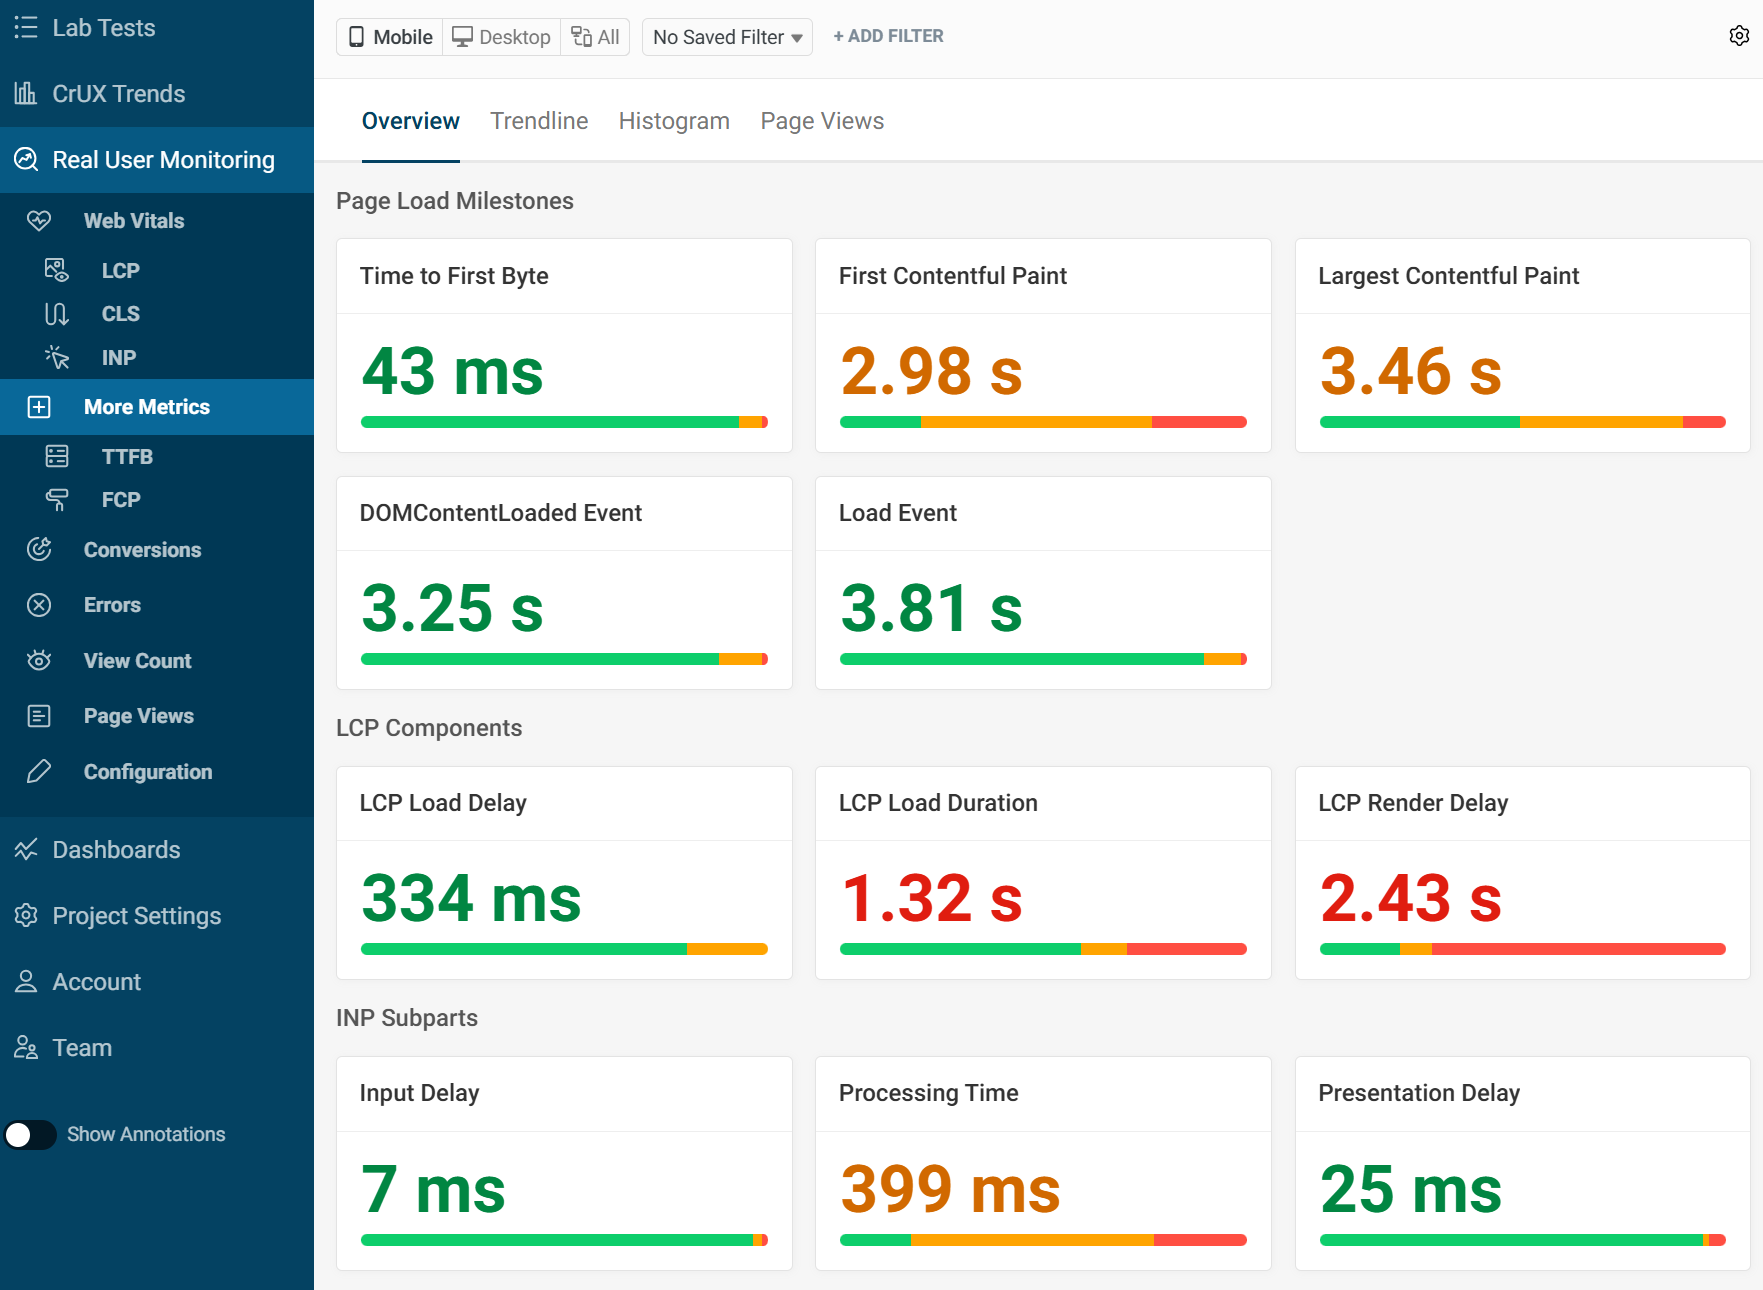
More
More metric specific dashboards can be found under the More tab. Options include Page Load Milestones, LCP sub-parts, INP components and TTFB components. When optimizing these metrics, looking at the individual parts can provide us an insight on where improvements can be made.
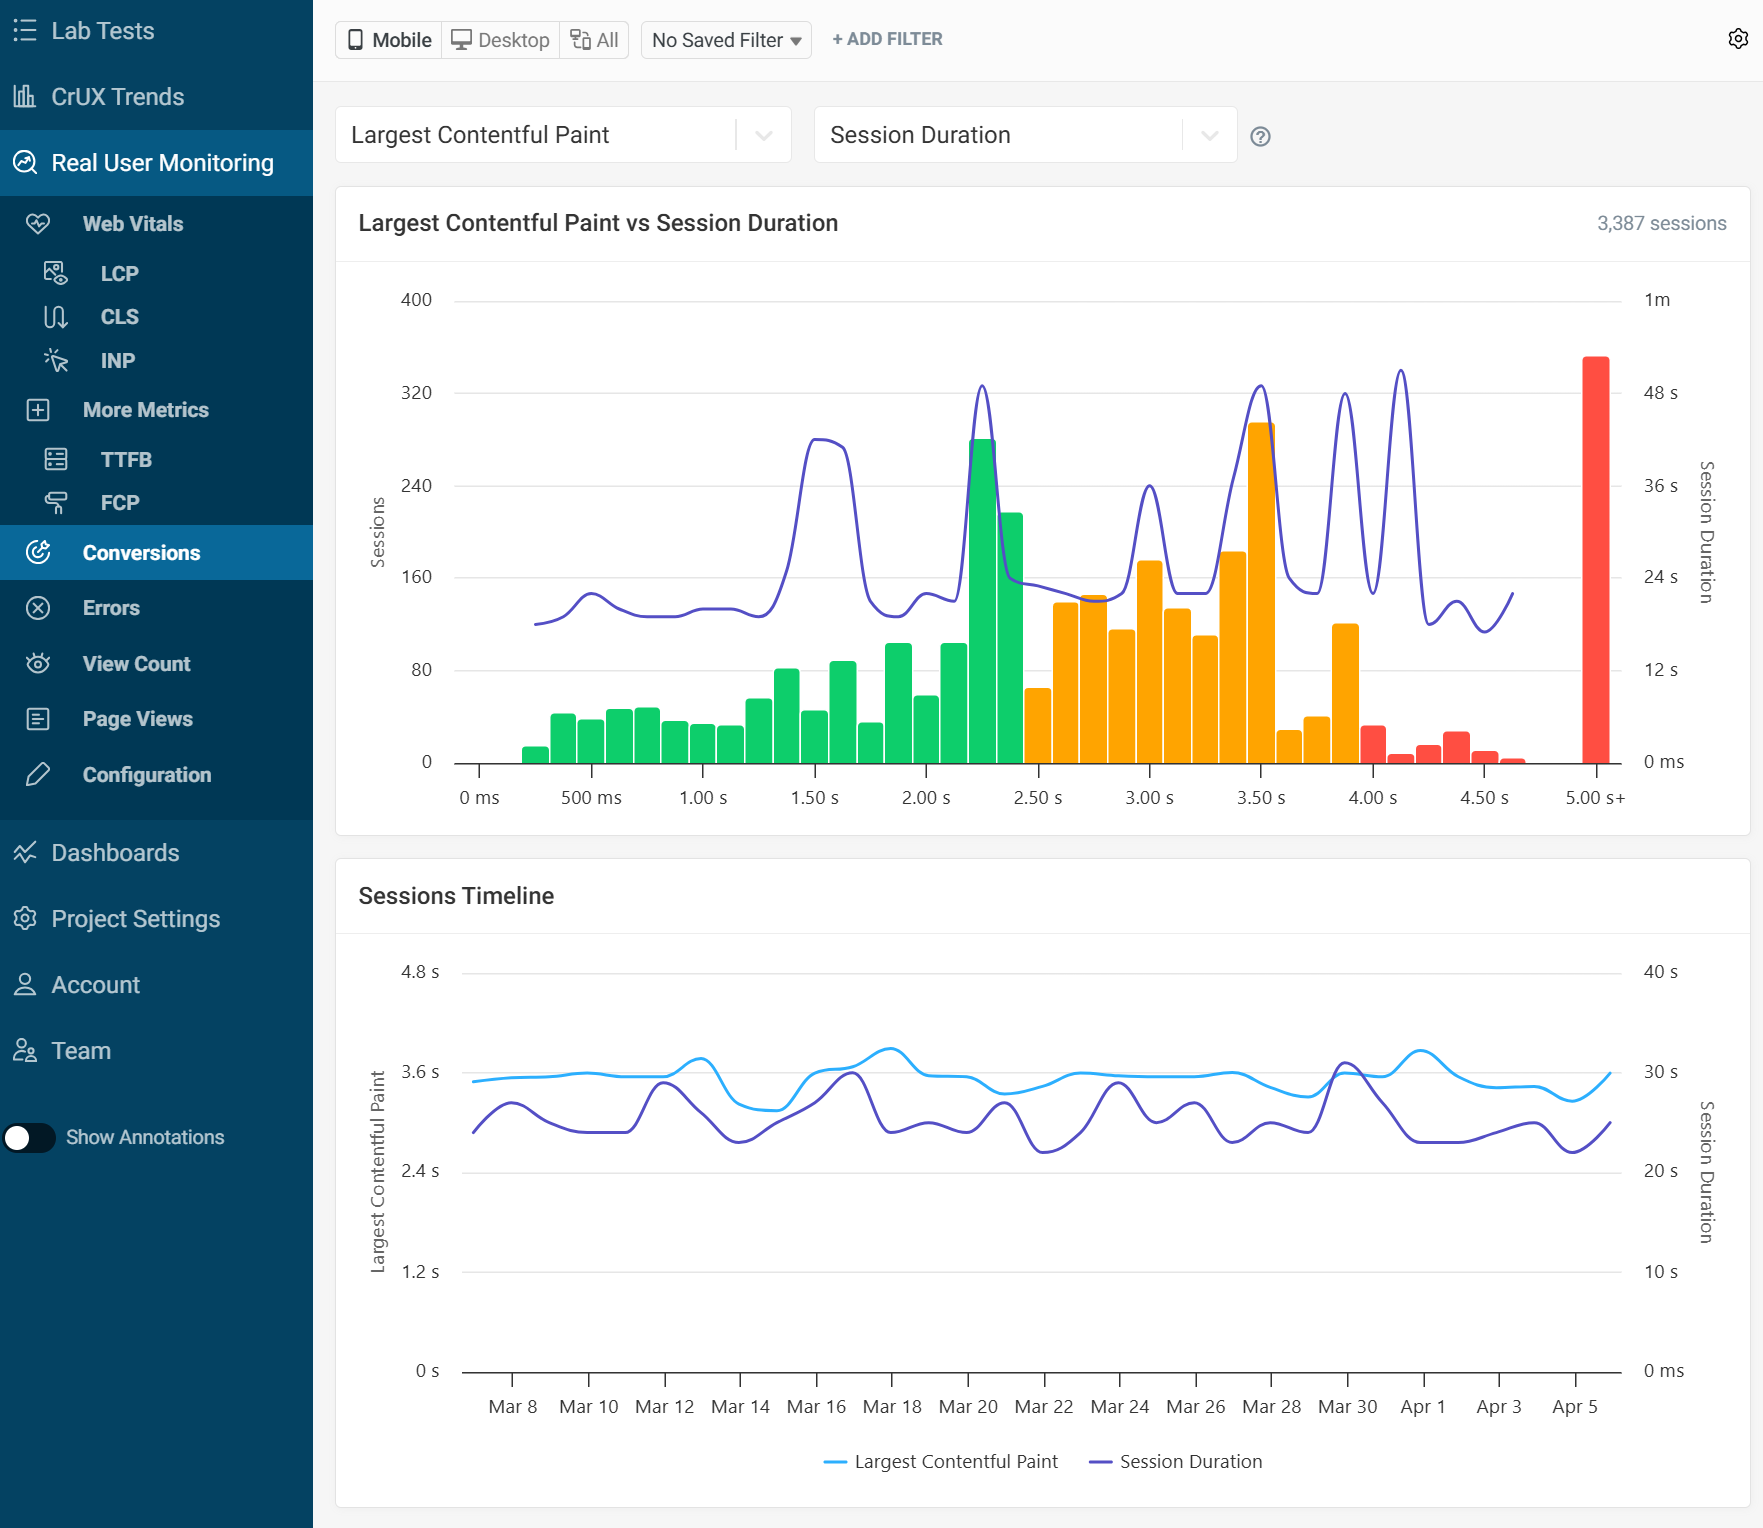
Conversions
The conversions dashboard has a number of useful histograms to help you understand how users are interacting with your website.
There are five metrics to choose from:
- Largest Contentful Paint
- Cumulative Layout Shift
- Interaction to Next Paint
- Time to First Byte
- First Contentful Paint
Each of these metrics can be compared against user engagement metrics:
- Session Duration: Total time a user spends in a session from start to end.
- Hard Navigation Count: Number of full page reloads during a session.
- Total Navigation Count: Total number of page transitions including soft navigations in a session.
- Bounce: Sessions where the user leaves after viewing only one page.
- Open Checkout: Number of sessions where users initiate the checkout process.
You can also set up custom conversions using the RUM Snippet API
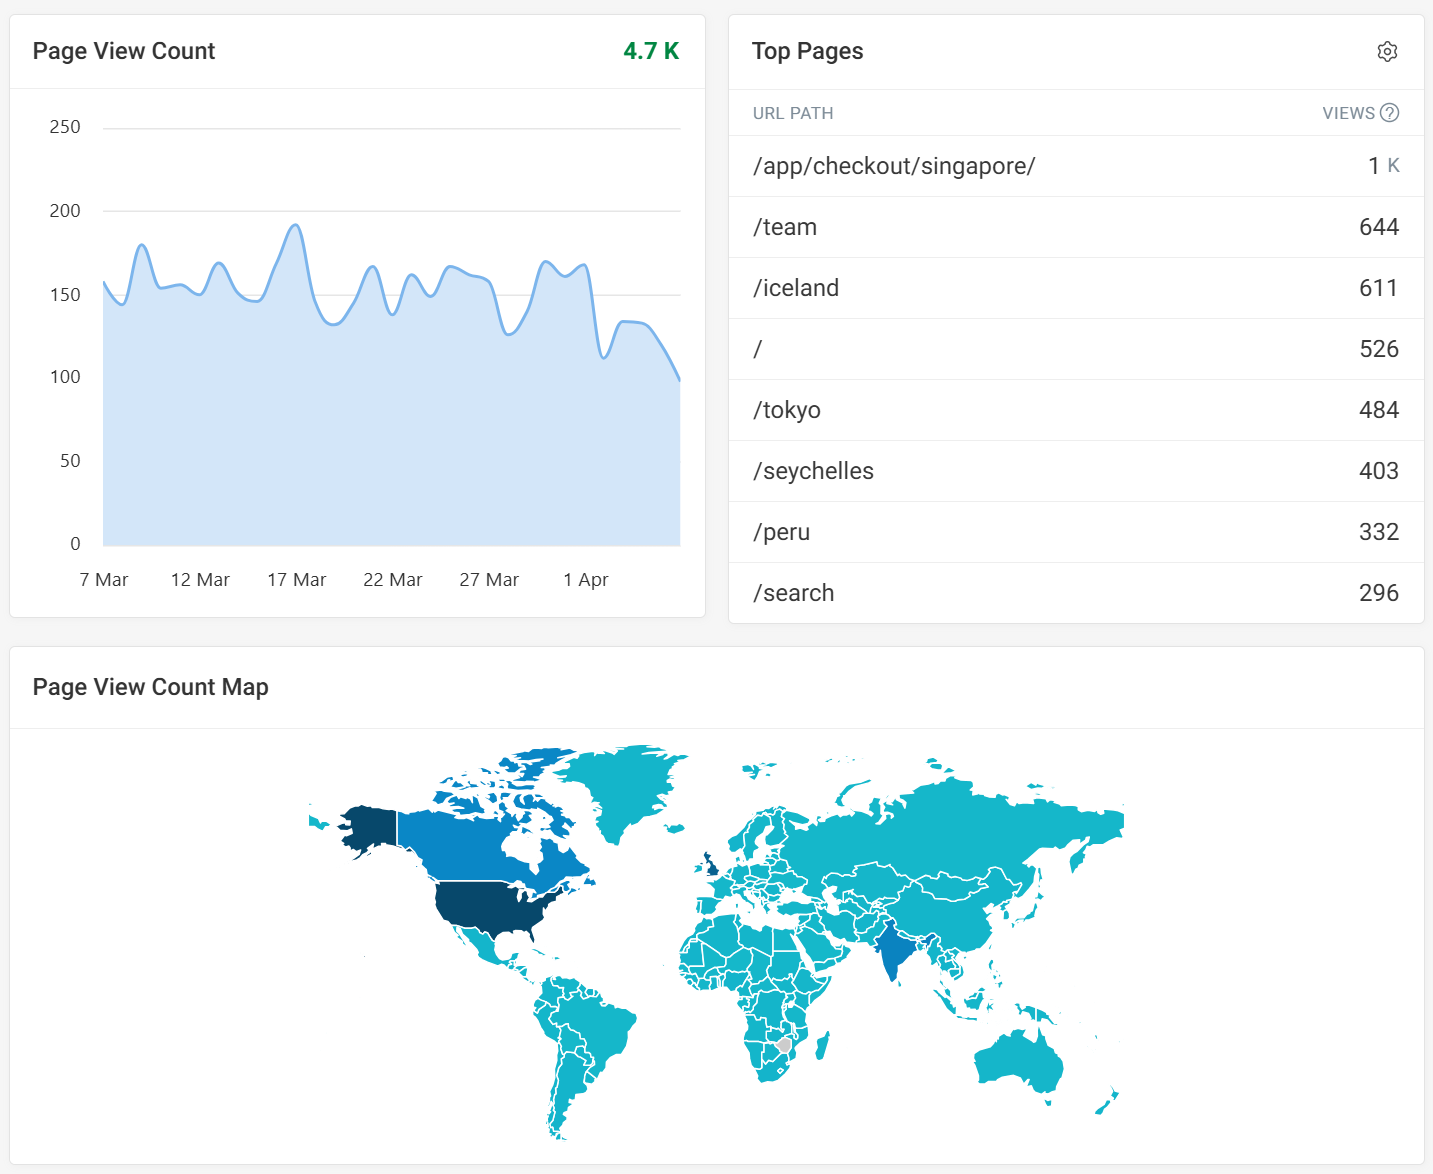
View Count
This tab shows a graph of total page views in the selected time period, with the top URL Path in a graph format.
There is also a map to visualize where most of your visitors are coming from. The more visits from a region, the darker blue it will become.
Visualizing Data
Screenshots are taken to help identify elements and visualize results. These are taken independently from RUM data collection.
In some cases a screenshot will not be displayed because it can not be found. This can sometimes happen when an element has been removed or only appears in specific countries such as a cookie banner.
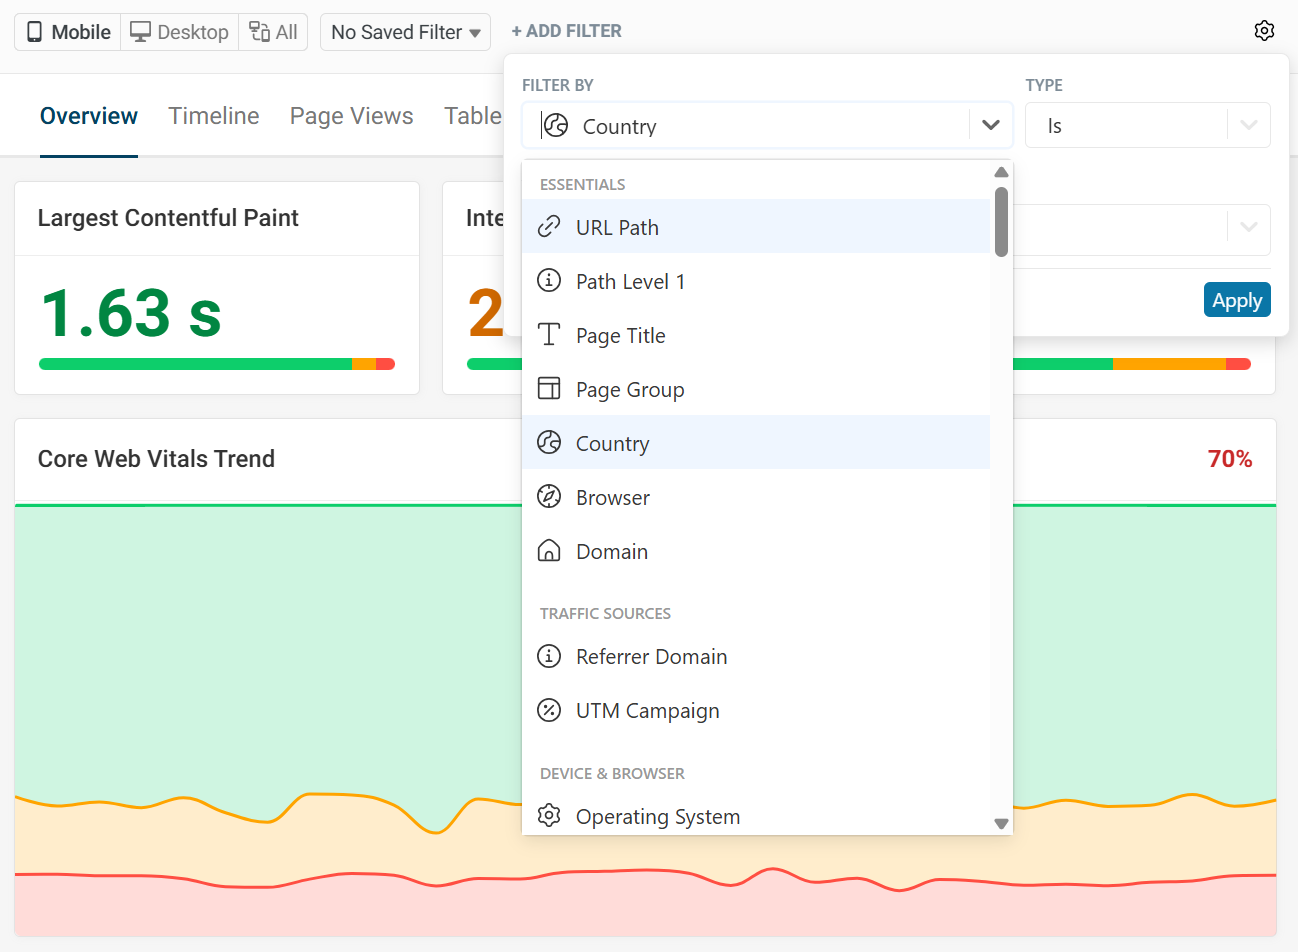
Filtering RUM Data
At the top of the dashboard you can select whether you want to see all data or only Desktop/Mobile data.
Clicking Add Filter allows you to narrow results by specific pages or visit conditions. Each filter can be set to include or exclude values as needed. Once applied, filters can be saved for future use as a Saved Filter.