Monitor End User Experience In The Browser

Collect real user page speed and Google Core Web Vitals data.

Understand what causes poor experience and fix issues on your website.

No card required. Get set up in minutes.
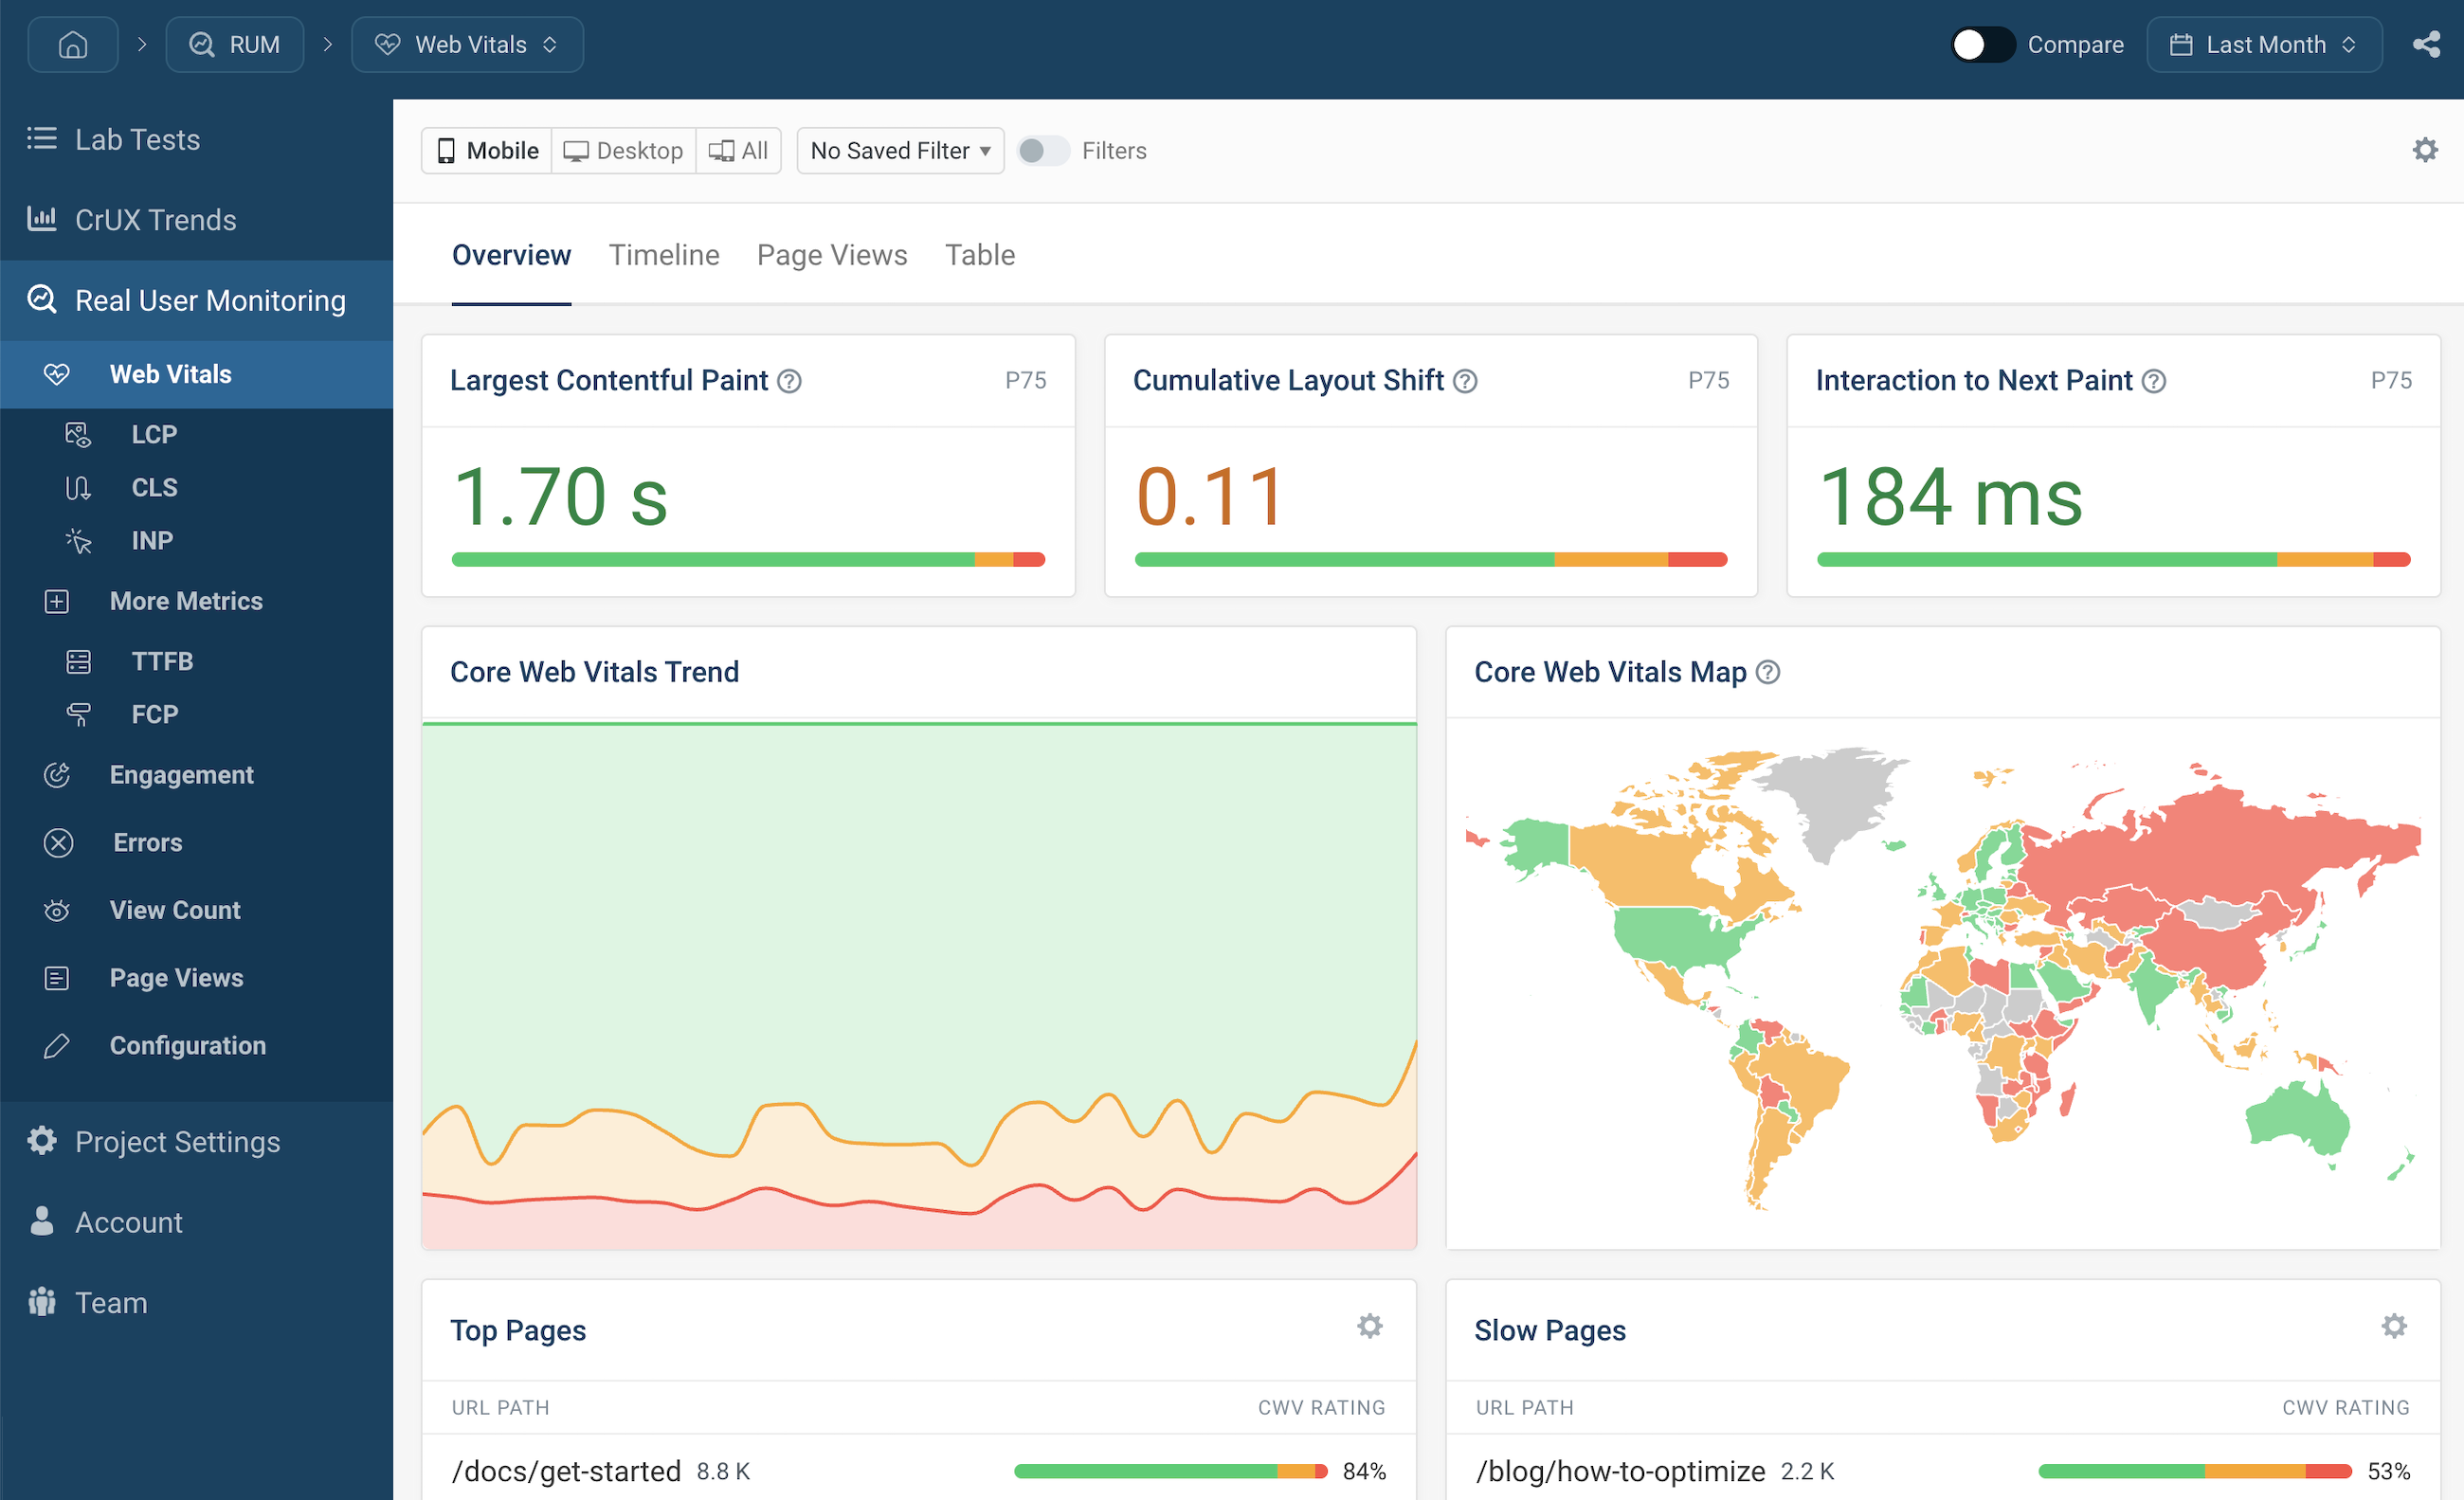
End user monitoring dashboard screenshot
”We've updated around 15,000 pages and saw some nice gains from it. "Good URLs" and their impressions have increased 3x since implementation.“
Web performance monitoring user profile picture
Rafayel Begoyan
Senior SEO Specialist at CoinStats
”We love DebugBear. It has proven useful time and time again. I evaluated the different competitors and DebugBear was the best overall product.“
Web peformance monitoring user profile picture
Rafael Corral
Senior Software Engineer
Join Hundreds Of Happy Customers
DebugBear Customers

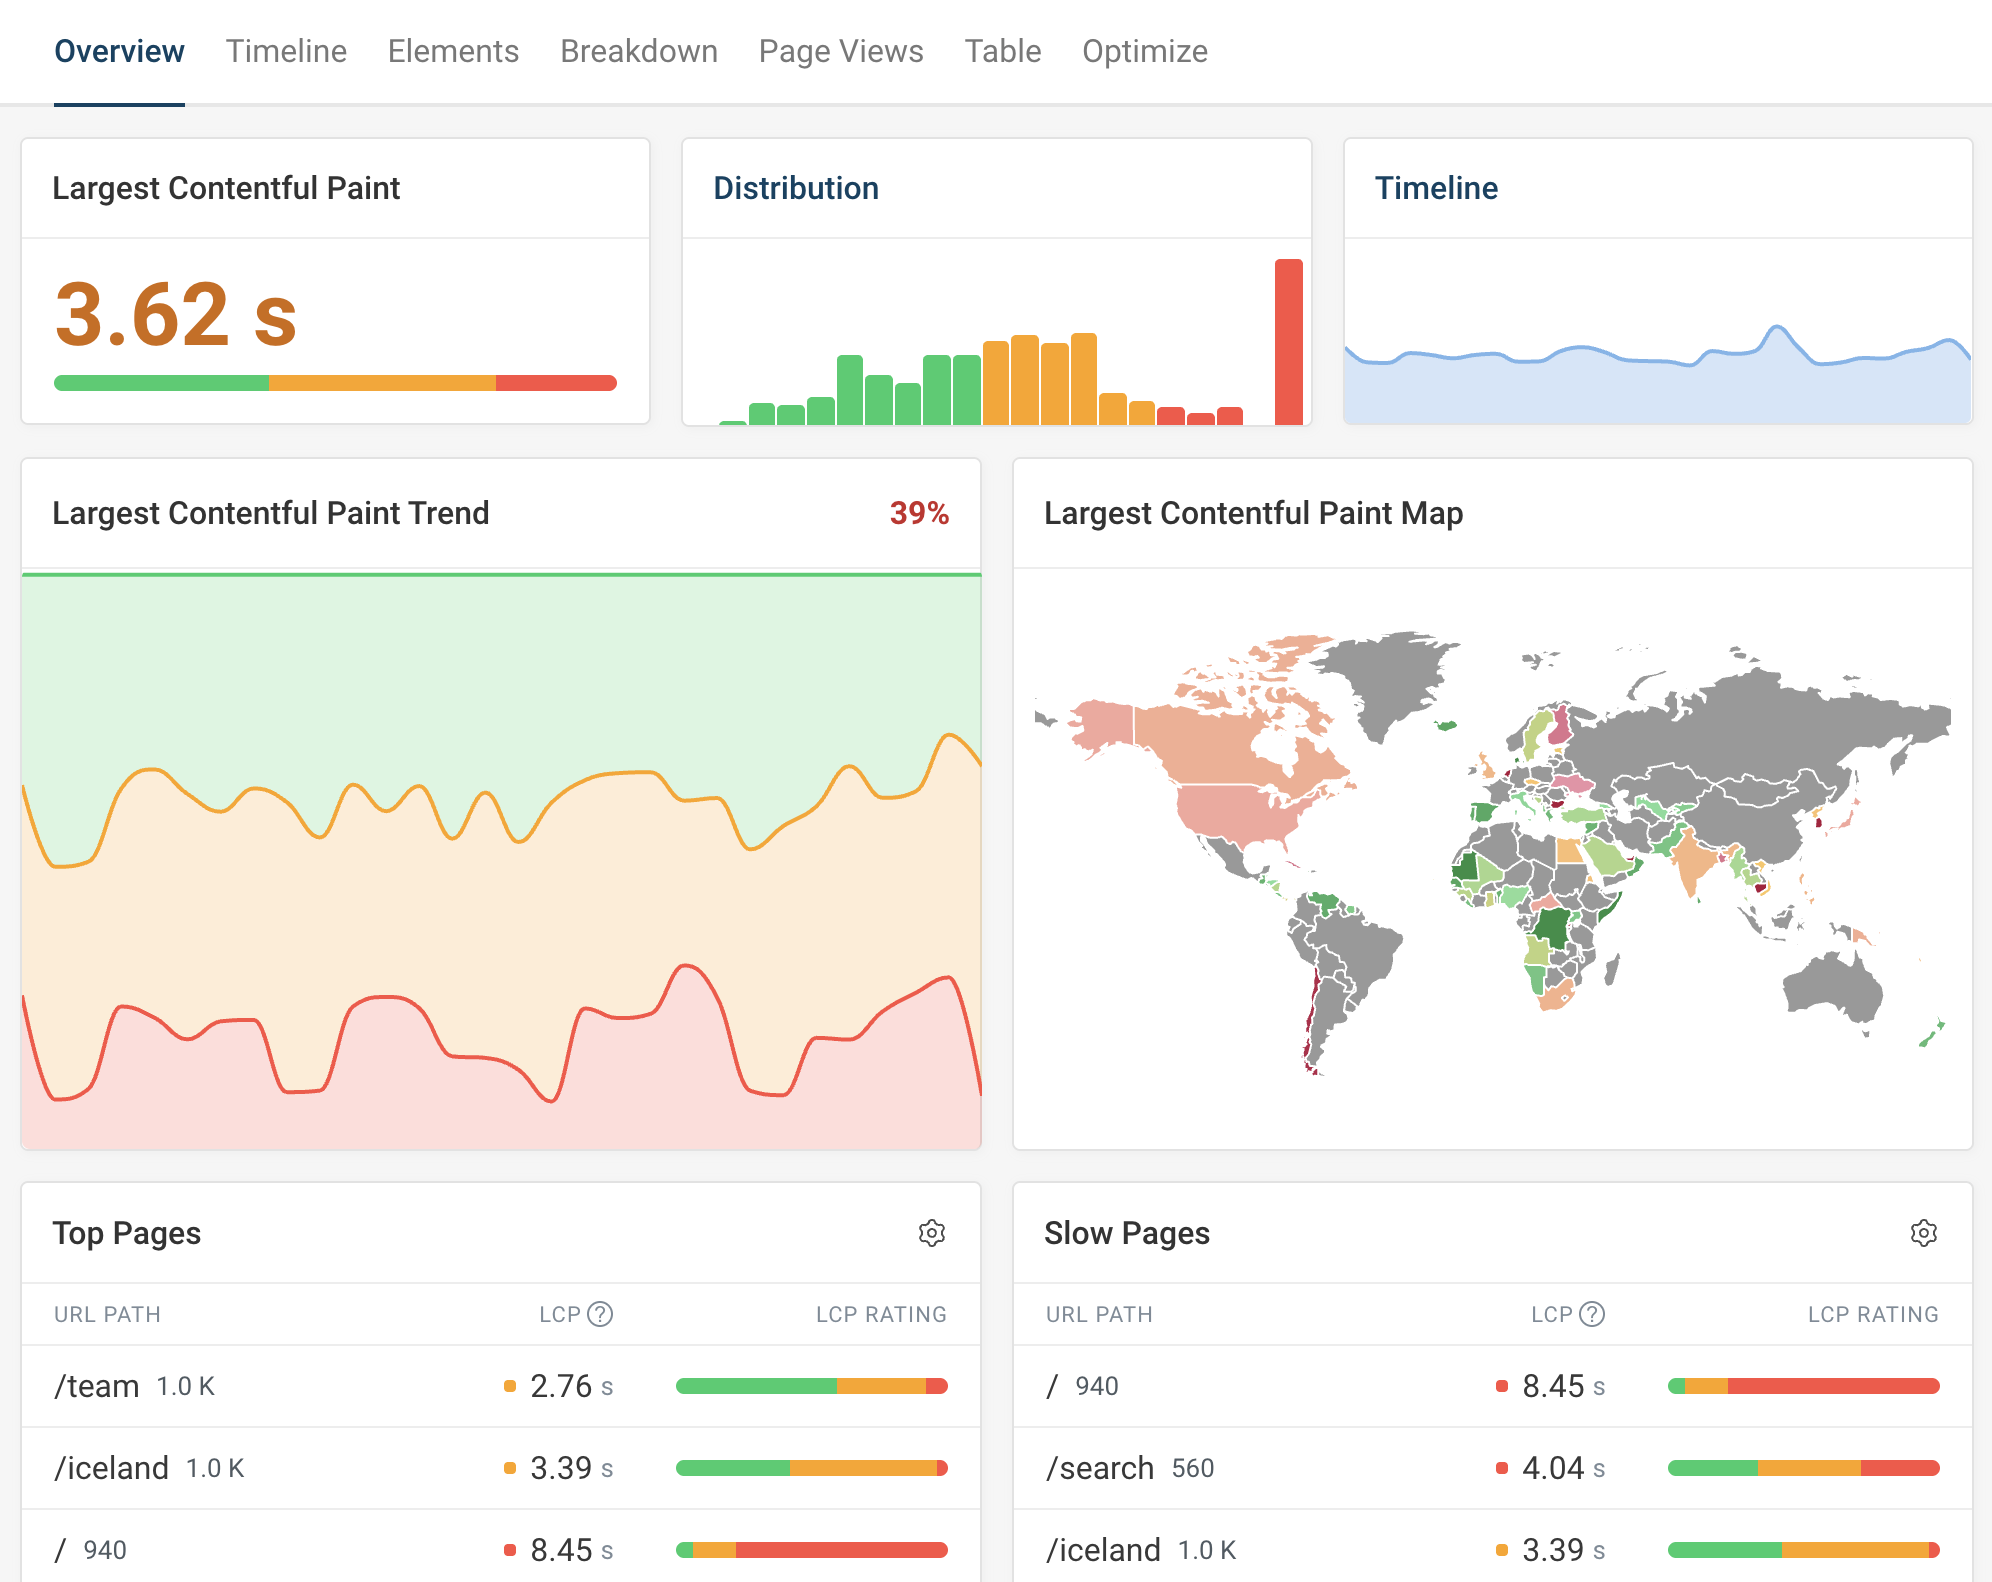
Real user monitoring in the browser

Measure end user experience

Measure Google Core Web Vitals and other page speed metrics for you end users.

Identify slow experiences

Find slow or unresponsive pages on your website and review individual user experiences.

Understand and improve web performance

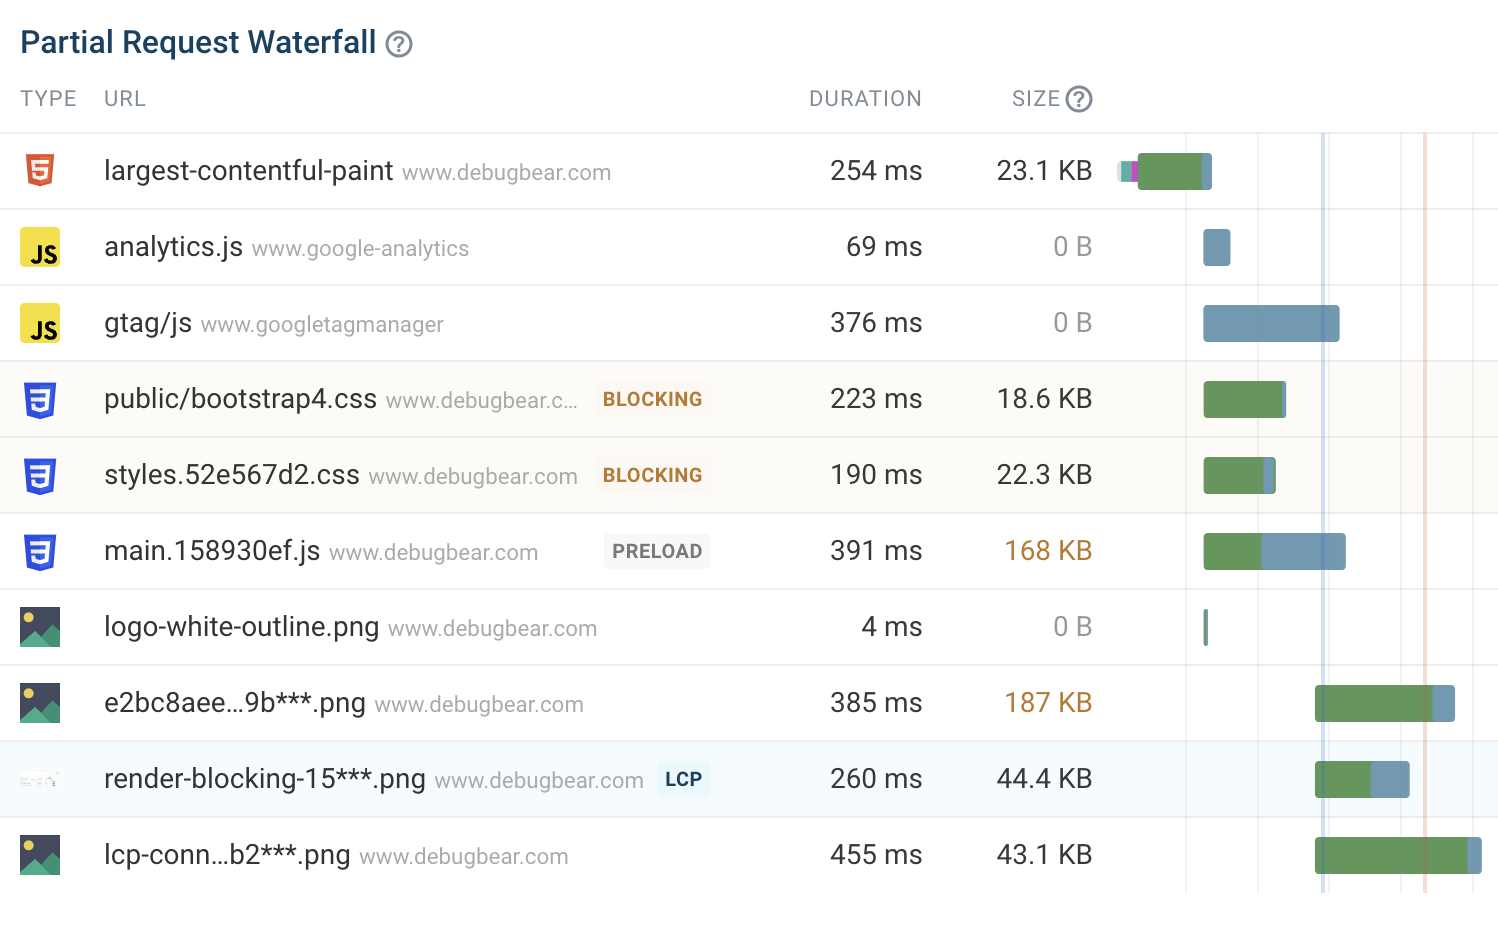
Identify slow LCP elements and UI components causing slow interactions. Use a request waterfall and long animation frames reporting to debug issues.

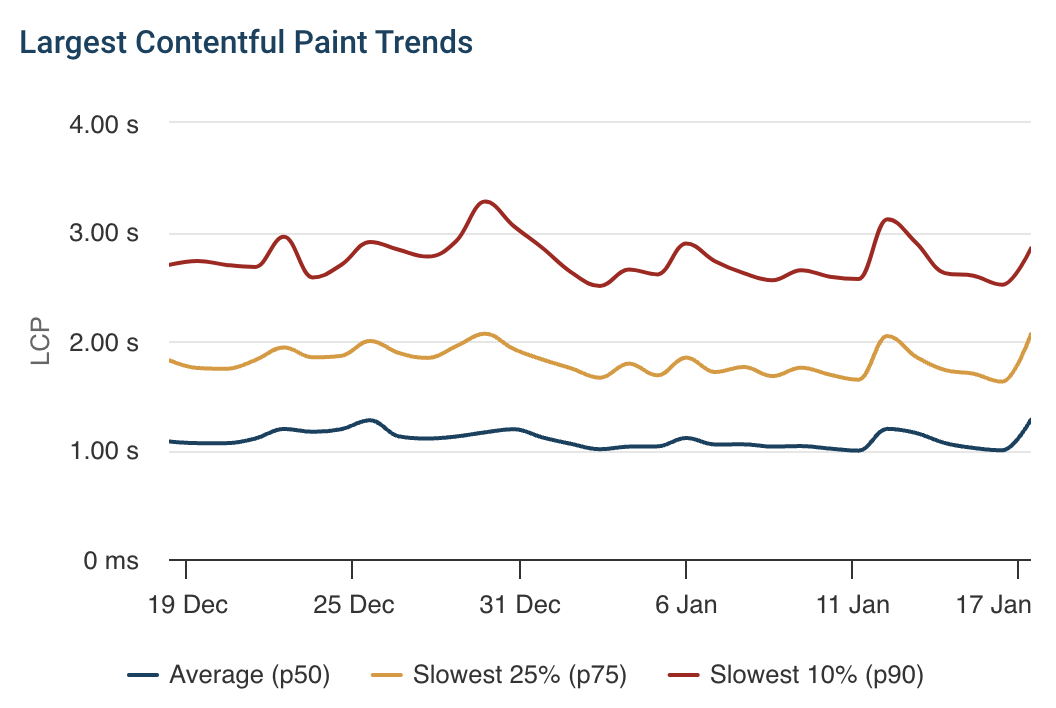
Largest Contentful Paint Chart showing the 50th, 75th, and 90th percentiles

RUM browser monitoring

Get detailed insight into end user experience

DebugBear provides high-level reporting into your Core Web Vitals and lets you review and optimize individual page views.

Easy to set up

Simply install an analytics snippet on your website to start collecting data.

Core Web Vitals trend chart

Core Web Vitals Insight

Detailed reporting

Get detailed breakdowns to help you prioritize the optimizations that will have the biggest impact on the largest number of customers.

Learn more about your users

See details about device performance, screen size, and estimated network speed.

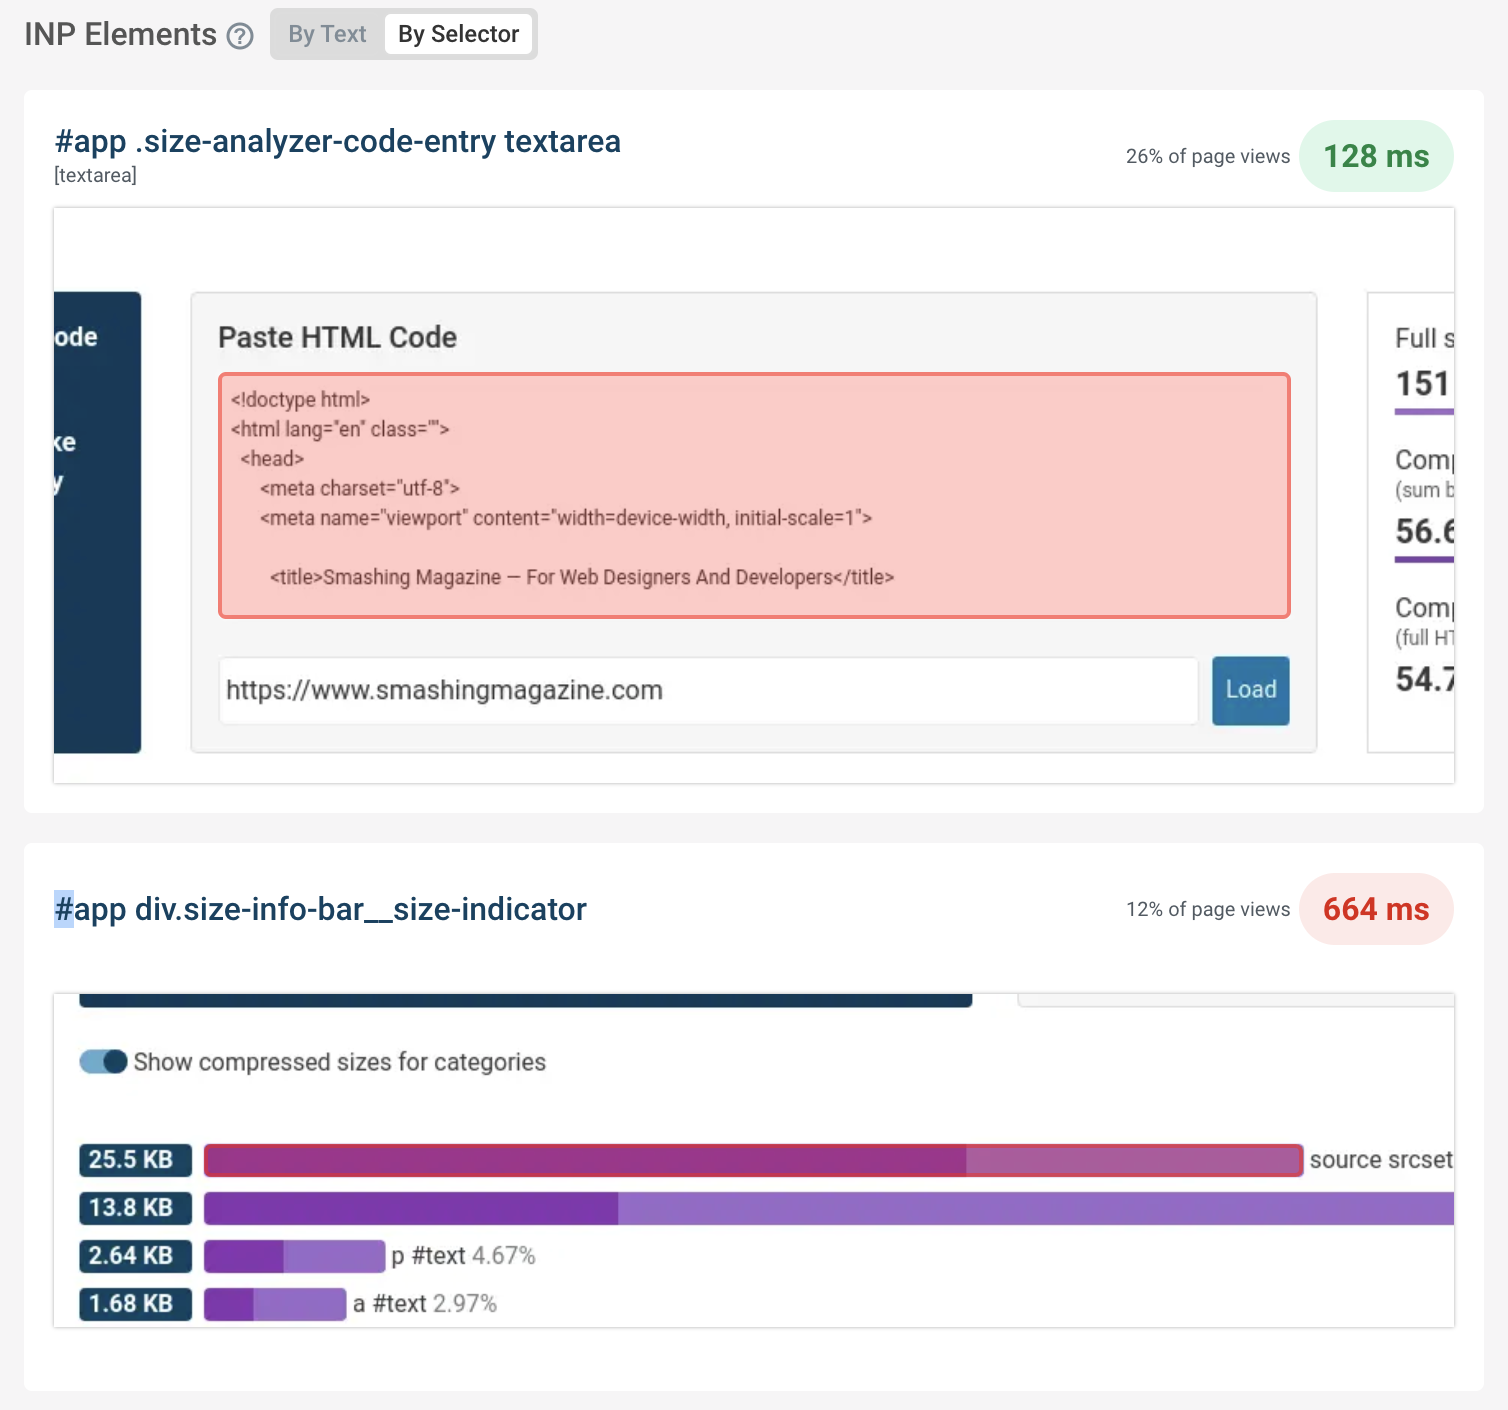
INP element breakdown for Core Web Vitals optimization

Gain insight beyond real user monitoring
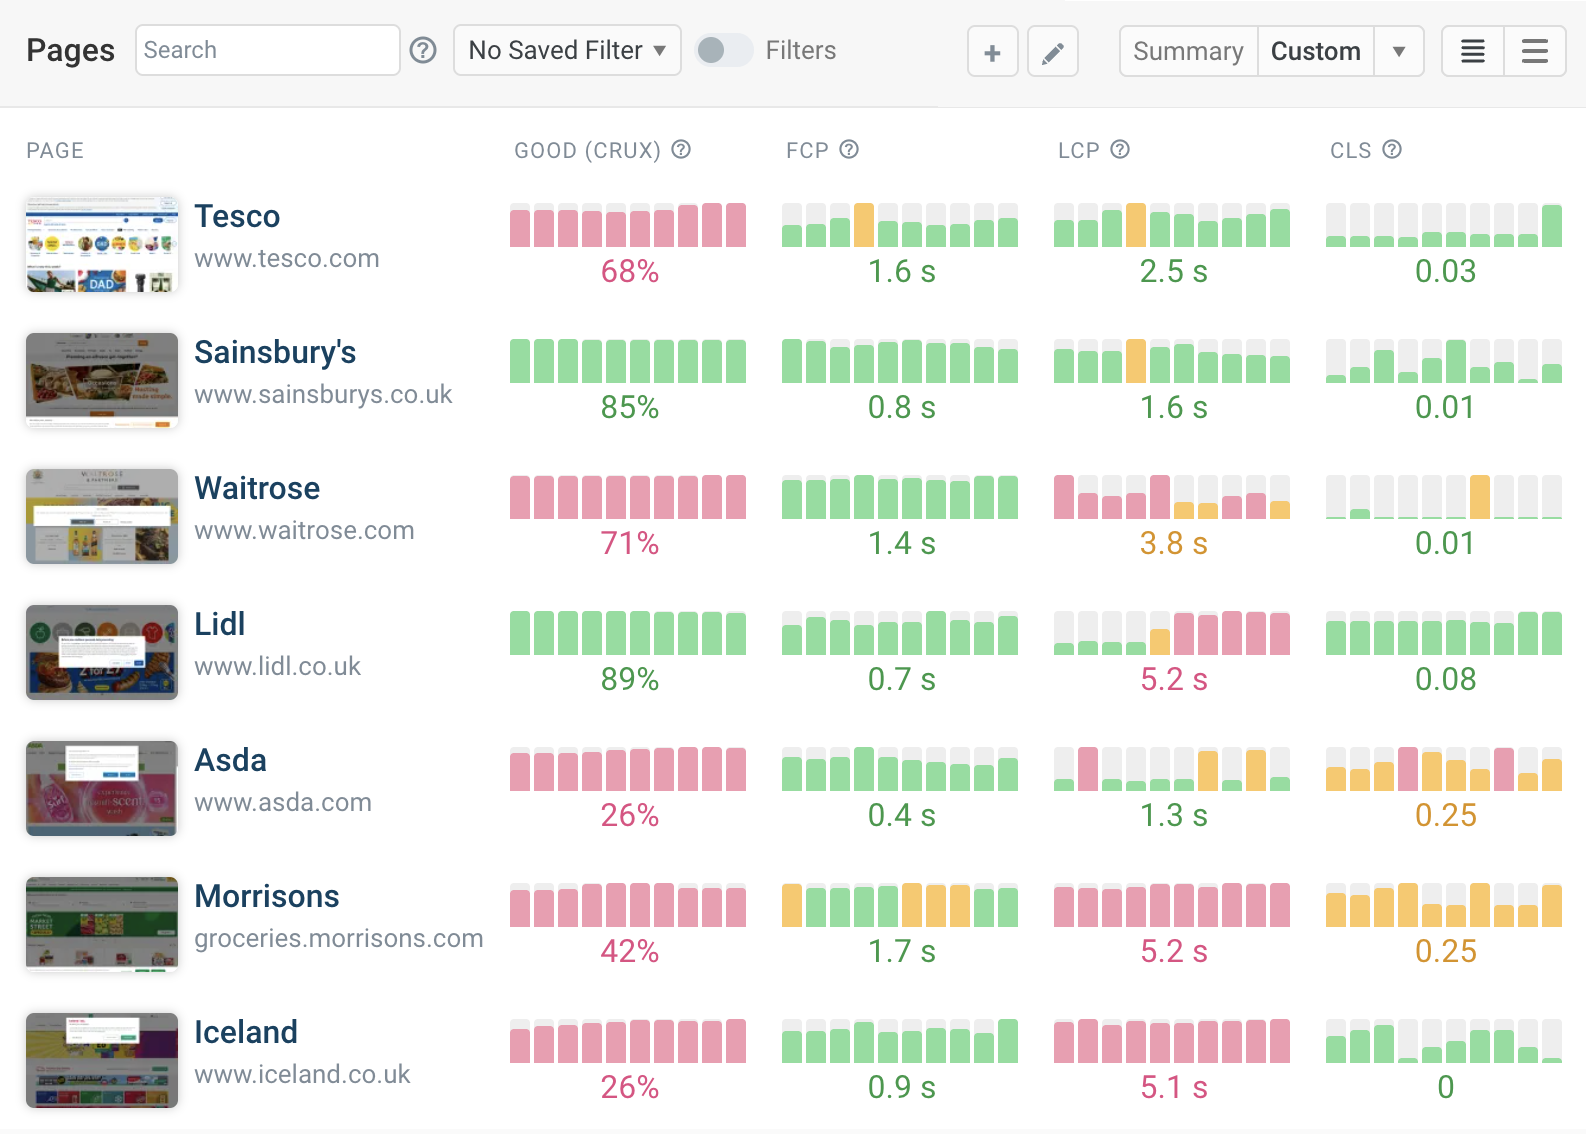
Run lab-based tests

DebugBear can also run scheduled synthetic tests based on Google's Lighthouse tool. Track page speed, accessibility, and SEO.

Chrome User Experience Report data

Track the Chrome User Experience Report (CrUX) data that impacts search result rankings.

Core Web Vitals trend chart
”DebugBear delivers the best stats for before and after changes in exquisite detail. It also shows clear and easy to find data for Google's Web Vitals.
Web peformance monitoring user profile picture
Tony Cosentino
Owner at The WP Guy
”The reporting data is very helpful in pinpointing what causes site speed issues – immediately actionable. It's well above and beyond the info you get from Lighthouse and the performance tests through Chrome.“
Web peformance monitoring user profile picture
Loren McDonald
IT Director
The most actionable-info packed page speed visualization available. DebugBear provides unique features that are crucial to debugging complex issues, like request-chain visualization."
Web performance testimonial photo
Robin Marx
Web Protocol and Performance Expert
”DebugBear's alerts are our early warning system. They catch new scripts that could slow us down before they become a problem.”
Web peformance monitoring user profile picture
Ryan Sullivan
Chief of Staff at SiteCare

Get set up in minutes.

No credit card required.
Start free 14-day trial

You are using an old browser that is not supported anymore. You can continue using the site, but some things might not work as expected.