We've been working on improving our alerting functionality as well as providing better data for RUM sessions and synthetic network statistics.
Advanced RUM alerts
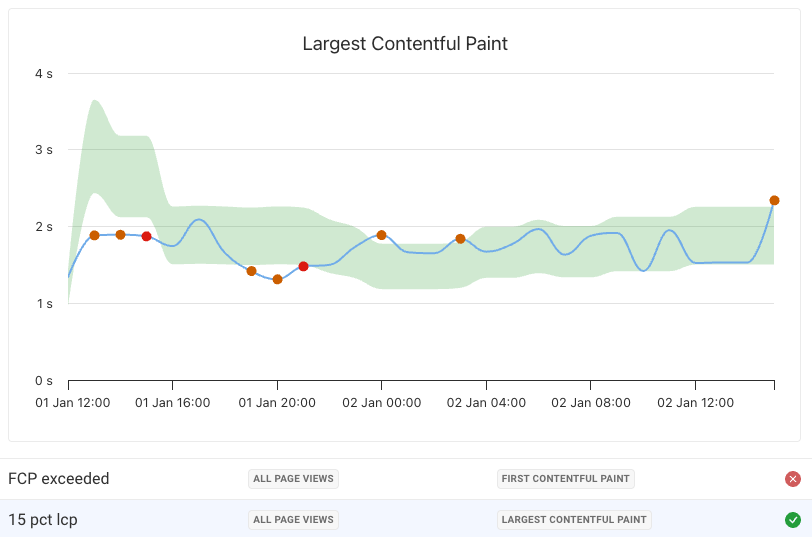
You can now set up RUM budgets that only trigger after being breached several times in a row.
We've also added a new dashboard that shows the state of each budget!
Updated synthetic alert notifications
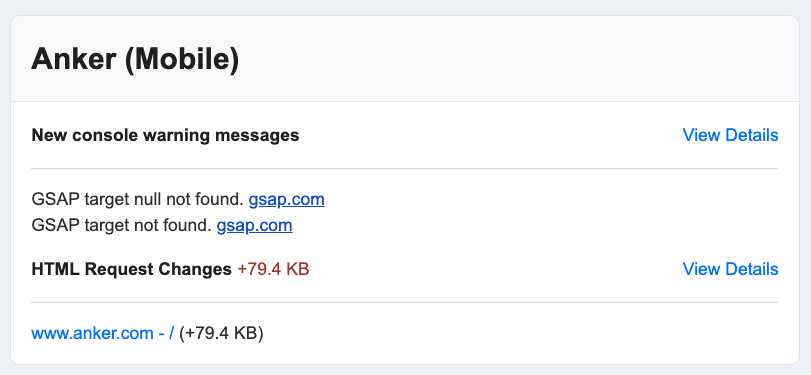
We've also improved our synthetic alert messages. The email design is tidier, and each alert has its own "View Details" link that takes you directly to the relevant data you need to debug the issue.
View statistics on network requests
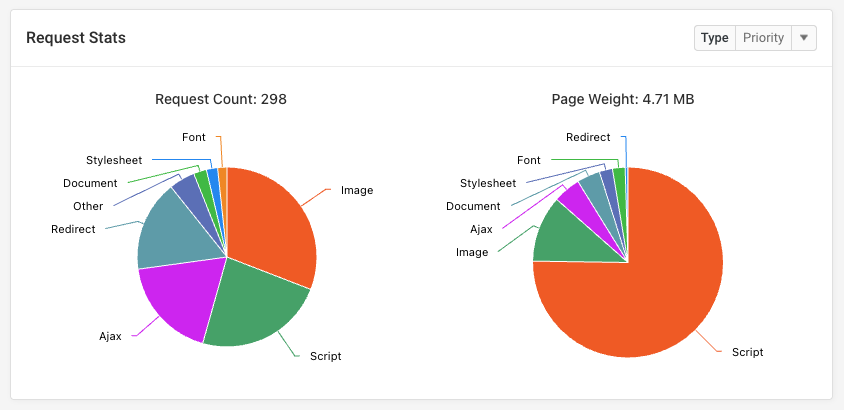
In synthetic tests, you can now easily see how many requests there are for each resource type, and how much different resource types contribute to overall page size.
Instead of grouping by resource type you can also group by other dimensions, like domain or response status code.
RUM session data: track session duration and navigation count
On top of tracking custom conversions you can now also correlate page speed with session duration and the number of navigations per session.
We've also added a new chart that shows conversion rates and session durations over time.

New videos
- How Does Chrome DevTools Network Throttling Actually Work? – Learn how the implementation details of DevTools throttling impact performance scores.
- Apply fetchpriority=High To Optimize LCP Request Discovery – Speed up your Largest Contentful Paint by marking key resources as high priority.
New articles
- Firefox And Safari Now Support Two Core Web Vitals Metrics – The latest versions of Firefox and Safari now support Largest Contentful Paint and Interaction to Next Paint.
- 2025 In Review: What’s New In Web Performance? – A look at new browser features and tools to help you measure and improve web performance.
- How We Made DebugBear Better In 2025 – Catch up on some of the biggest improvements we rolled out last year.