Explore our new features that help you identify LCP-slowing scripts, identify over-budget pages, and see your average performance. Plus all our latest guides, videos and case studies!
Find the CPU tasks delaying LCP for your real users
We've launched a useful new feature in our real user monitoring toolkit: the ability to identify the long CPU tasks that delay your Largest Contentful Paint.
We use the Long Animation Frames API to collect CPU task data from real visitors to help you identify any scripts slowing down your page load.
Each tracked page view now highlights the longest CPU tasks that occurred before the LCP:
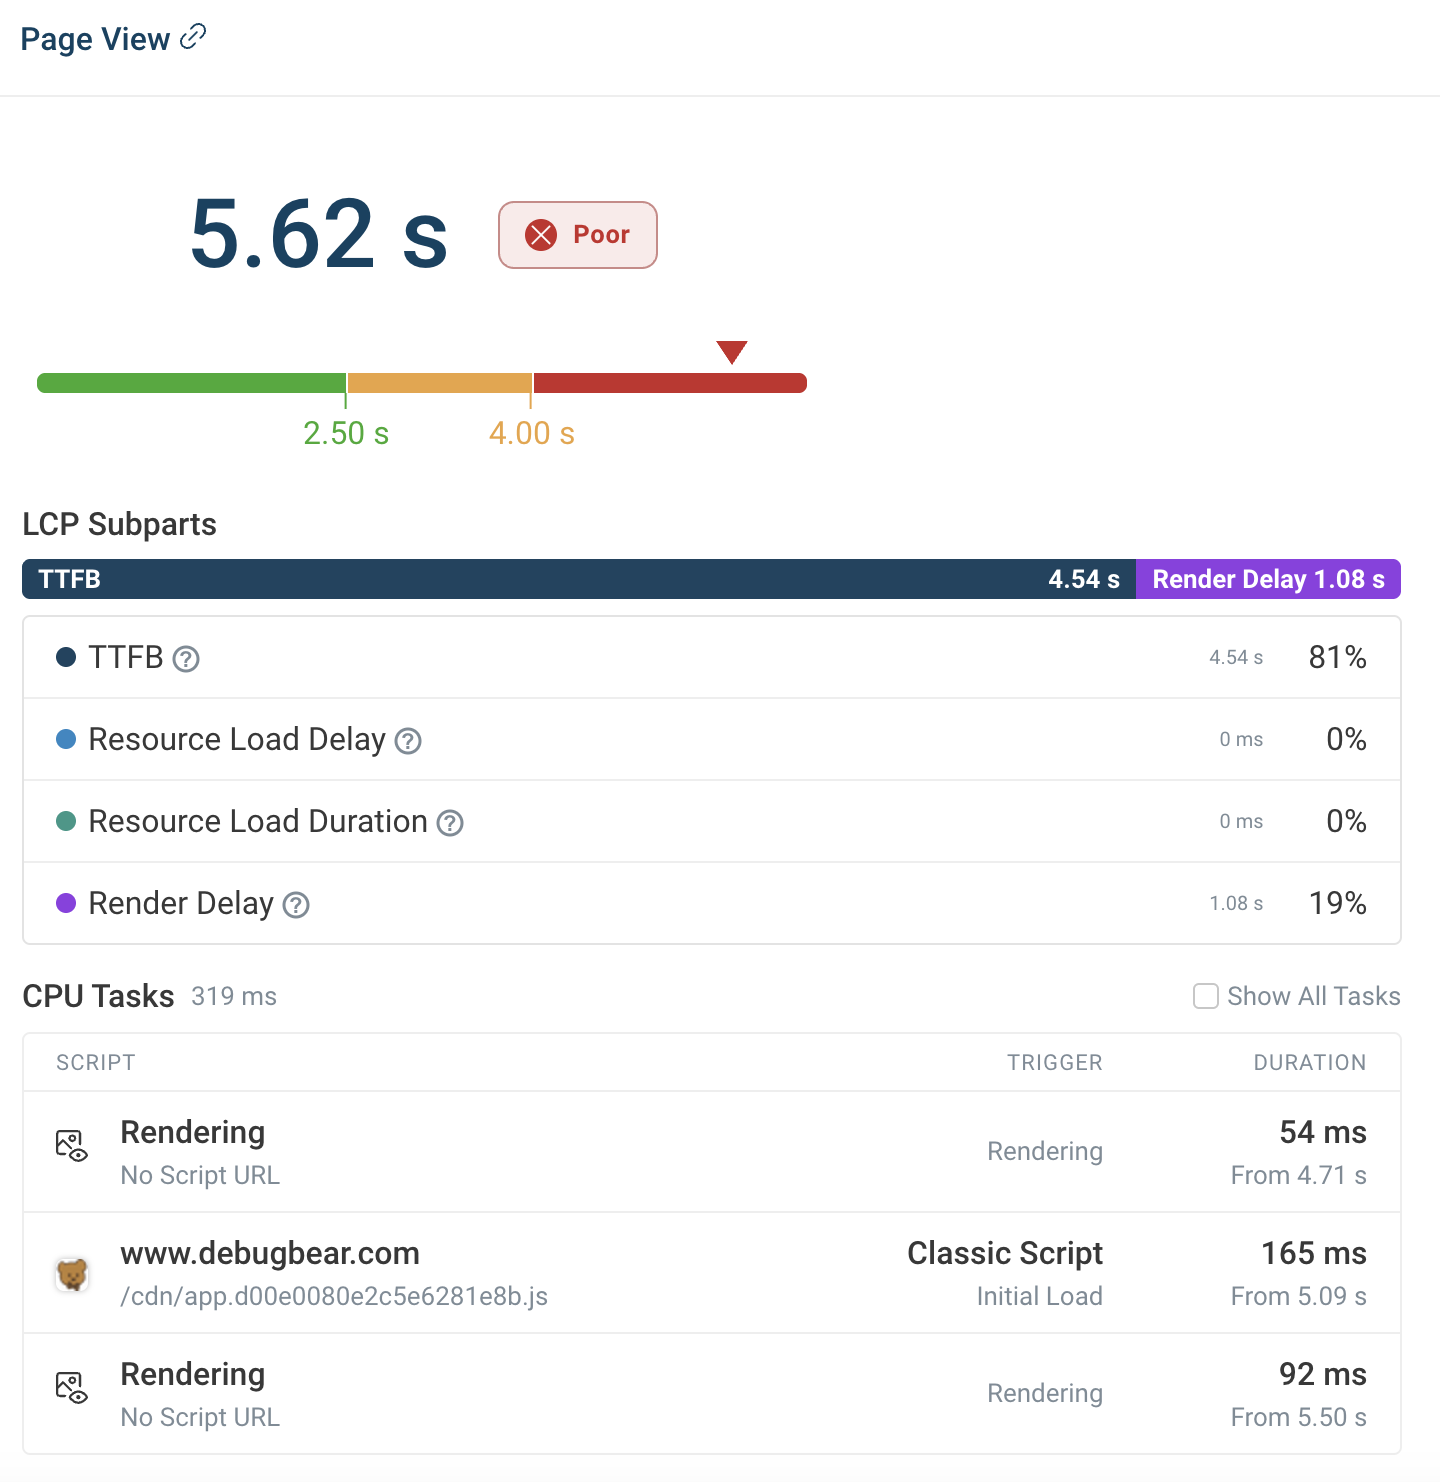
Your next step? Learn more in our documentation, to help you make the most of this extra data: How To Track Long Main Thread CPU Tasks With RUM.
Check your performance in the new budgets tab
You can now view the overall status of all budgets in the lab test Budgets dashboard. You'll find it in the left sidebar under Lab Tests.
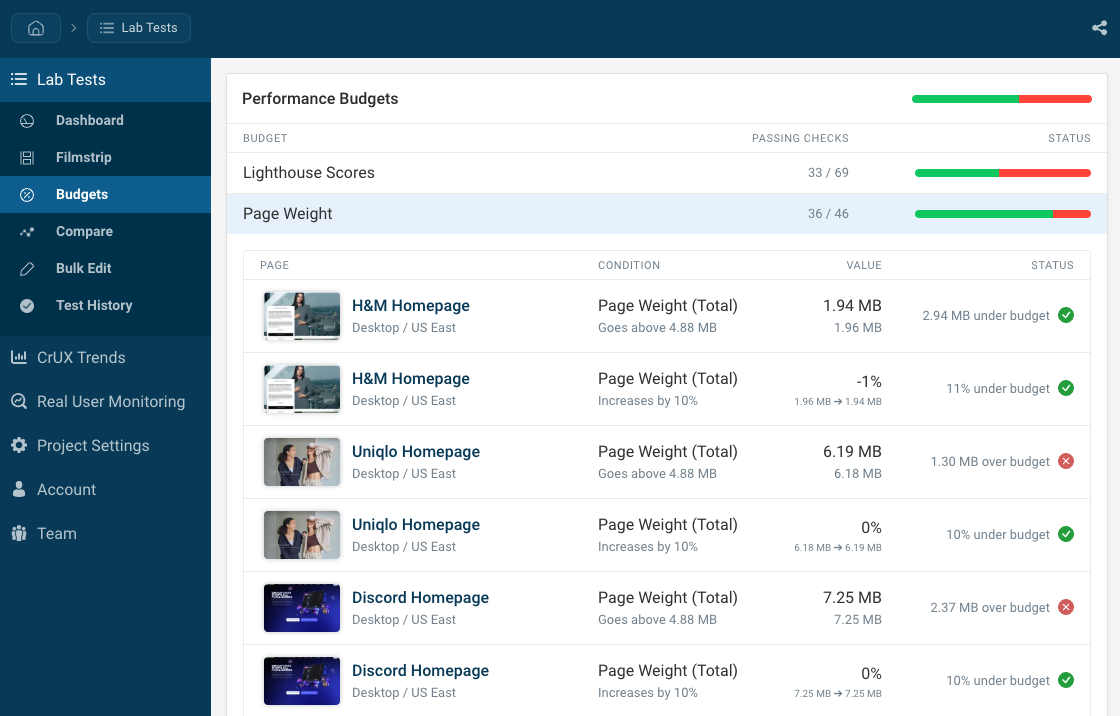
The dashboard also lists all individual budget checks, by looking at each page that the budgets applies to and finding all applicable budget conditions.
See your average performance across recent tests
In dashboard views, you can now display the average metric over recent tests, instead of the most recent result. (The 'Average' row will also update to show the average of these time-period averages across all pages.) Change this setting using the gear icon in the top-right.
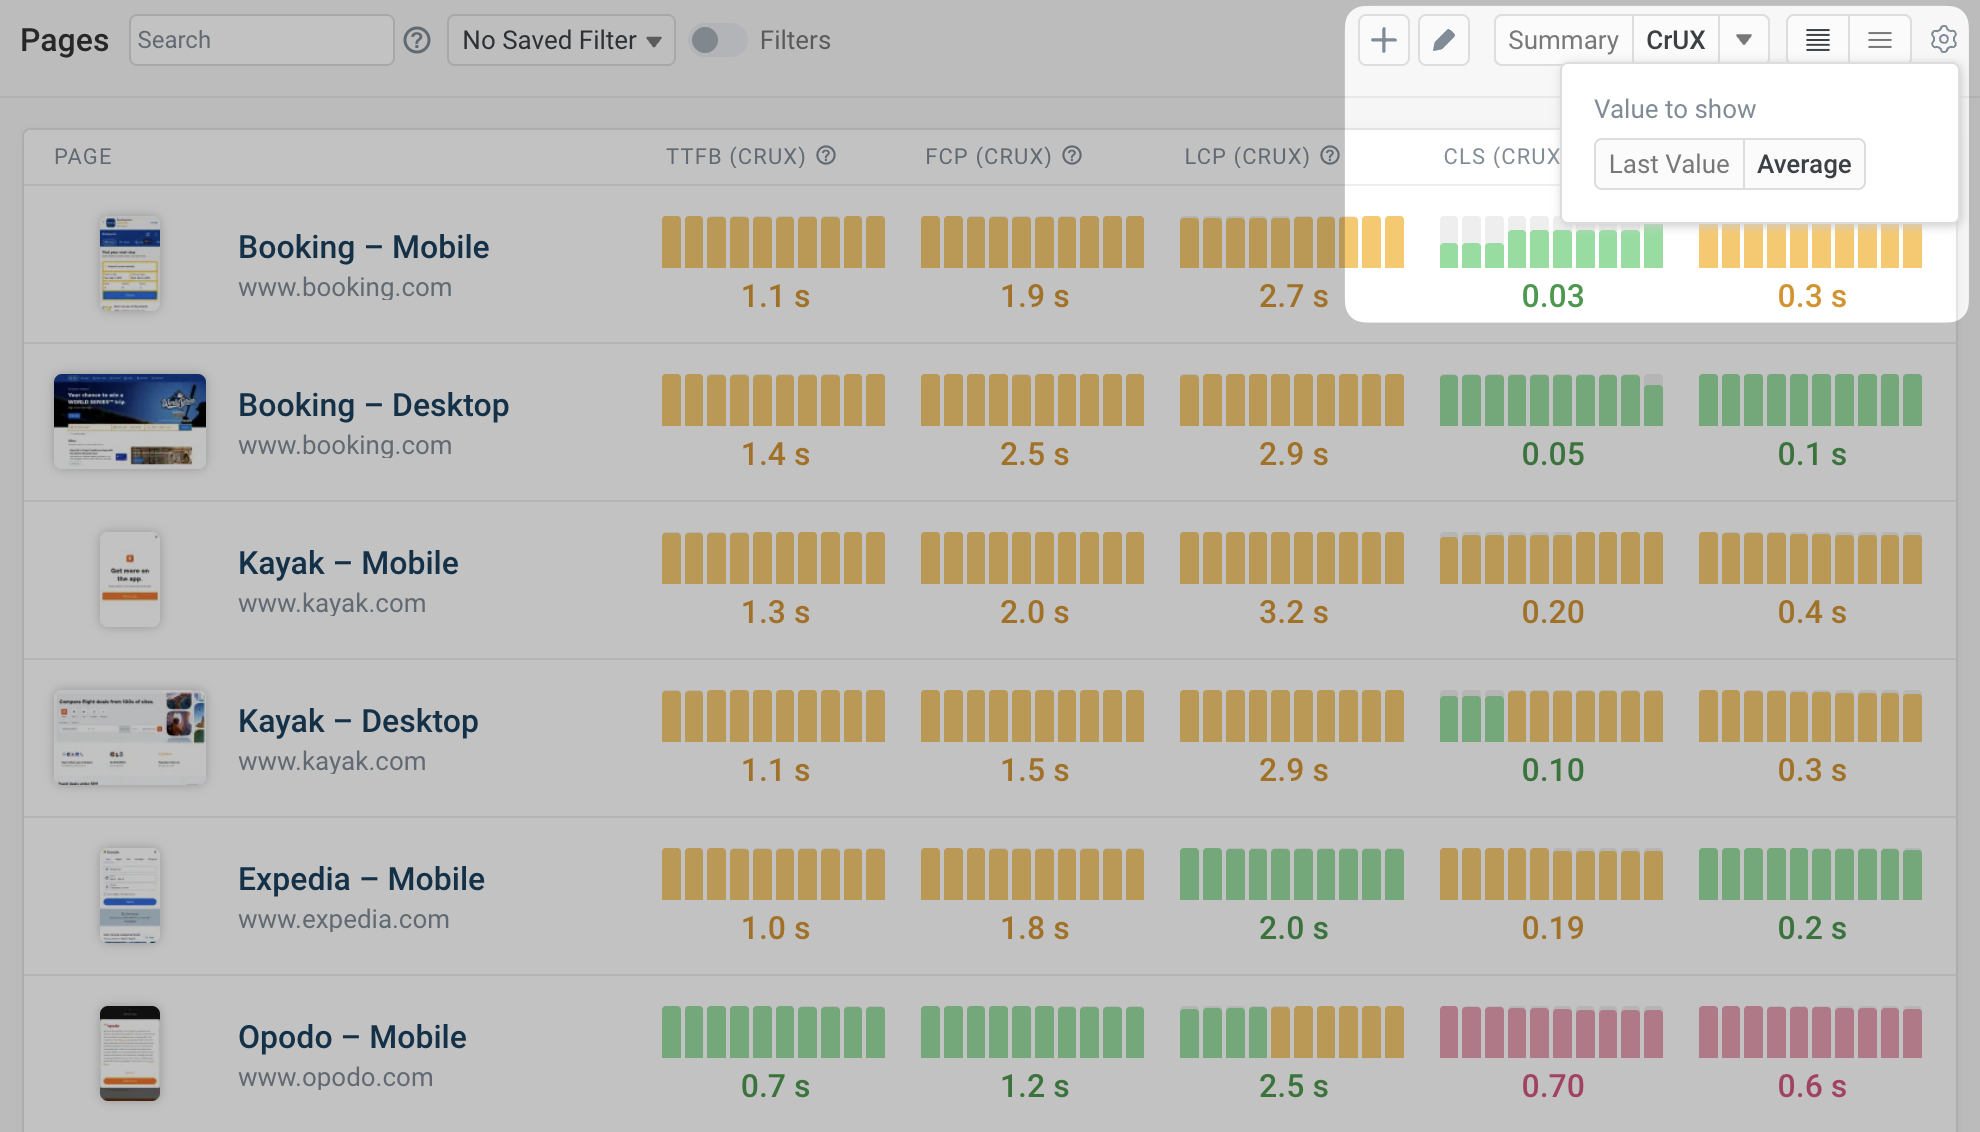
Average scores provide a better impression of your pages' typical performance over time, if your test results are proving inconsistent.
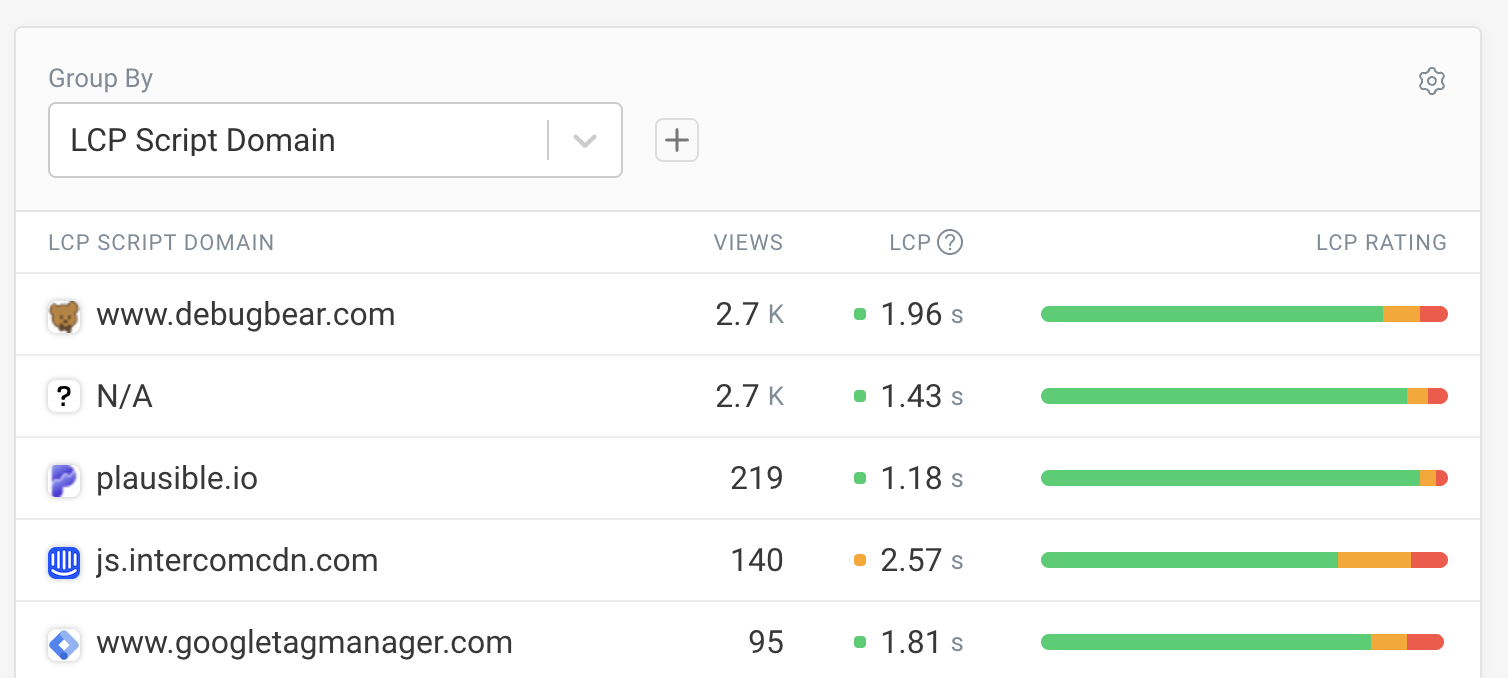
Favicons for scripts
Scripts listed in INP views are now illustrated with the favicon of their original domain.
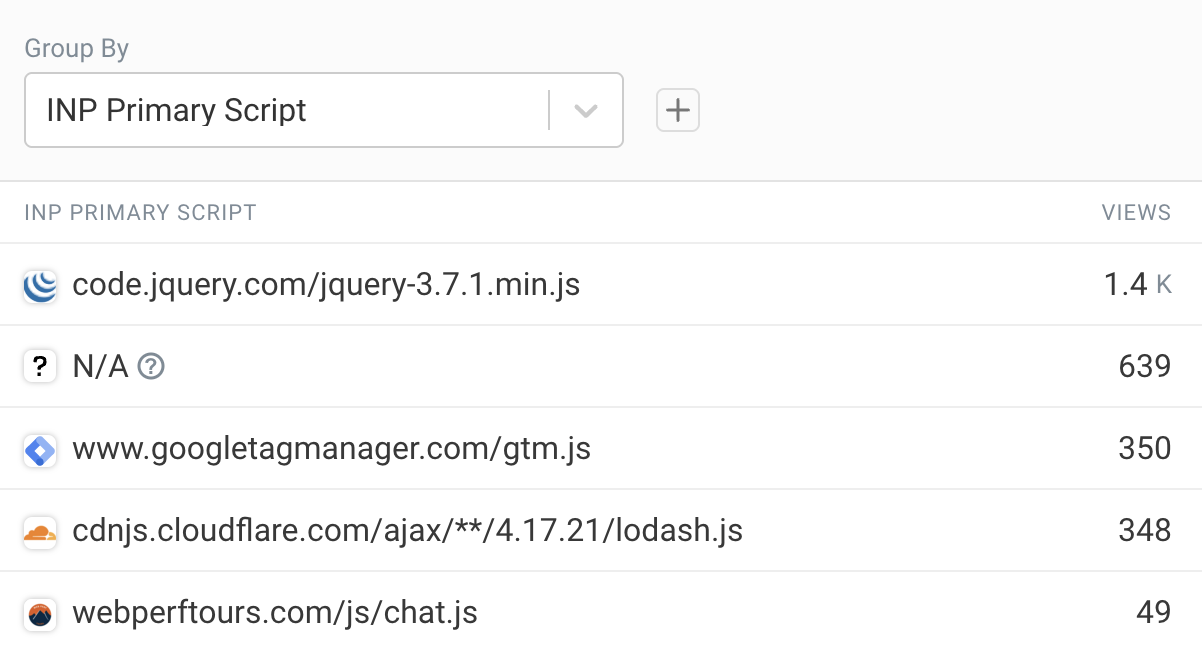
This makes it easier to spot third-party scripts that are affecting your site's interactivity.
Raise your performance game with our latest articles & videos
Improving client websites: case study
We spoke with Paul Terry, Head of SEO at Paramount, to learn how his agency uses DebugBear to solve performance problems for clients – from hidden LCP issues to ads causing layout shifts. Read the full case study here.
Latest articles from our performance experts:
- Many Servers Don't Properly Support HTTP Prioritization - we often recommend giving critical resources a high priority, but did you know not all servers and CDNs act accordingly? We reveal the university study with all the details, and explore what it means for your site.
- Performance engineering: to invest or not to invest - Scott Moore breaks down the real business motivations behind performance decisions—from the $6 million client lost over a $20,000 testing investment to why some companies choose to "throw hardware at the problem" instead of fixing the root cause.
- How To Fix A Slow Website: 4 Web Performance Tips – how a sluggish WordPress site went from a 12-second mobile load time to under 2 seconds, using simple caching tweaks, CDN setting , and image optimization — boosting a performance score from 33% to 94% without rebuilding anything.
- How To Use The Safari Developer Tools – Debugging Safari issues but don't know where to start? Our comprehensive guide walks you through everything from enabling the Web Inspector to remote debugging on iPhone—plus advanced features like performance profiling and network analysis that many developers overlook.
- Efficient Data Fetching In Nuxt With useAsyncData - Discover how useAsyncData's new shallowRef optimization delivers up to 73% performance improvements, and learn strategies for caching, payload minimization, and parallel requests that will transform your application's speed.
- Partytown: Optimize Third Party Scripts with Web Workers - Learn how Partytown's web worker magic can boost your Lighthouse scores from 70 to 99 by moving heavy analytics and tracking scripts off the main thread, plus get a complete toolkit of lazy loading and caching strategies.
And new videos on our Youtube channel:
Website speed directly impacts your conversion rates and user experience, but measuring it isn't as simple as it might seem. There are two main approaches to monitoring page performance: synthetic monitoring (controlled lab tests) and real user monitoring (data from actual visitors).
Each method has distinct advantages and limitations, and understanding when to use which approach can make the difference between thinking you have a fast website and actually having a fast website! In this video, Matt breaks down both monitoring types, explains their strengths and weaknesses, and shows you how to use them together for the complete picture of your site's performance.
We've also added a few more video walkthroughs to help you get the most from DebugBear: