We've made it easier to identify slow pages, added INP reporting to lab test results, introduced new test locations, and more.
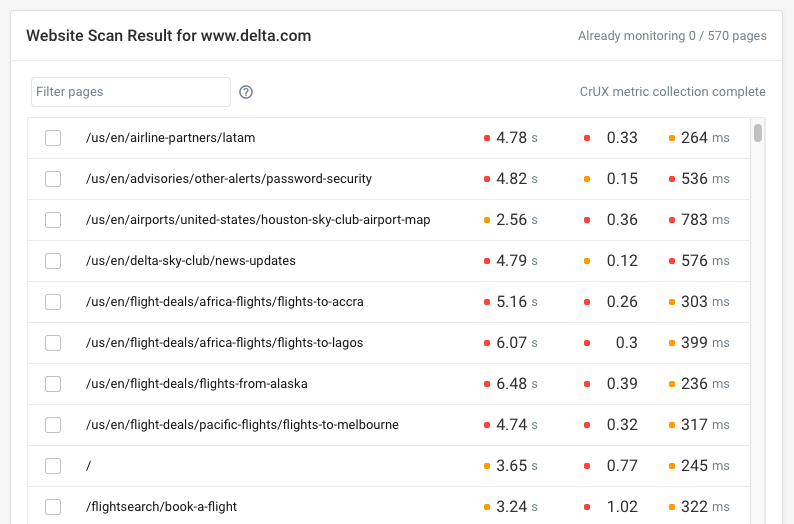
Scan your website for slow pages
We've improved our website scan feature so you can now use it to identify slow pages based on your sitemap and data from Google's Chrome User Experience report. This only works if your pages get enough traffic to get URL-level data.
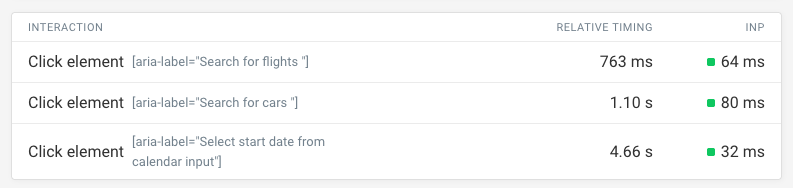
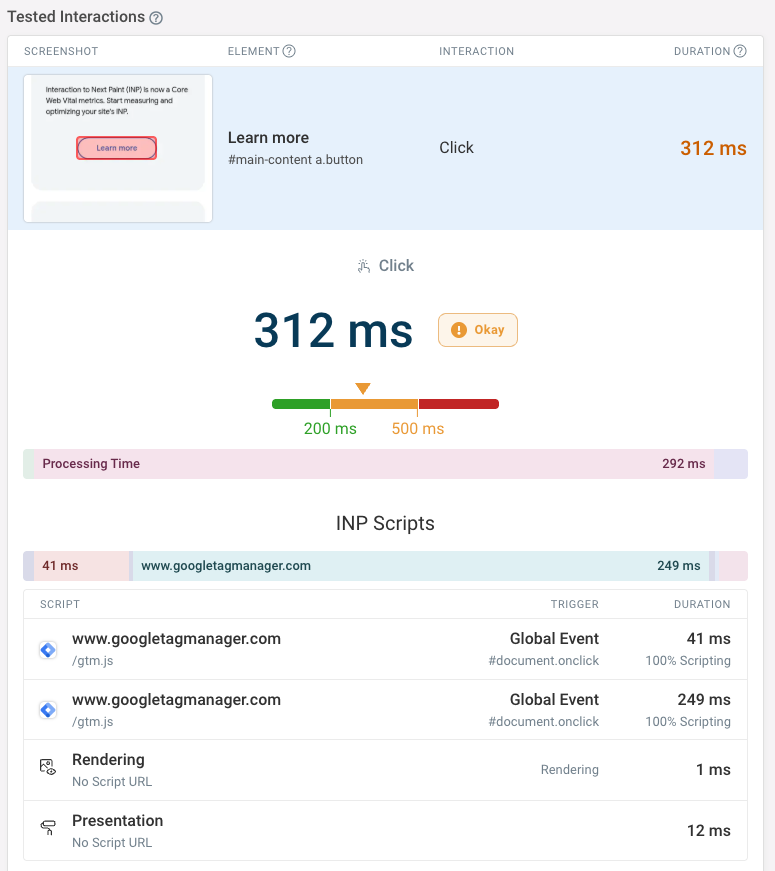
Measure INP in synthetic tests
We now collect Interaction to Next Paint measurements for click and keyboard interactions that are run as part of a user flow.
Coming next month: track those metrics over time.
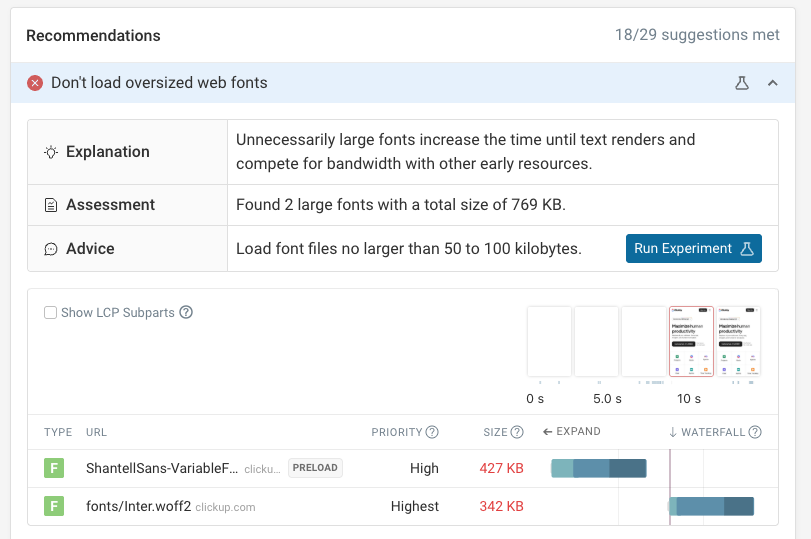
Detect large fonts slowing down your website
Are oversized font files delaying rendering on your website? Our performance analysis now auto-detects this issue and provides an automatic experiment to measure page speed with those fonts blocked.
5 new test regions
We've added 5 new test server locations:
- Mexico
- Sweden
- Belgium
- Chile
- Indonesia
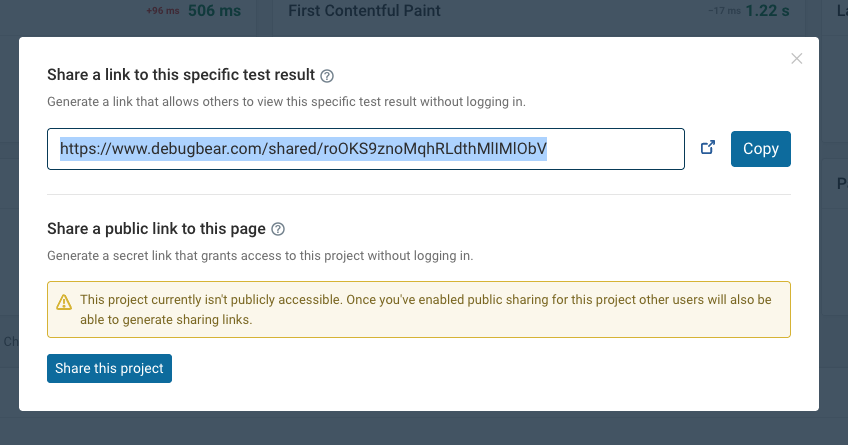
Share specific test results
You can now share specific test results or comparisons with a unique public URL.
RUM API improvements
Our RUM data API now lets you:
- Pick statistics other than the 75th percentile, for example the average or 90th percentile
- Pass in negative filters or wildcard matches
LoAF data in our free INP Debugger
Our free INP Debugger now not only identifies slow page interactions, but also reports slow scripts using the Long Animation Frames API.
New articles
We've published a number of new guides to performance and web development more broadly:
- Optimize Viewport for Mobile: learn how a bad viewport configuration can slow down user interactions
- Nuxt vs Next.js: learn the differences and similarities between these two frameworks
- Optimizing Images: learn how to optimize image files and request them efficiently
- Magento Performance Optimization: speed up your ecommerce store
Web performance videos
Some of our new Youtube videos: