This month we've released a new free tool, expanded our data export options, improved the comparison view, and more.
New free tool: Page Speed Bottleneck Finder
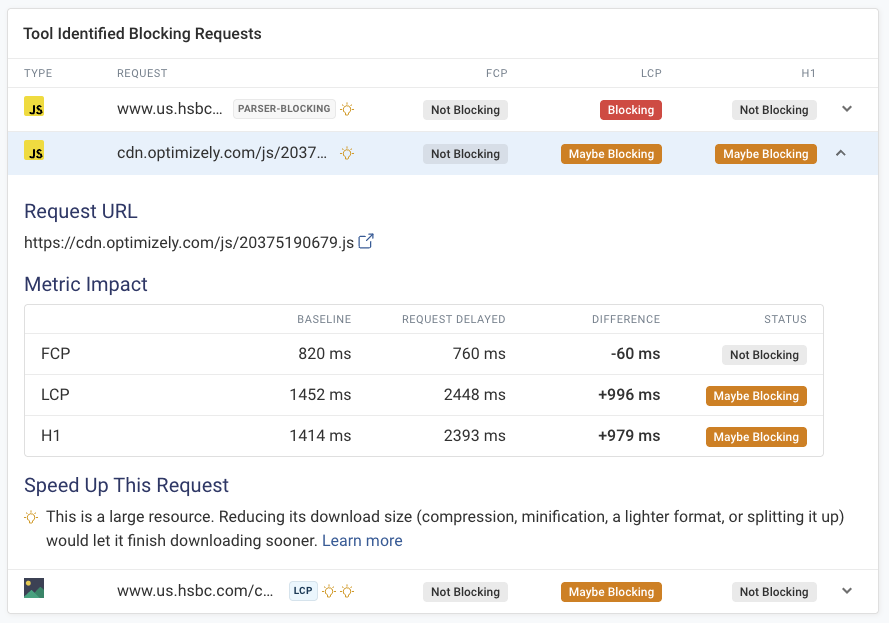
The Page Speed Bottleneck Finder identifies resources that slow down key metrics like FCP, LCP, and the H1-visible timing, even when Chrome doesn't classify them as render-blocking.
Instead of a request waterfall, each request is shown in a table that marks it as blocking, not blocking, or maybe blocking. This makes it easy to prioritize the requests that matter most and to spot non-essential third-party scripts that are holding up page rendering.
It works by slowing down each request and measuring how that impacts page speed metrics.
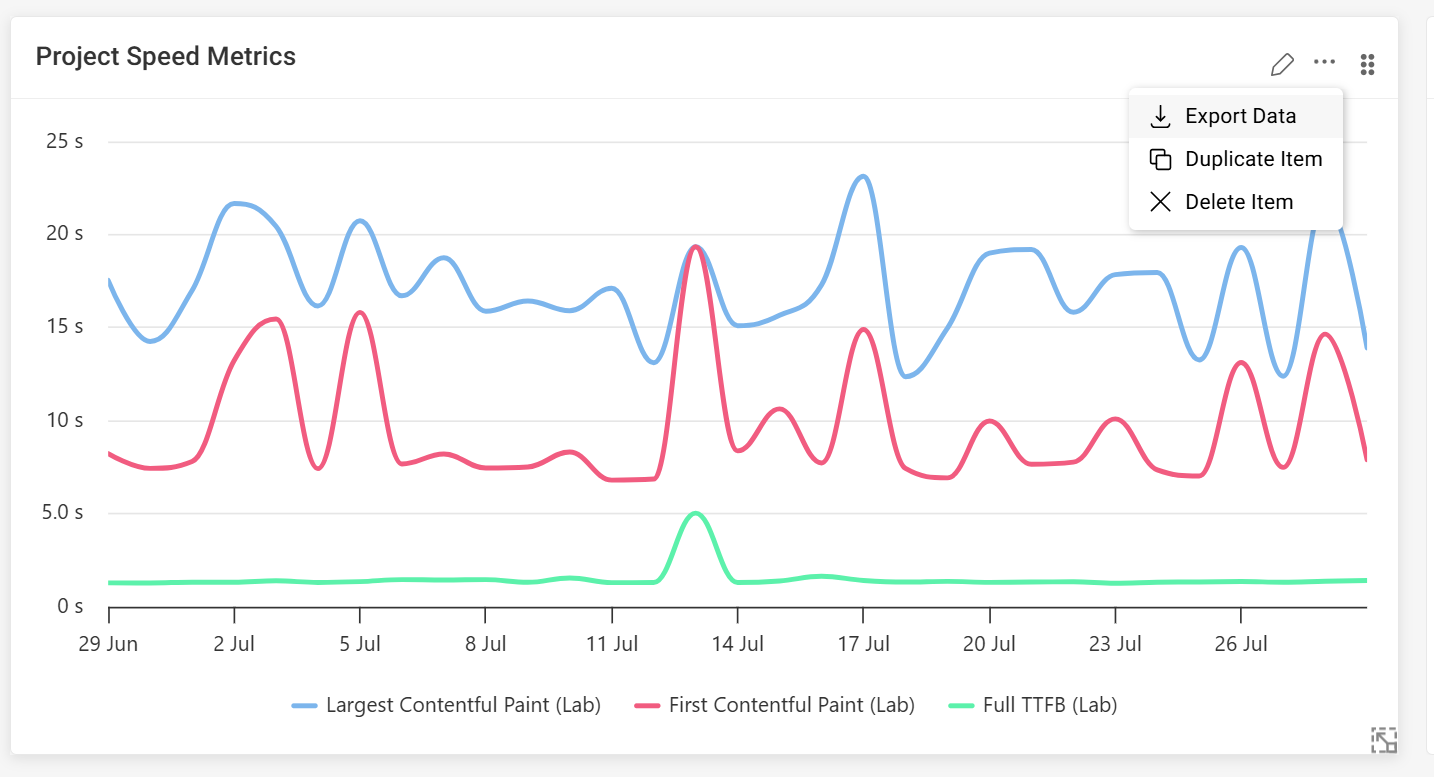
Custom dashboards: export data for individual charts
You can now export data from an individual chart rather than the entire dashboard, so you get exactly the data you need without running a full dashboard export.
Improved comparison data
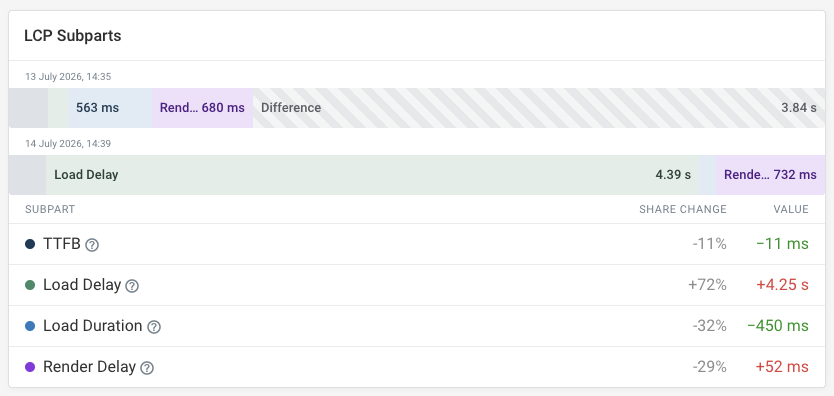
Comparison views for both lab tests and RUM data now more clearly highlight differences between metrics. In a lab test comparison, the LCP sub-parts visualization shows the difference with a grey bar and value, while the table reports the percentage change.
We've also added a change column across the metric tables in RUM.
Bulk edit regions
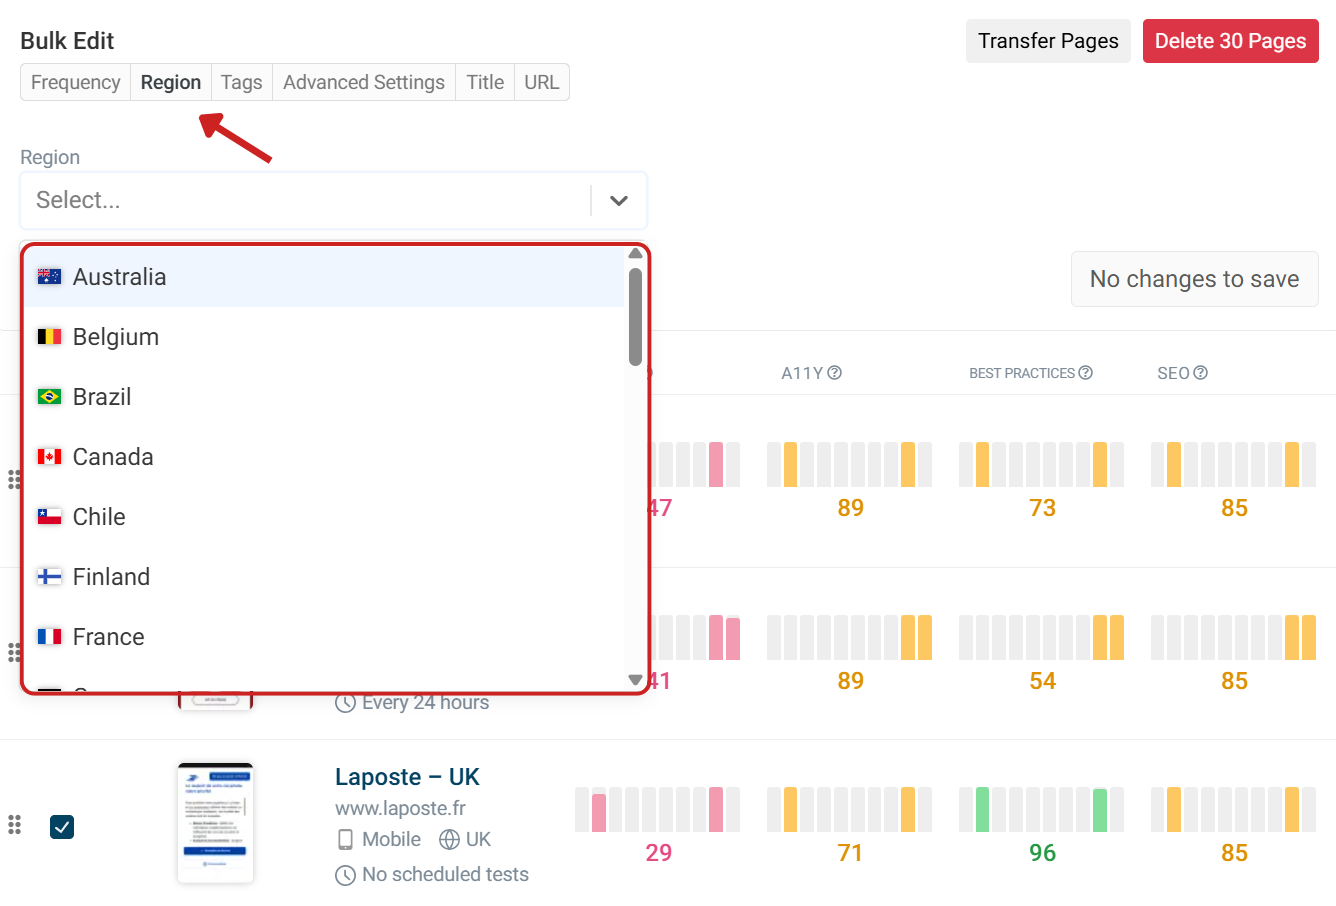
We have added a new option to change a page's testing region via bulk edit. When opening bulk edit, you can select the region tab and the server location from the dropdown. Previously, server locations could only be changed individually. If you need to change multiple pages' regions, this is a faster solution.
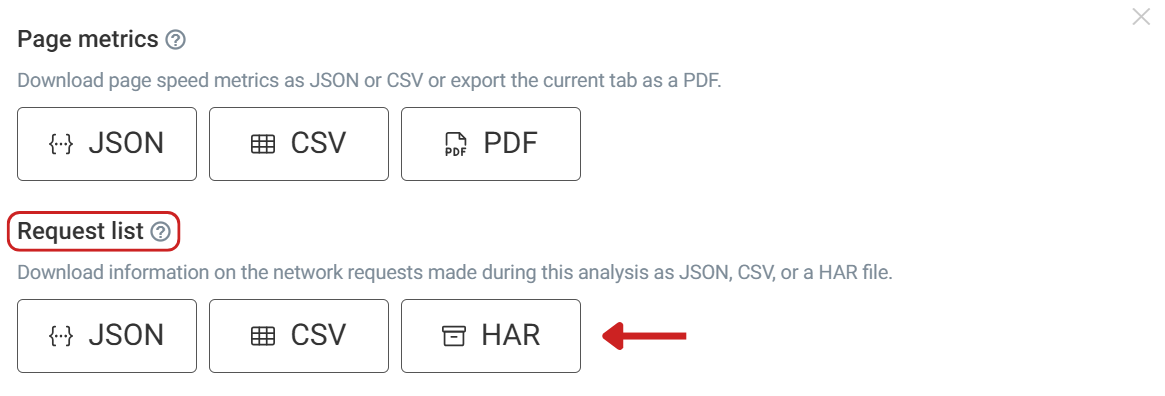
HAR file request waterfall export
A while ago we added an option to export the request waterfall as CSV or JSON. We've now added HAR as an export format, making it easier to inspect failed requests and share full request waterfalls with your team.
New articles
- Implement Website Best Practices With Lighthouse: A complete guide on each audit from Lighthouse's Best Practices category.
- Find Hidden Render-Blocking Requests with the Website Bottleneck Finder: A look at how to discover render-blocking requests with our new bottleneck finder tool.
Web performance videos
- Use DebugBear's MCP server to check page speed and set up monitoring: Learn how to set up and use DebugBear's MCP server.