This month we have added Uptime Monitoring and Server Timing support, as well as other customizable features and settings.
Uptime monitoring
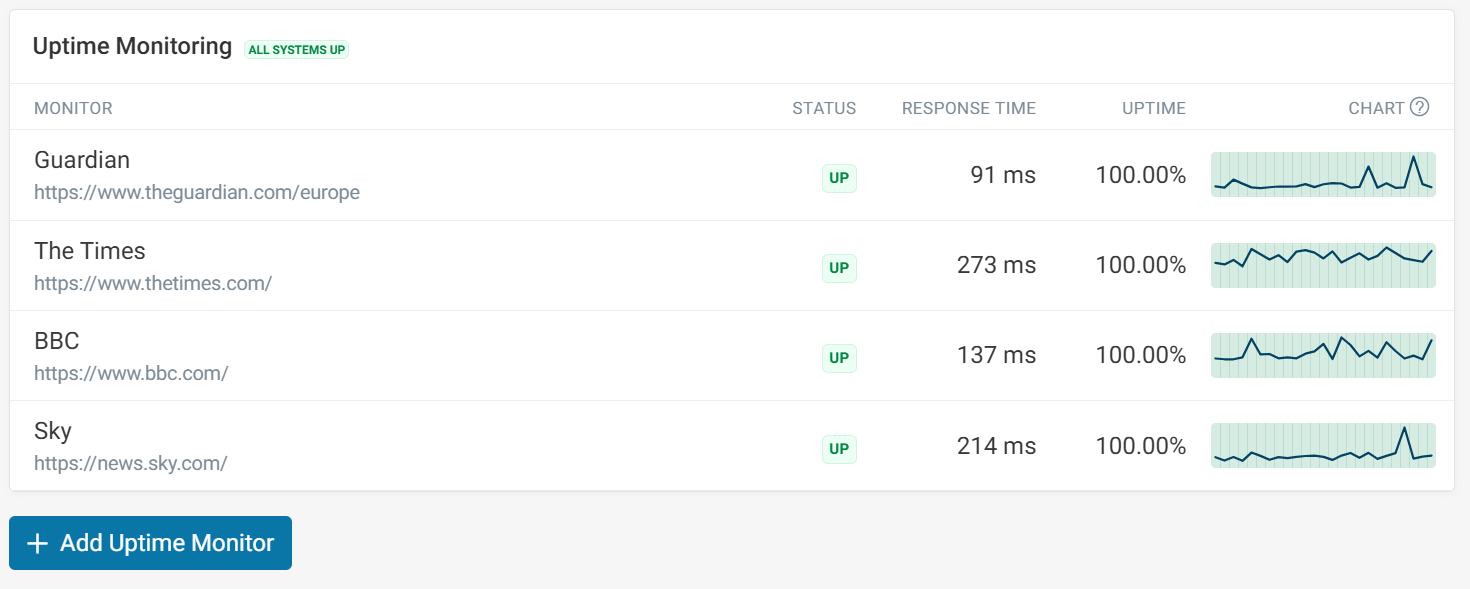
Our new Uptime Monitoring dashboard allows you to run checks and receive alerts on the status of your website's pages.
Adding a URL can be done quickly, with checks as often as every minute to continuously verify your site is available and responding as expected. Alerts can also be set up to notify you of any issues.
Server Timing support
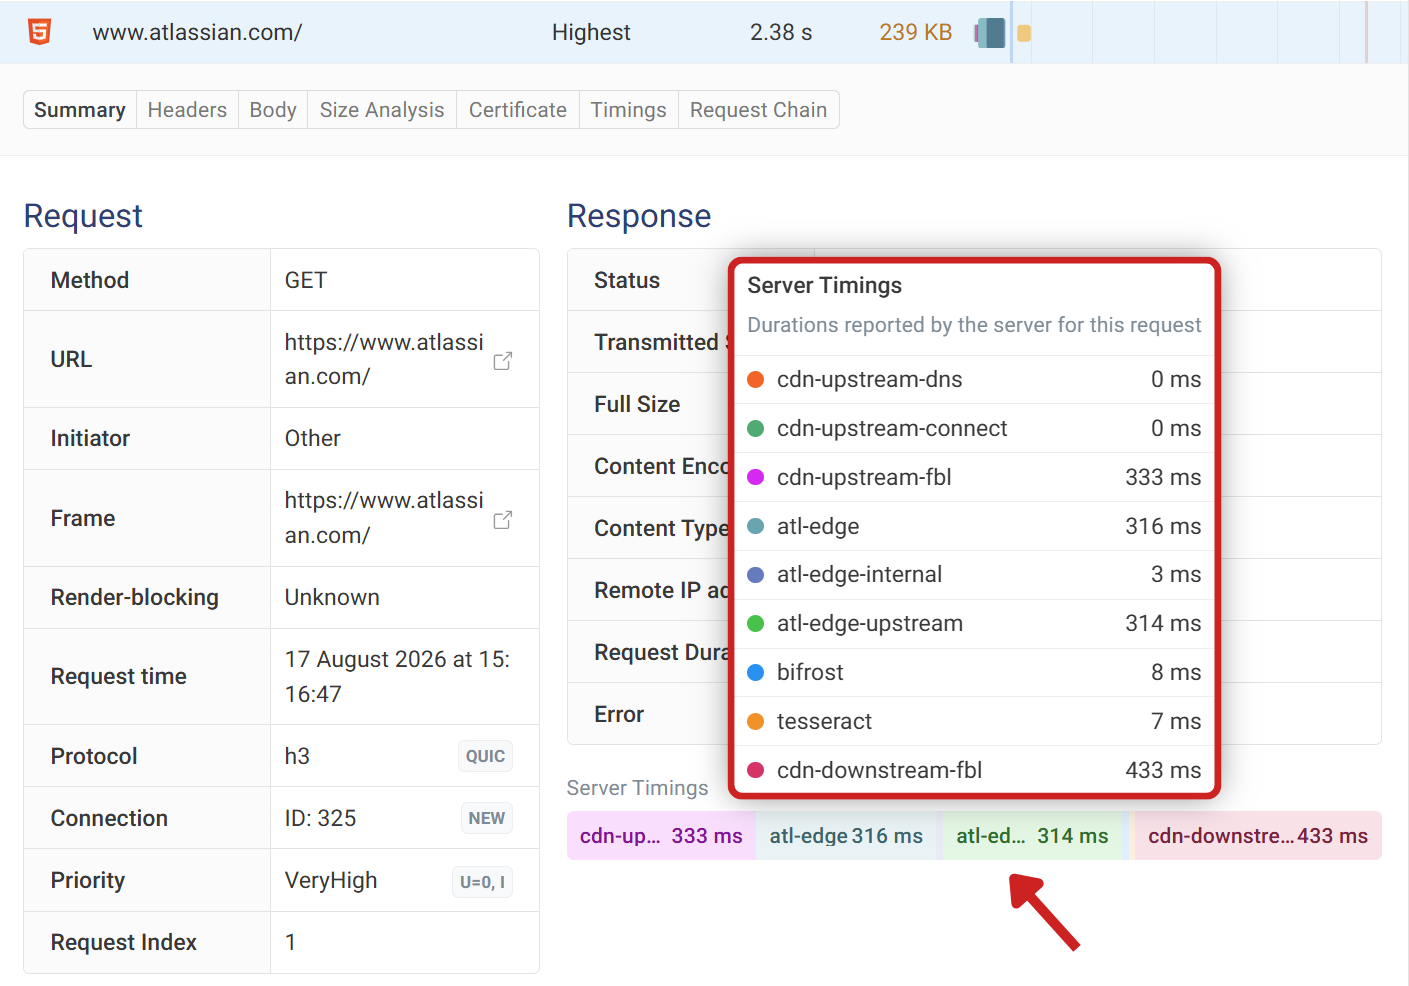
Server Timing headers make backend performance data accessible on the front end. We now support them in both lab tests and Real User Monitoring (RUM), allowing you to better understand the impact of server performance for your visitors.
You can find these timings in the response section of each request in the request waterfall, as well as in the metrics tab, which shows how performance has changed over time.
Set up tracking for server timings by creating Custom Metrics and Tags.
URL-based conversion triggers
Our conversion tracking feature lets you see how performance correlates with business outcomes.
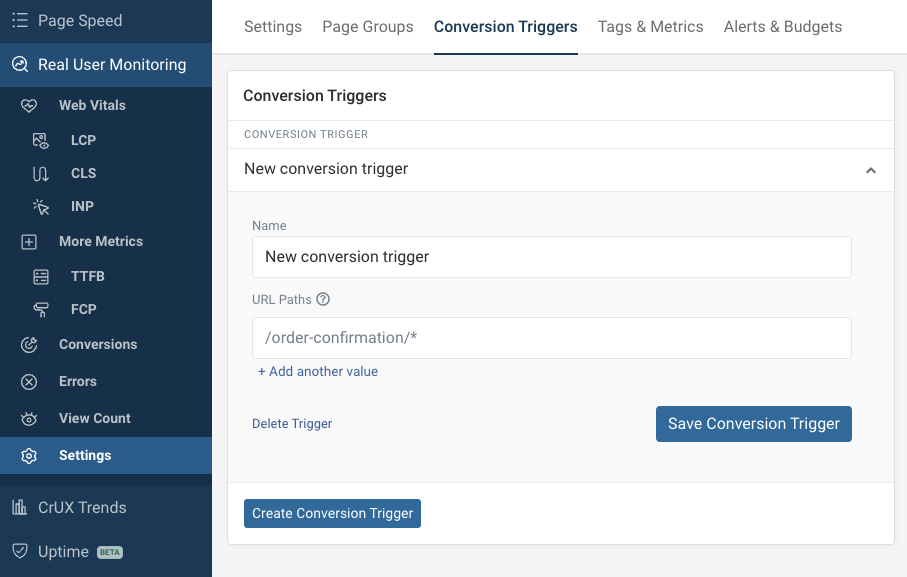
Previously you needed to run JavaScript code to register a conversion. You can now use URL-based conversion triggers to make this easier. For example, when a visitor reaches an order confirmation page you can automatically register the conversion there.
Improved custom request header setting
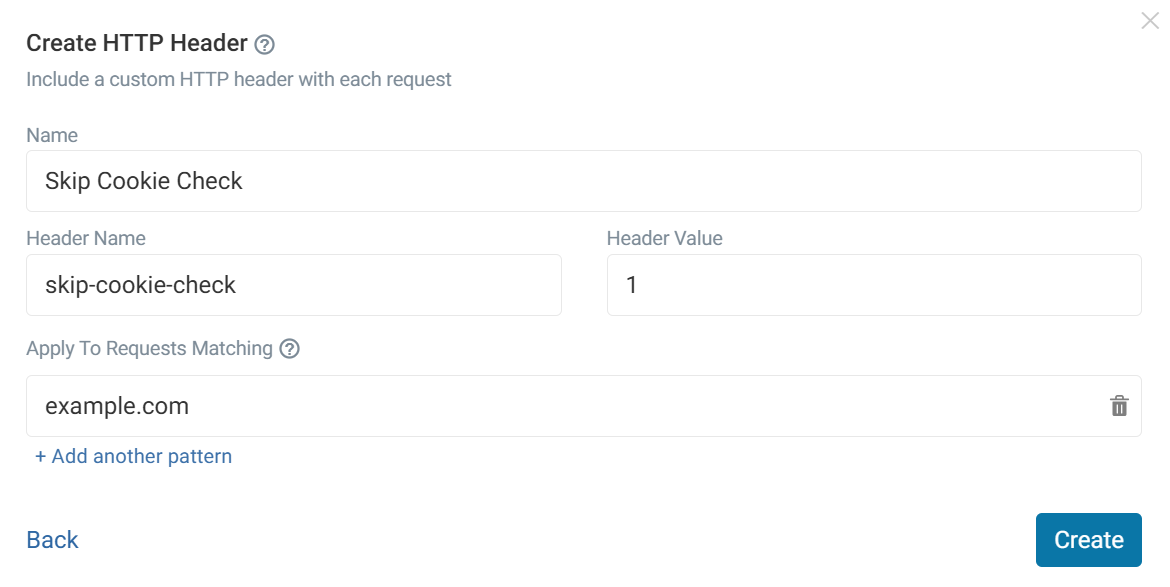
HTTP request headers can now be limited to specific domains, giving you more control over your lab tests.
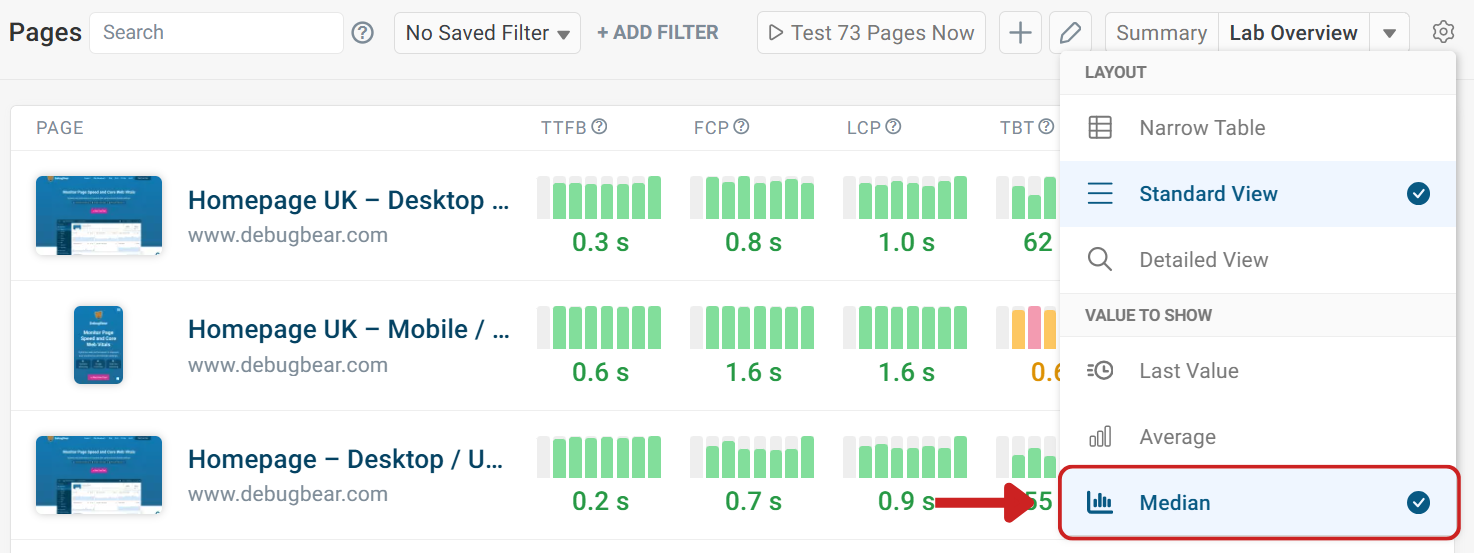
Median value added to project dashboard
There are now three value options that can be displayed in the project dashboard, with the median now available alongside the average and last value. Switch between the values using the cog icon in the top right corner.
Budget recovery notifications
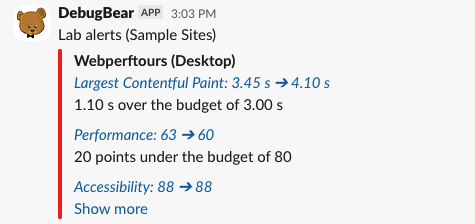
DebugBear alerts you when a performance budget has been breached. But now we also send notifications when a budget passes again. That way, you know when an issue has been resolved.
This option can be configured from the integrations tab in your account settings.
New articles
- Network Efficiency Guardrails: Detect Web Performance Issues: A complete guide to Network Efficiency Guardrails.
- Server Timing: Measure And Track Backend Performance: An introduction to Server Timing and how to use it to monitor backend performance.
Web performance videos
- Find web performance bottlenecks: A look at how our free performance bottleneck finder tool works.