”We've updated around 15,000 pages and saw some nice gains from it. "Good URLs" and their impressions
have increased 3x since implementation.“
Rafayel Begoyan
Senior SEO Specialist
”DebugBear has been an eye opener for us and has really shown what's causing the Core Web Vitals issues on our website.
Mandip Ahdan
Head of Engineering
We help startups, agencies, and enterprises keep their website fast
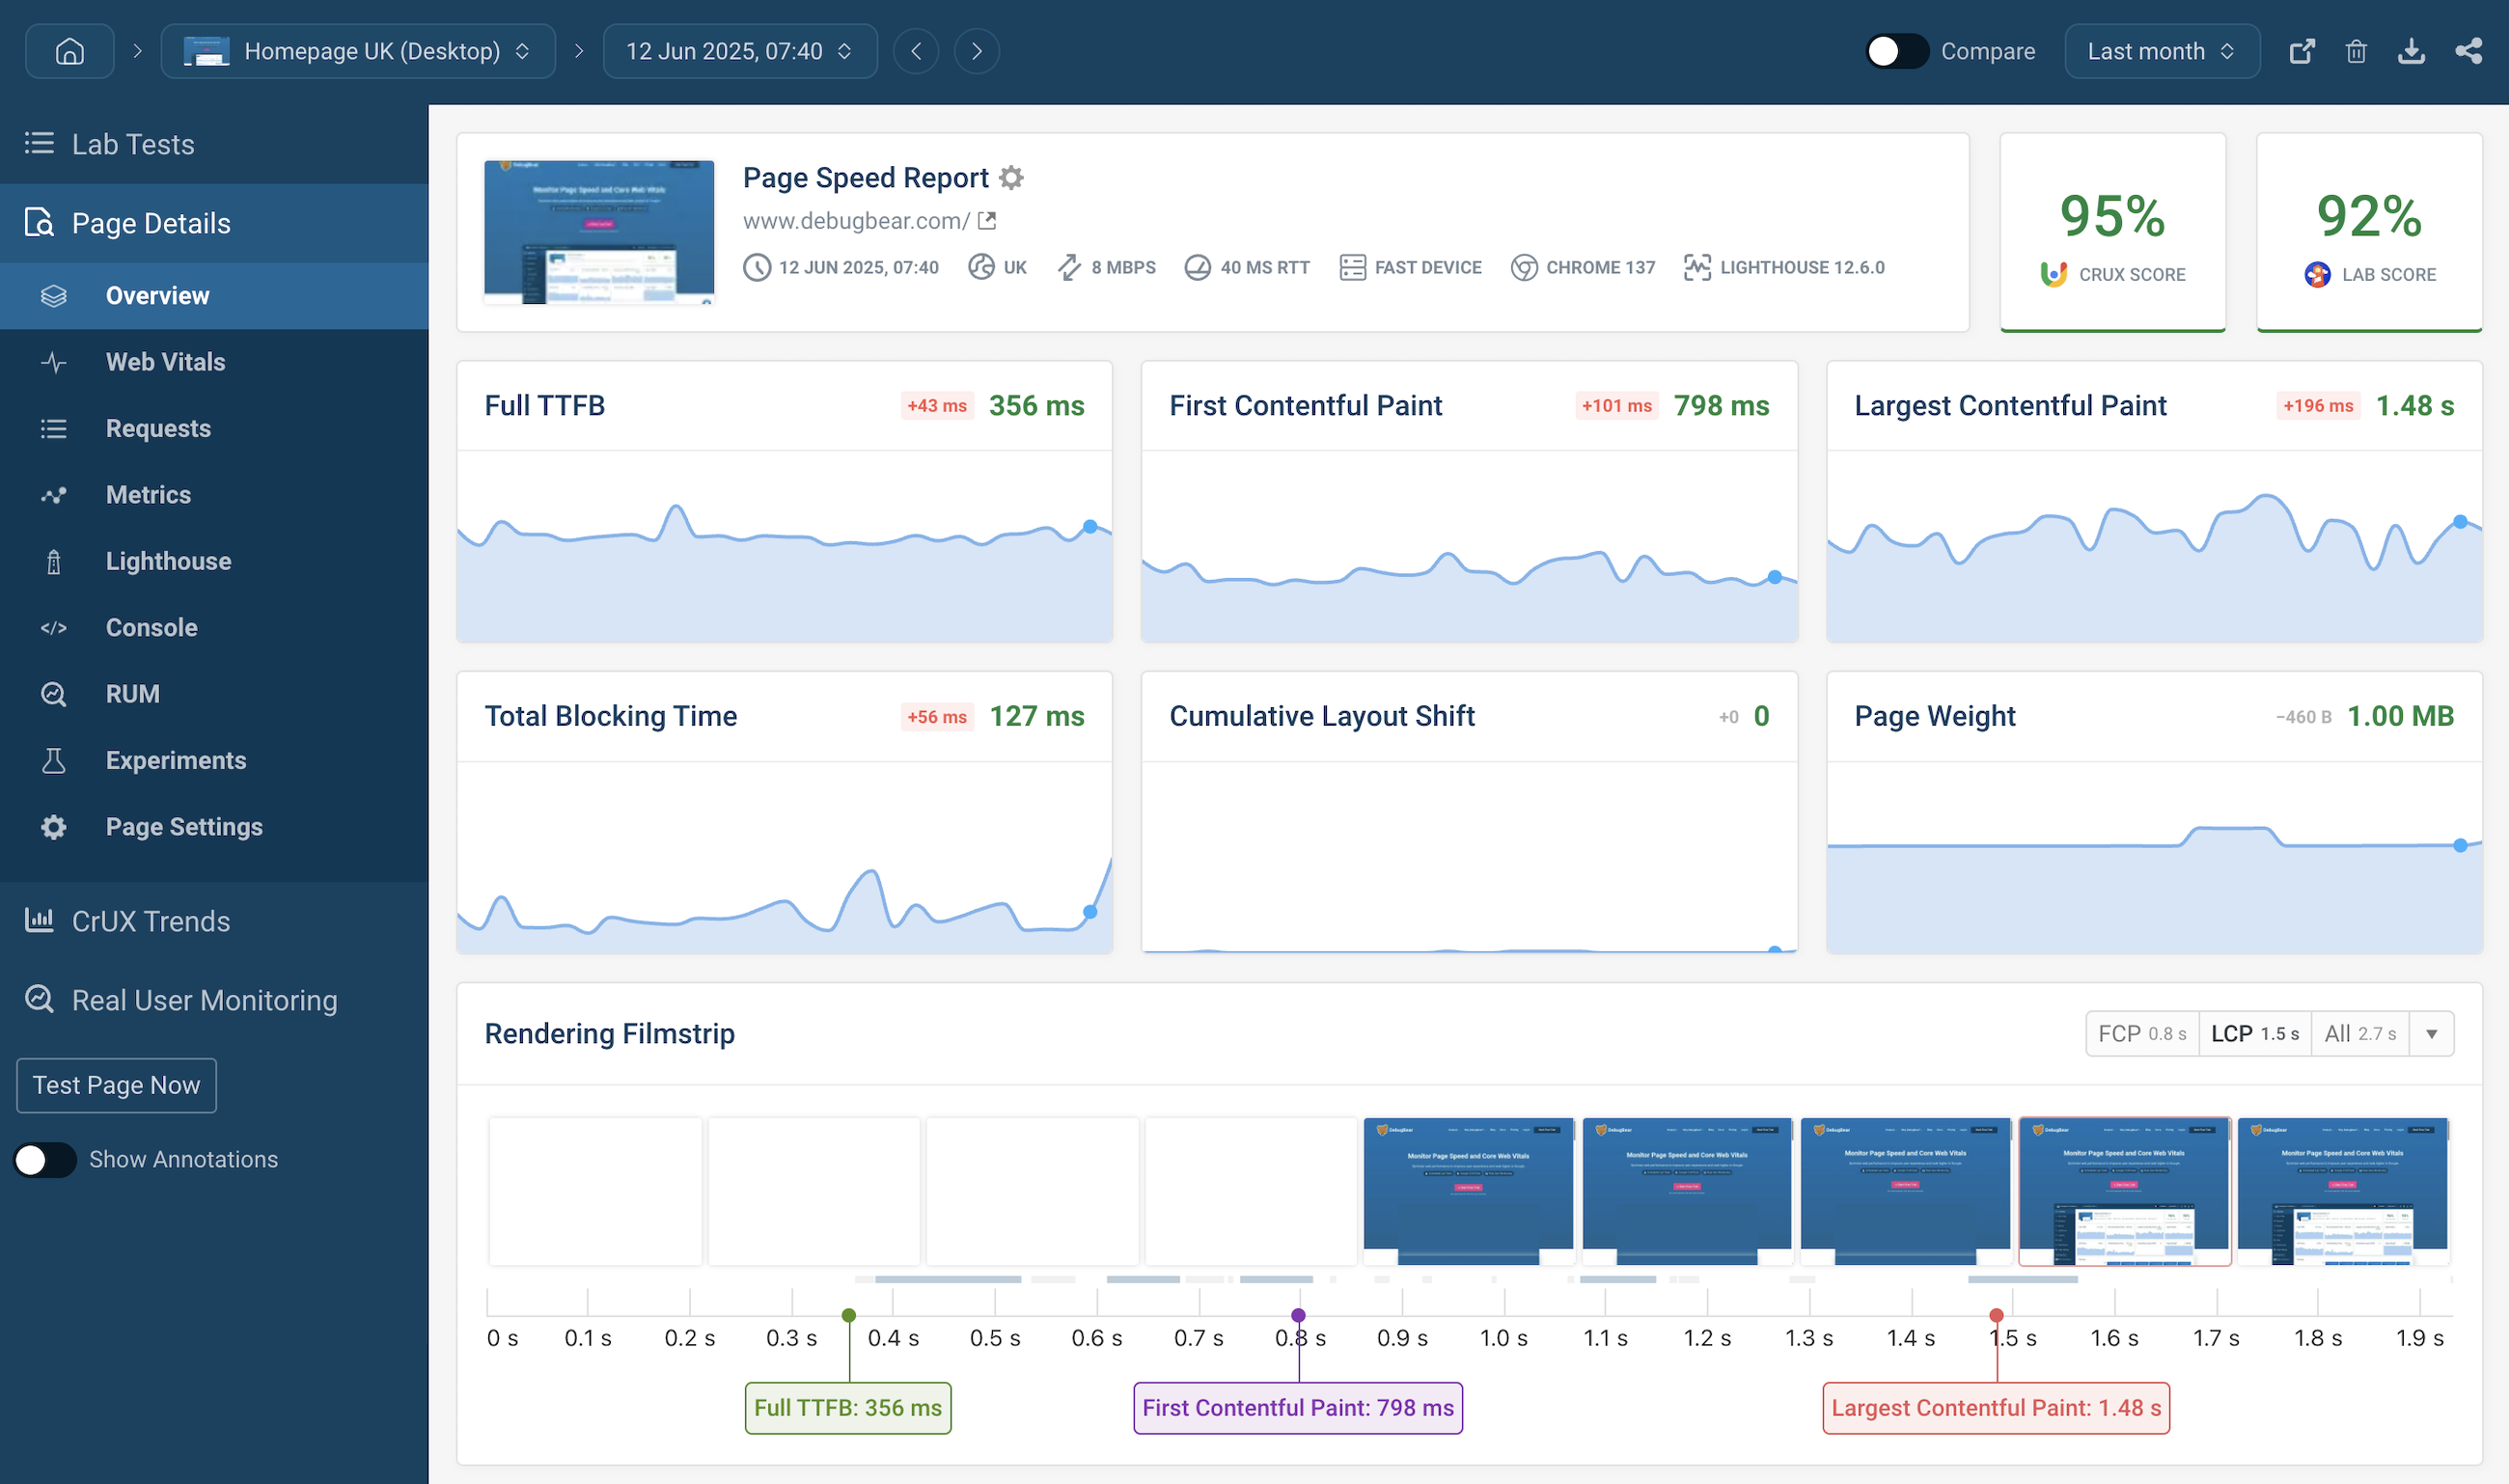
Monitor visitor experience on your website
Track Core Web Vitals
Measure the performance metrics that impact user experience and Google rankings.
Track LCP, INP, and CLS across your entire website.
Real user monitoring
See how actual visitors experience your website. Identify slow pages,
unresponsive interactions, and layout instability.
Synthetic monitoring
Run scheduled lab tests from 30+ global locations for in-depth
reporting, detailed recommendations, and regression detection.
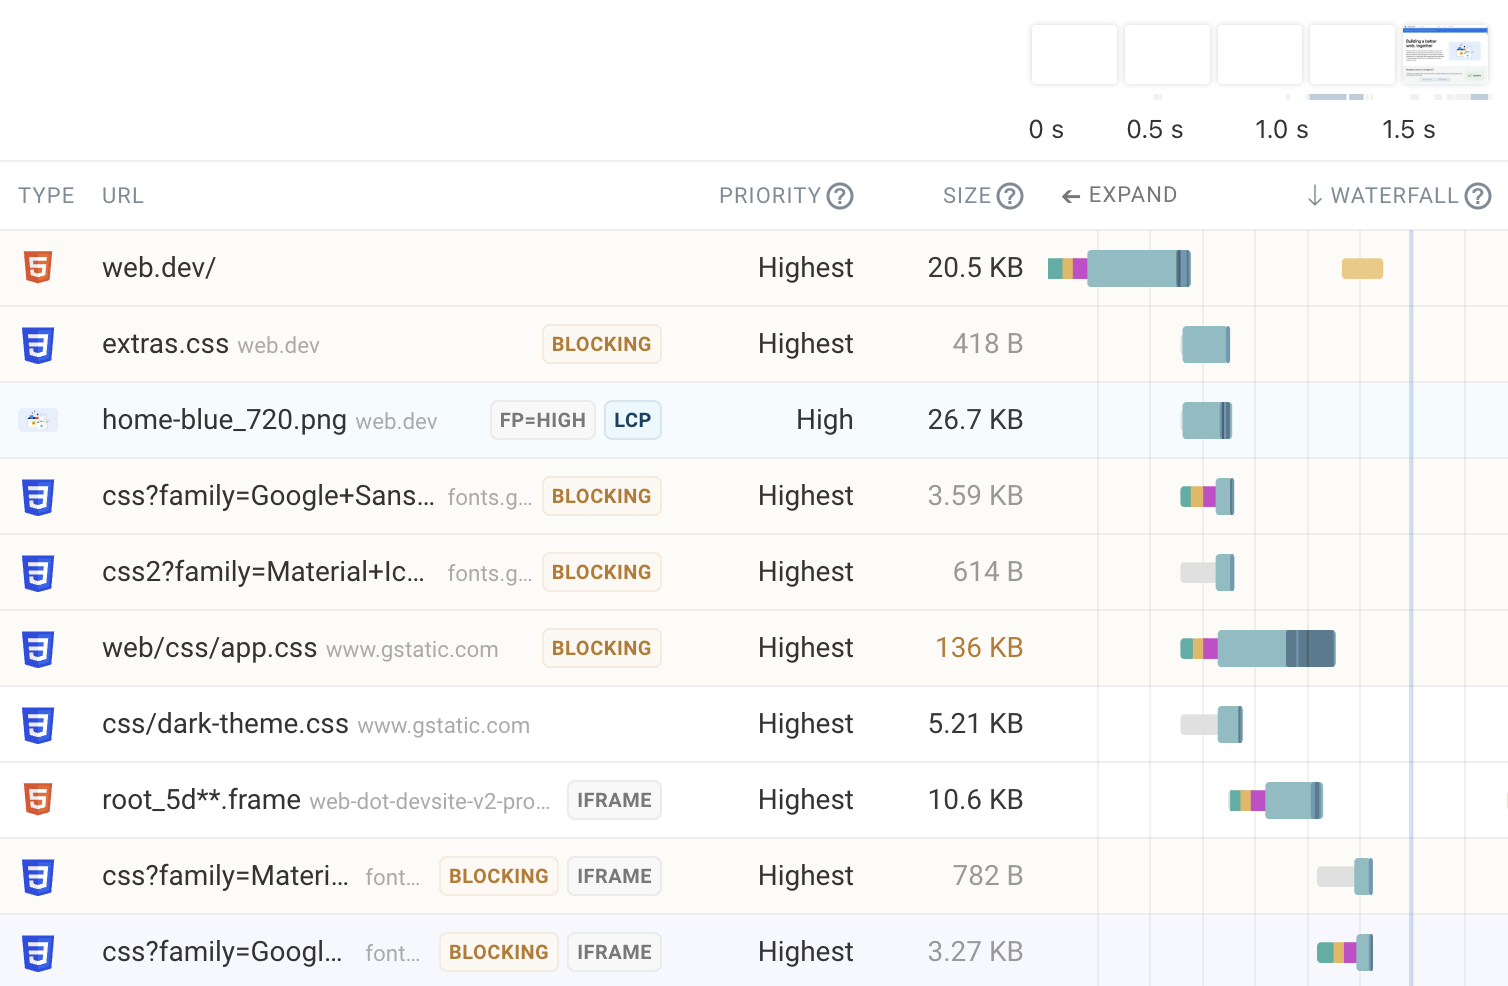
Understand and optimize page load speed
Request waterfall
See exactly what happens when your page loads. Identify render-blocking resources,
slow network requests, and CPU bottlenecks.
Tailored recommendations
Get specific advice on how to improve performance, with one-click experiments
to measure the impact of optimizations before deploying.
AI agent prompts
Generate ready-to-use prompts for AI coding agents to fix performance issues
based on your test results.
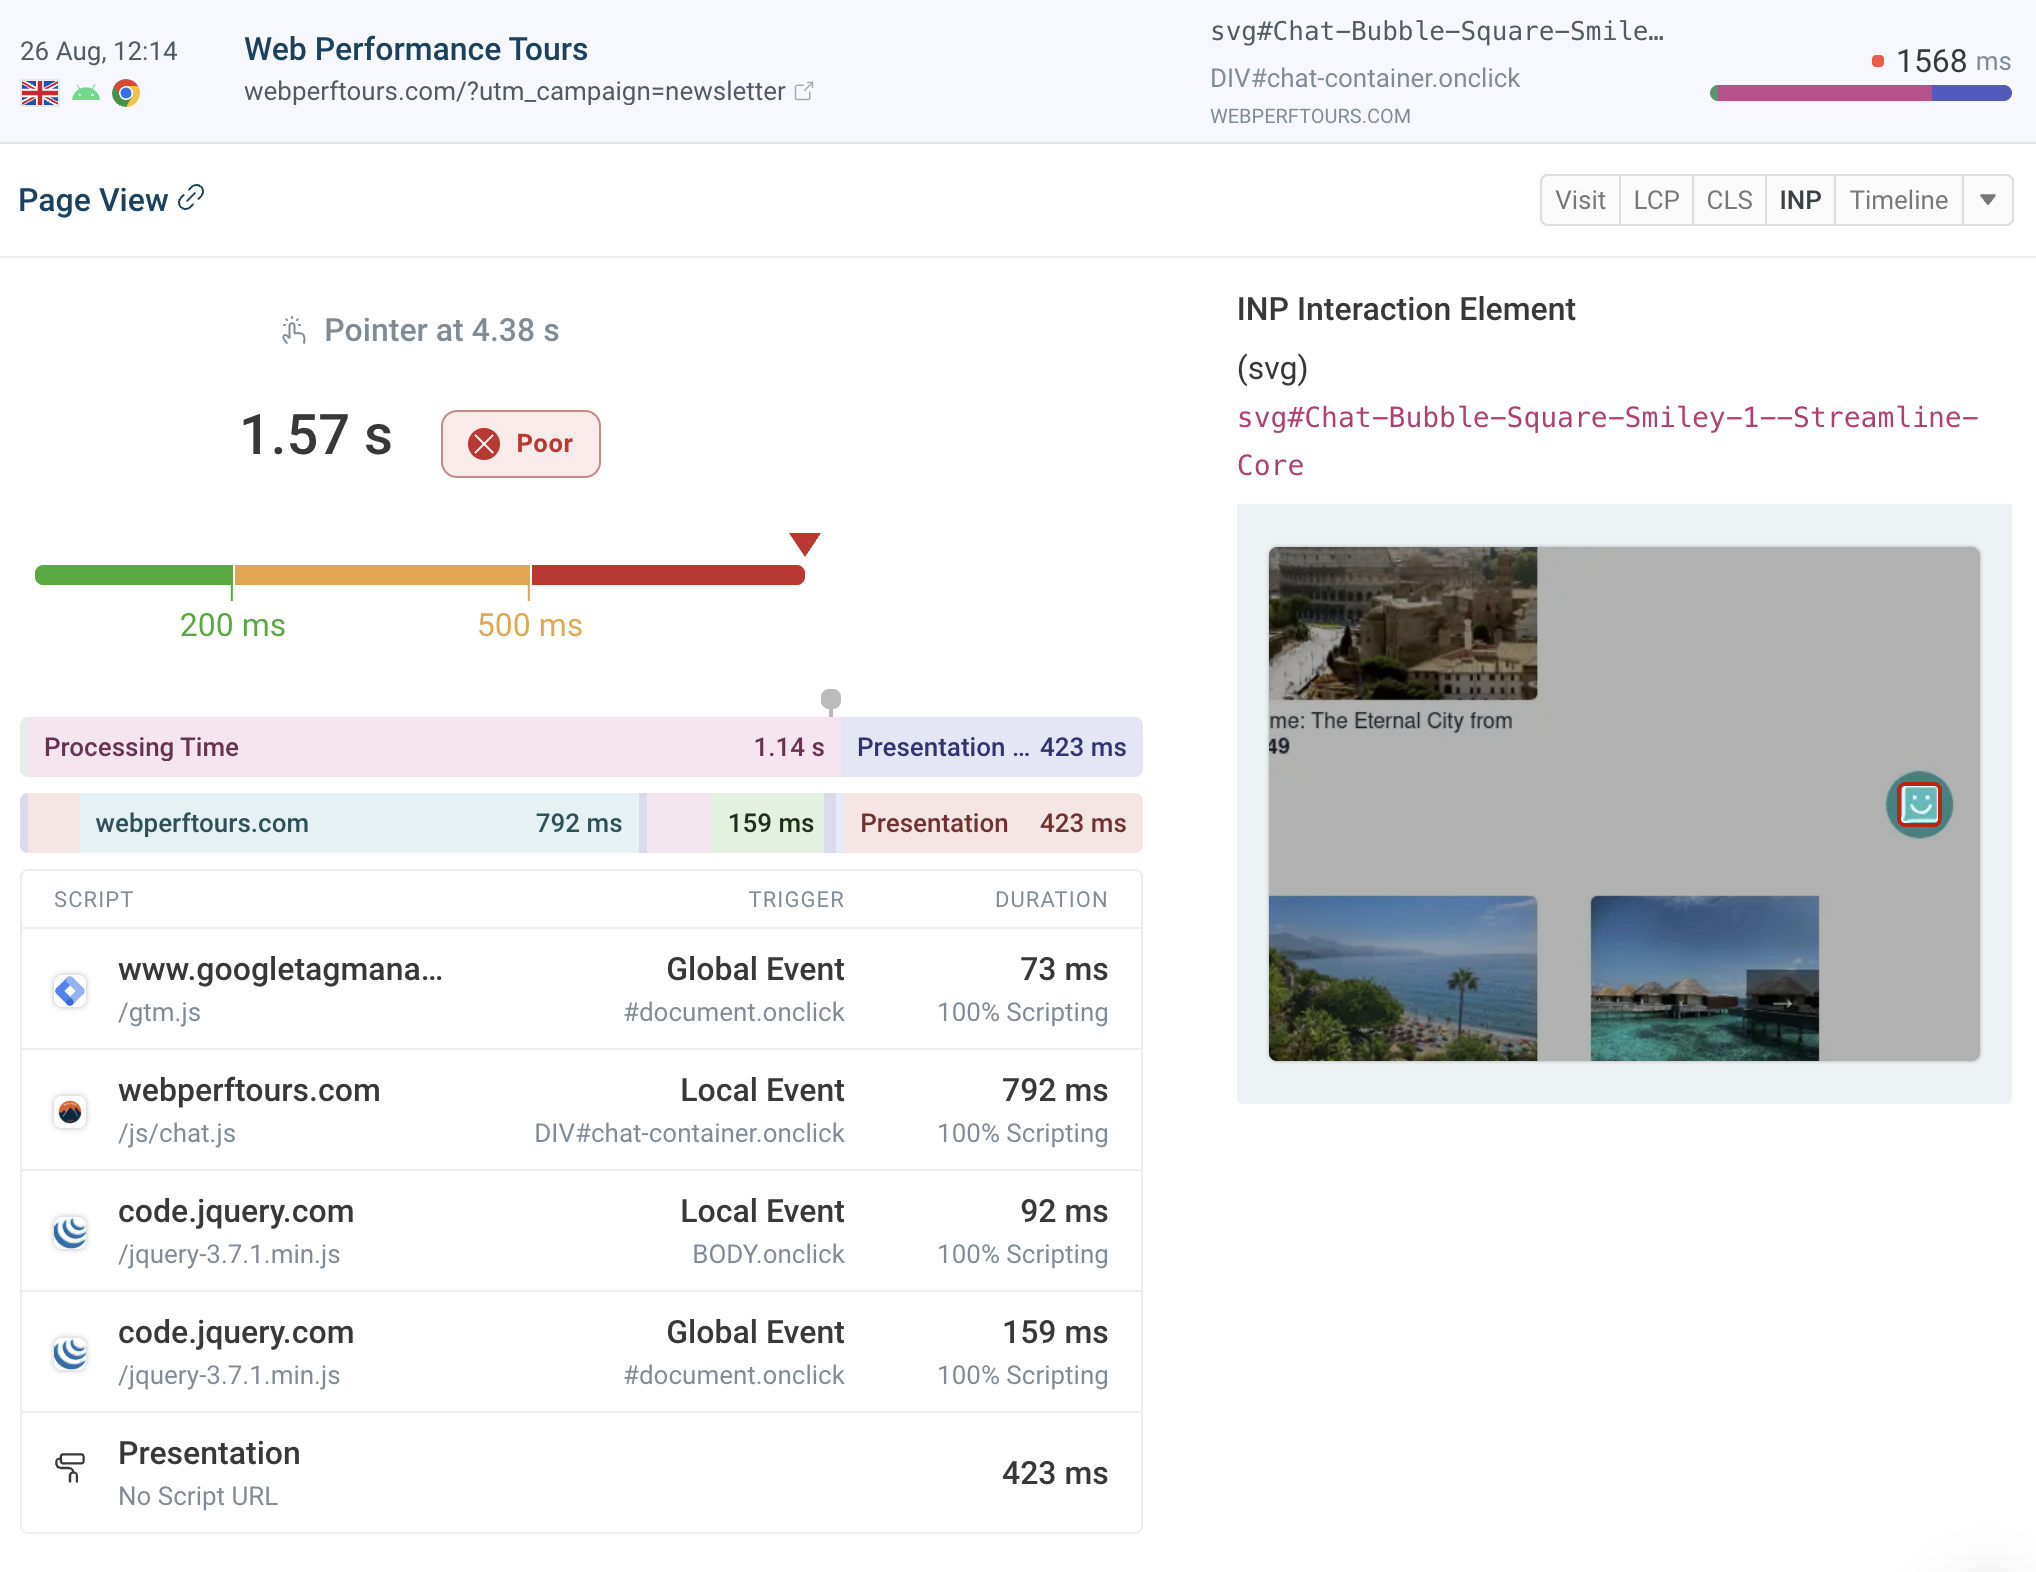
Fix slow user interactions
Identify slow page elements
See what UI elements cause slow interactions for your visitors.
Catch slow scripts
Identify what first-party and third-party scripts cause long tasks and unresponsive interactions.
INP analysis
Check what factors delay interaction responsiveness, including background tasks, event handlers, and presentation delay.
Catch and fix regressions
Automatic alerts
Get notified by email, in Slack, or Microsoft Teams when performance degrades.
Use zero-config alerts or set custom thresholds.
Compare test results
See exactly what changed between two test results with
side-by-side comparisons of requests, rendering, and metrics.
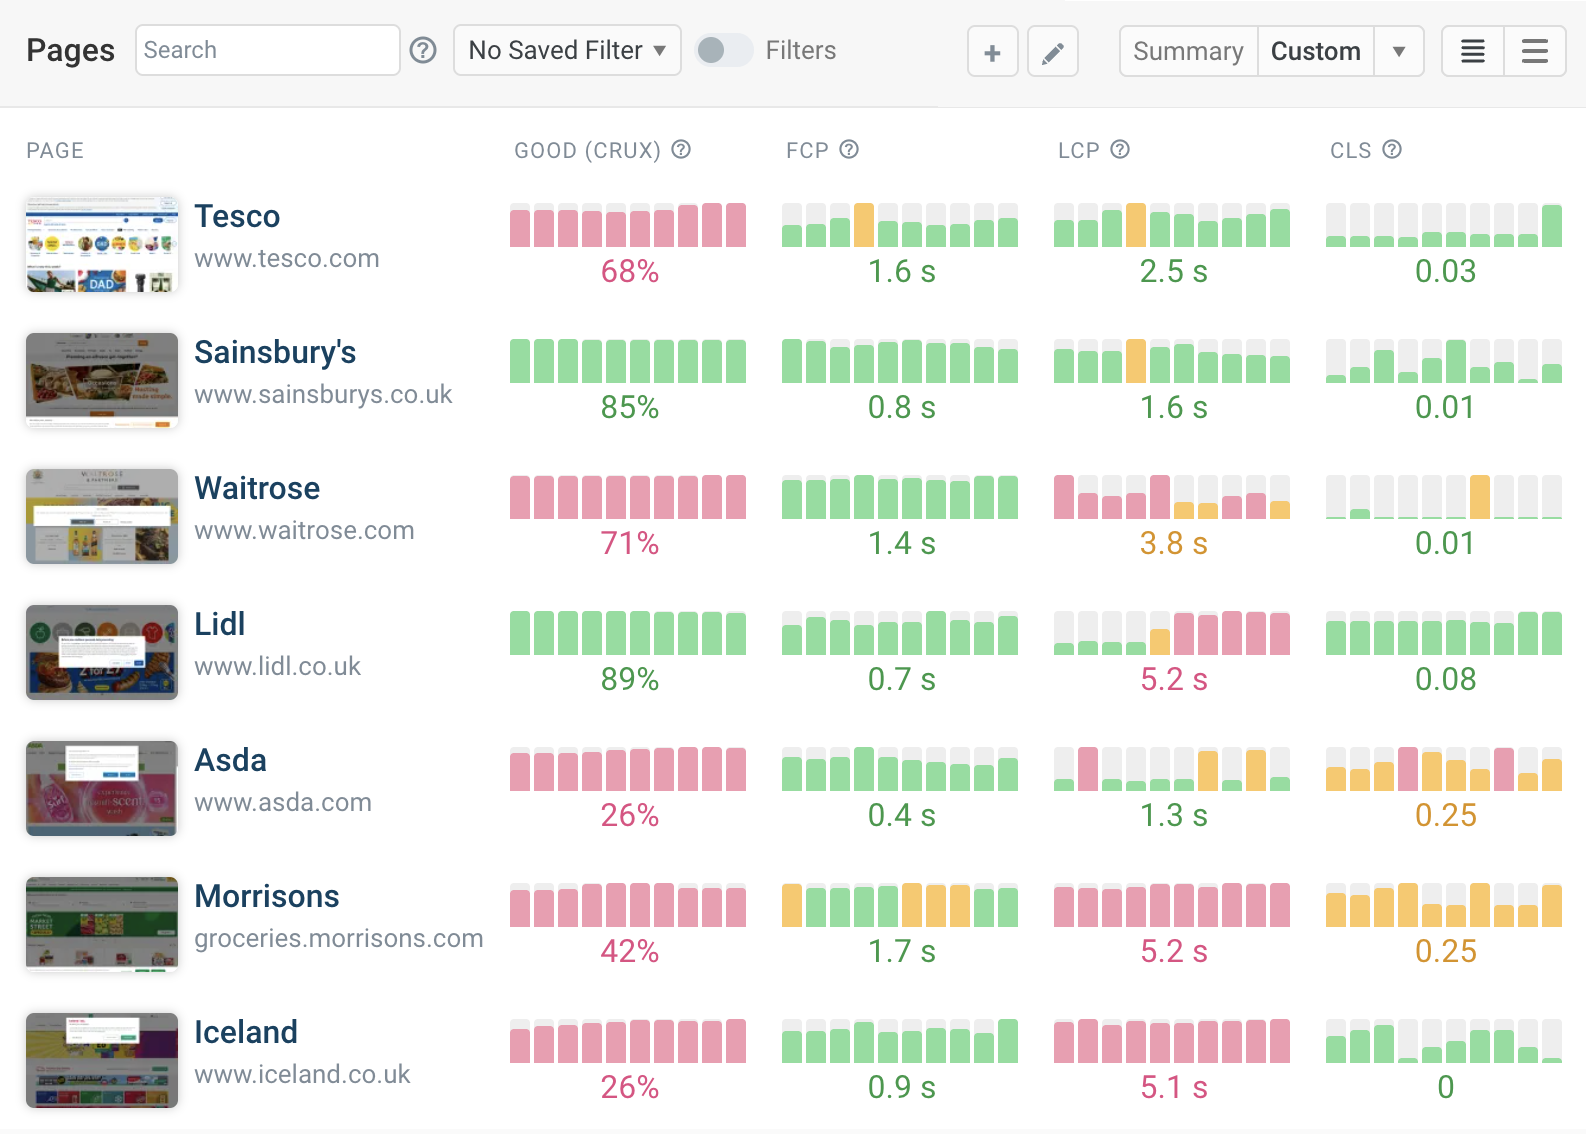
Segment and analyze visitor data
Break down by device, location, and network
Understand how experience differs between mobile and desktop users,
fast and slow networks, and visitors in different countries.
Correlate performance with business outcomes
See how web performance impacts bounce and conversion rates.
Track custom metrics that matter to your business.
Review individual page views
Check specific visitor sessions to understand exactly what
happened during a slow experience.
Create an industry benchmark
Competitor benchmarking with CrUX data
Compare your website performance to competitors using
real user data from Google's Chrome User Experience Report.
Track long-term trends
Monitor progress over time with 40 weeks of instant historical data.
See if you're pulling ahead of the competition.
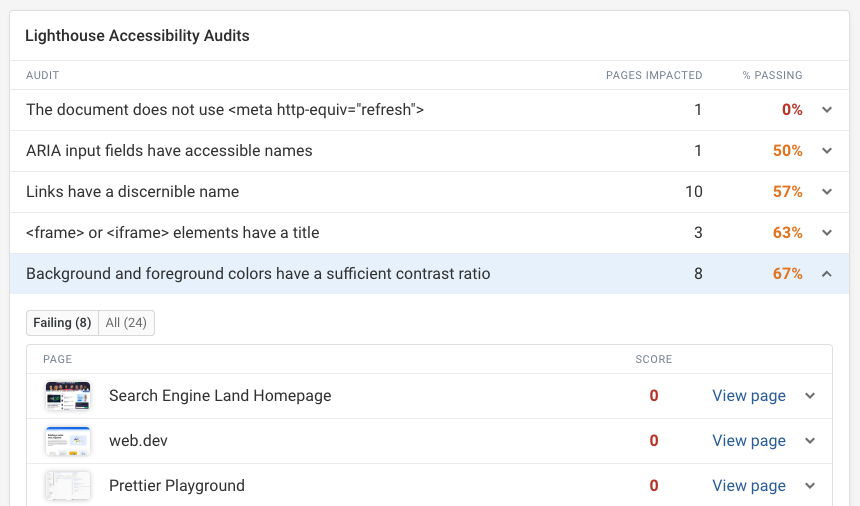
Identify common accessibility and SEO issues
Track Lighthouse audit scores
DebugBear runs Lighthouse accessibility, SEO, and best practices audits
as part of every test. Monitor scores over time and get alerted when they drop.
Spot issues across your website
Use the audits dashboard to see which issues are most common across all your monitored pages.
Track changes over time
Compare test results to see when an audit started failing and what changed on the page.
Hear from our users
”The most actionable-info packed page speed visualization
available. DebugBear provides unique features that are crucial
to debugging complex issues, like request-chain visualization."
Robin Marx
Web Protocol and Performance Expert
”The reporting data is very helpful in pinpointing what causes
site speed issues – immediately actionable.
It's well above and beyond the info you get from Lighthouse
and the performance tests through Chrome.“
Loren McDonald
IT Director
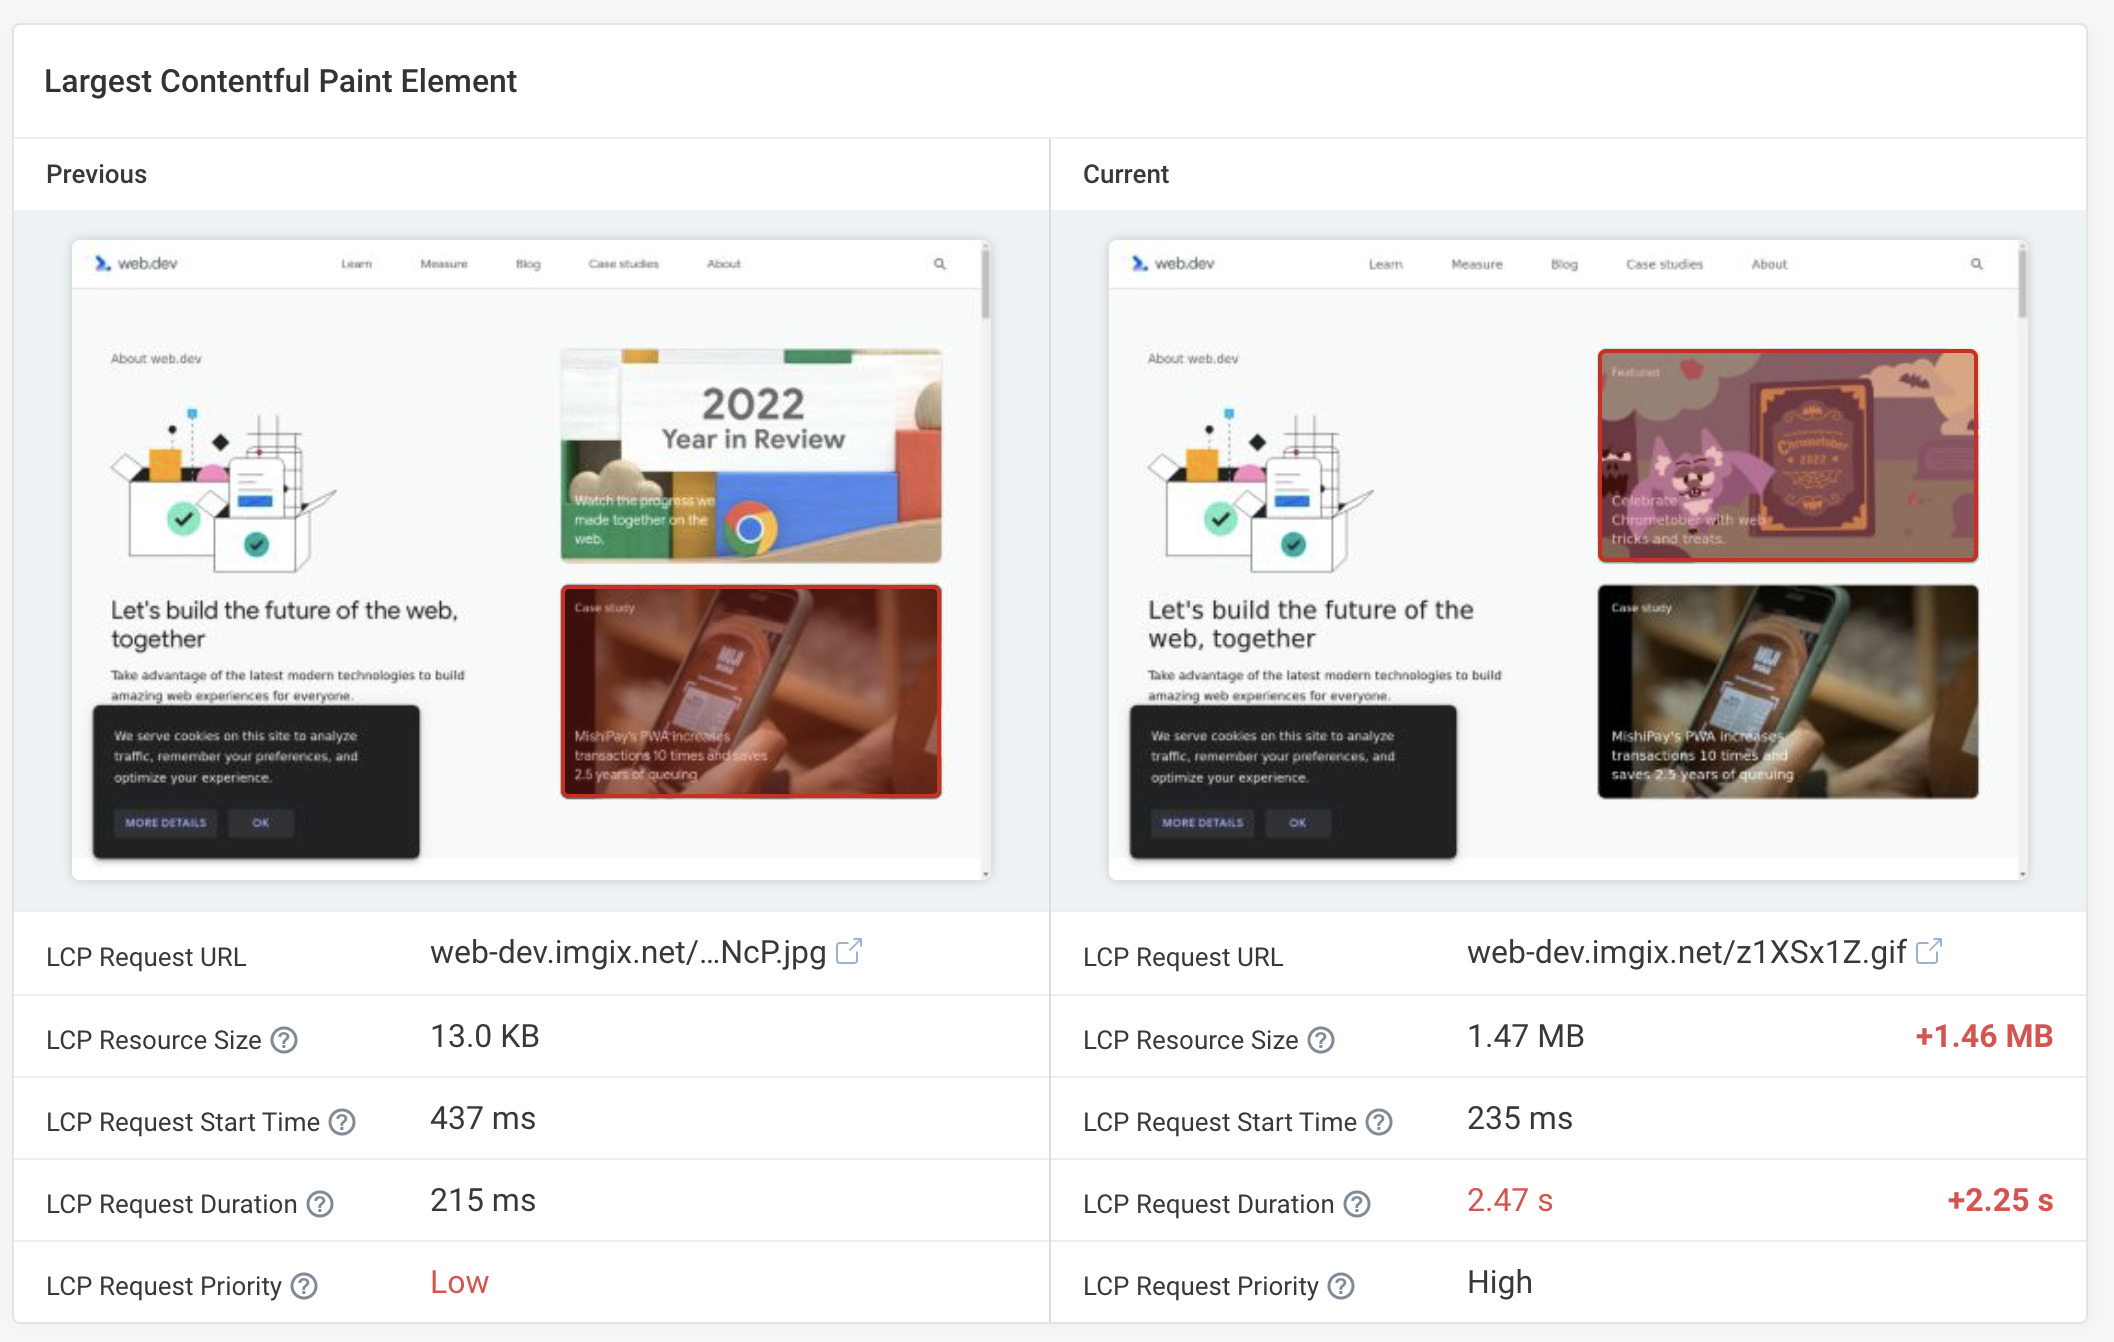
”DebugBear delivers the
best stats for before and after changes
in exquisite detail. It also shows clear and easy to find data for
Google's Web Vitals.