
UptimeRobot is a widely used tool for monitoring website uptime. It tells you whether your site is up, but not how fast it loads, what your visitors experience, or why a page failed beyond the status code. In this article, we take a look at six alternative products and what they can do better.
1. DebugBear: Uptime monitoring plus page speed
DebugBear is a comprehensive website monitoring platform. You can check uptime and page speed with synthetic checks and real user data.
Uptime checks can run every 1, 5, 10, 15, or 60 minutes. When there's a failed check, DebugBear first verifies it from a second location to avoid false positives. You can opt to only be notified after several failed checks.
Once DebugBear detects an outage it alerts you by email, in Slack, or in Microsoft Teams.
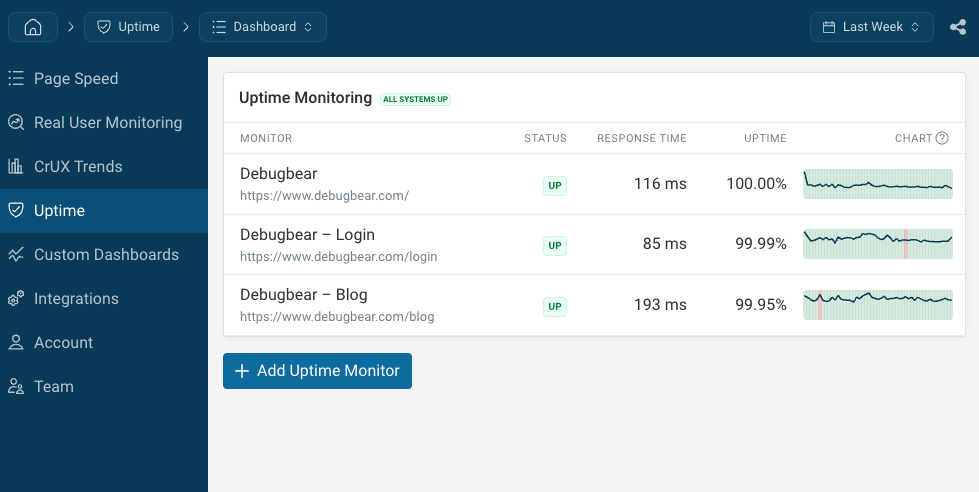
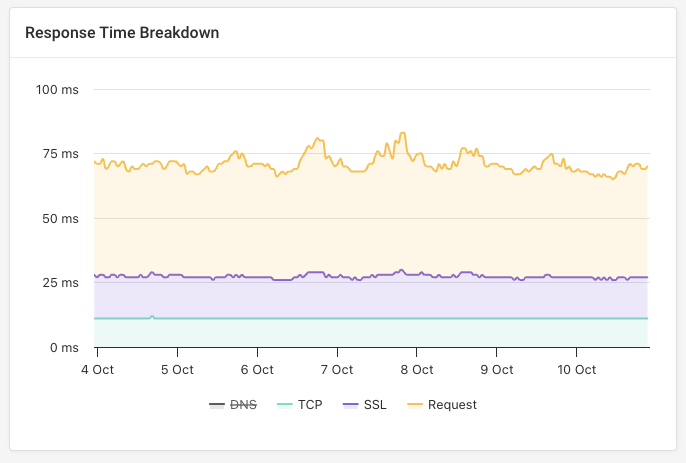
DebugBear also tracks the response time for each of your checks.
You can fail checks when an unexpected status code is returned, when the response time exceeds a threshold, when a keyword is missing from the page, or when an HTTP header is missing from the response.
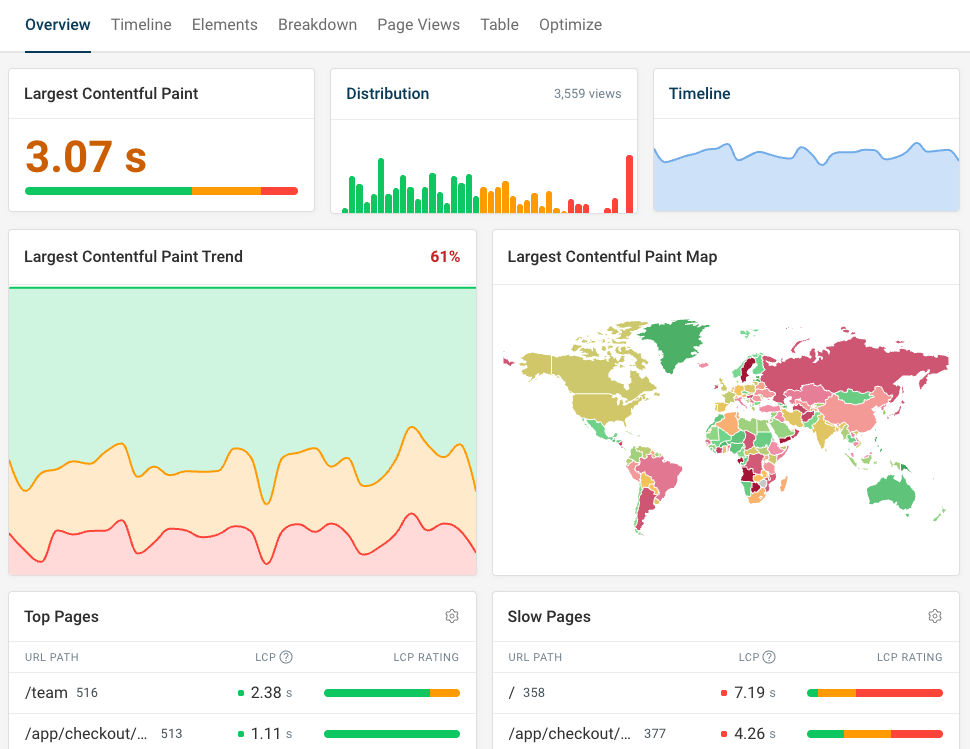
DebugBear's biggest strength is that it also provides detailed web performance monitoring and insights to speed up your website.
The real user monitoring feature focusses on your visitors' Core Web Vitals metrics and whether specific user interactions are slow.
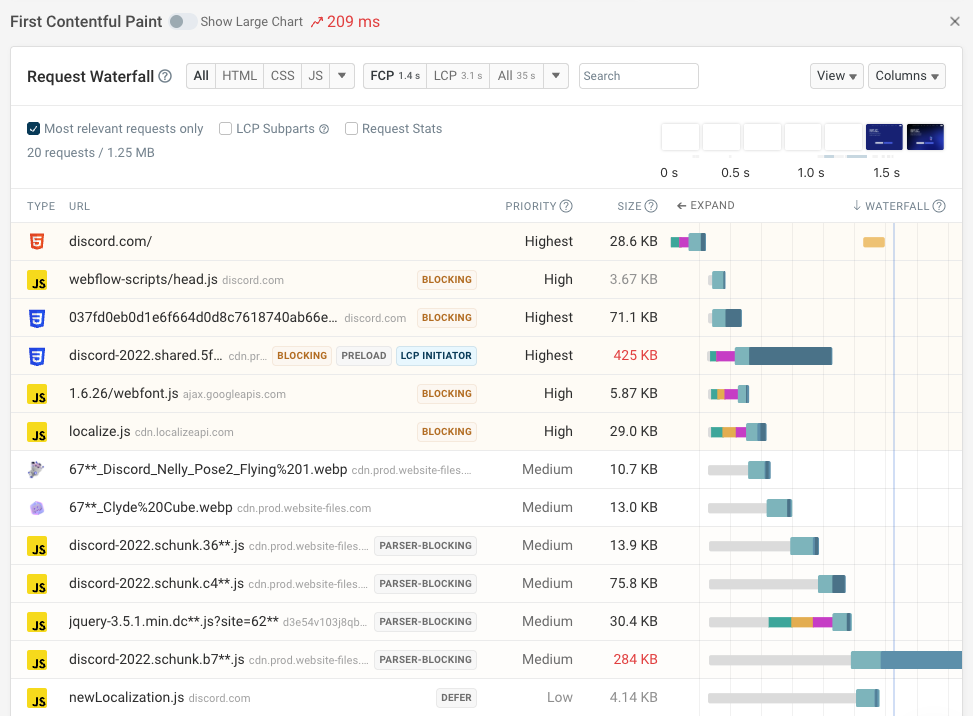
The detailed page speed checks help you identify specific optimizations that would make your website load faster. DebugBear shows you detailed information about how your website loads and which technical aspects impact that. For example, the request waterfall shows you when different files load, which requests the browser prioritizes, and how that impacts what visitors can see on the page as it's loading.
You can also try out optimizations without deploying code by running site speed experiments.
DebugBear is best if you need uptime and performance monitoring with detailed reporting. It does not provide public status pages or incident management functionality.
2. Site24x7: Website and infrastructure monitoring
Site24x7 is a digital experience monitoring and observability platform that provides availability monitoring, log management, real user monitoring and more.
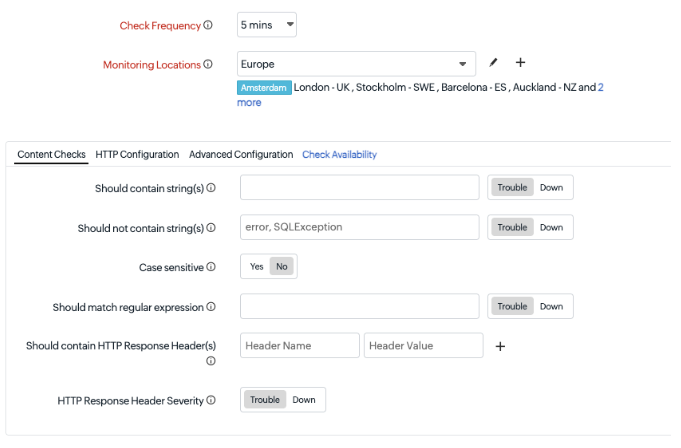
Site24x7 offers a large number of different monitoring types and lets you perform detailed checks from a number of test locations. For example, you can look for specific strings in the response body or check for HTTP header values. The checks can run as often as every 10 seconds.
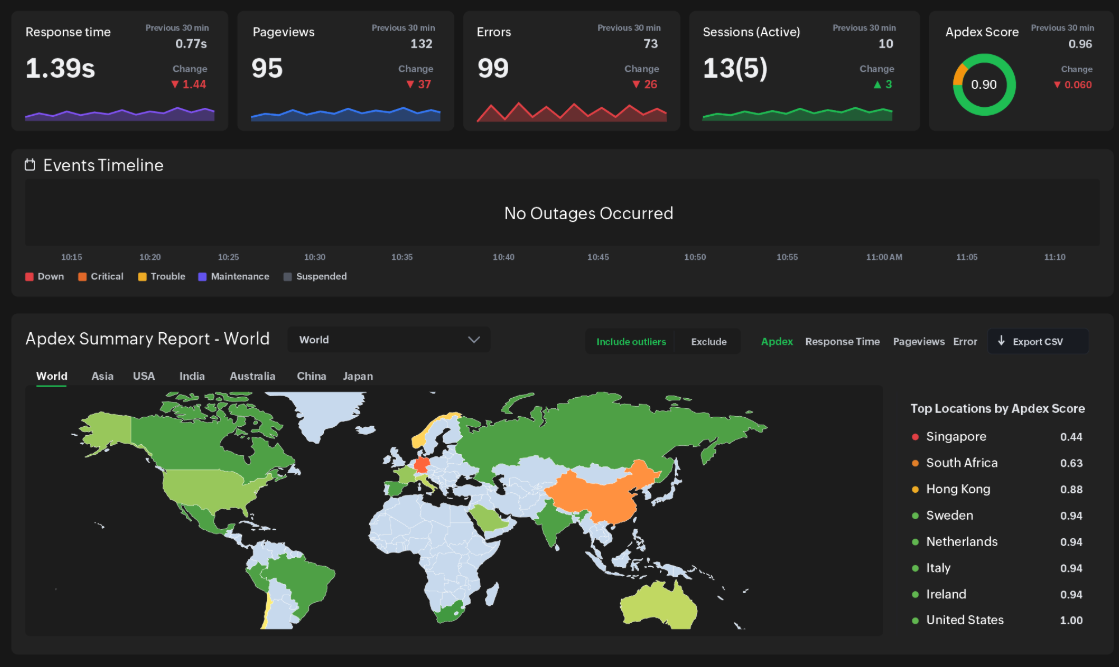
The real user monitoring feature works for web apps as well as mobile applications on Android or iOS. It tells you about your website speed, errors, and visitor counts.
This data can tell you when visitors are having a poor experience, for example due to slow load times or broken functionality.
Site24x7 also covers backend monitoring with features like log management, database monitoring, and cloud monitoring.
It's a comprehensive tool for IT teams, but only provides limited detail on website performance issues.
3. Pingdom: Established uptime and synthetic monitoring
Pingdom is an established monitoring tool that provides uptime monitoring, synthetic page speed checks, and real user analytics.
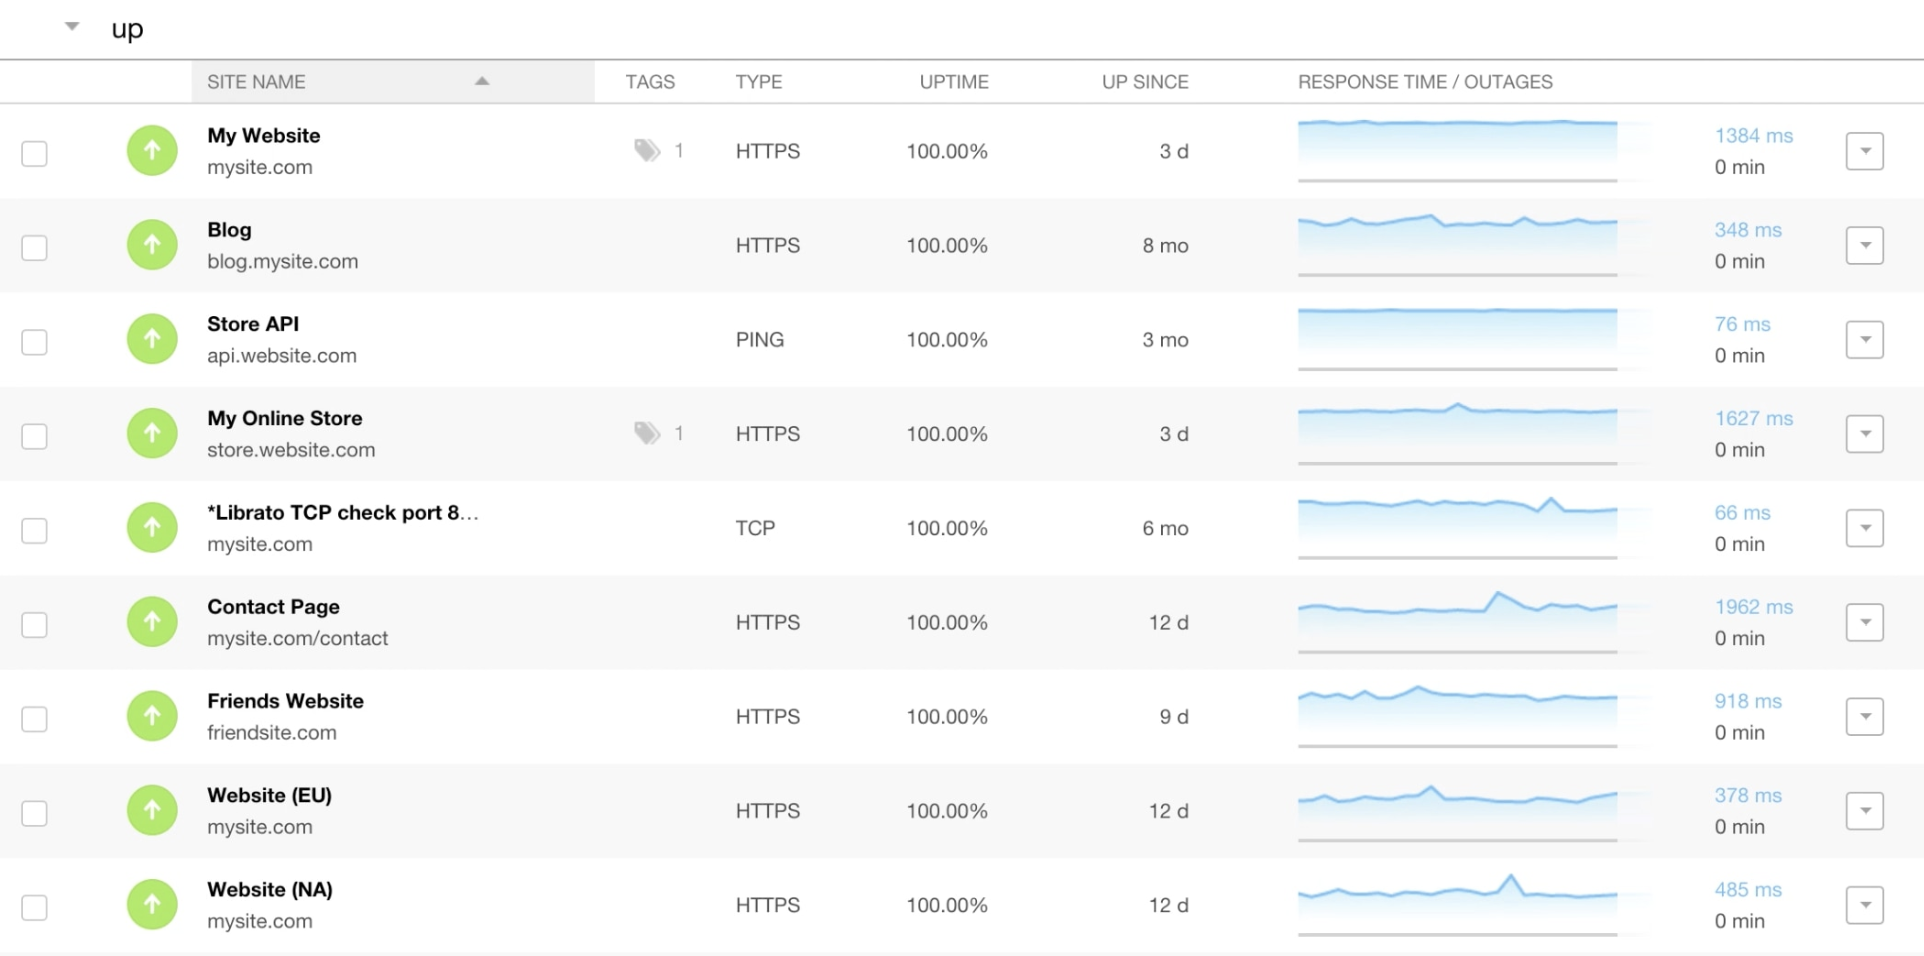
Regular uptime checks track server response time and show how long it's been since the last outage.
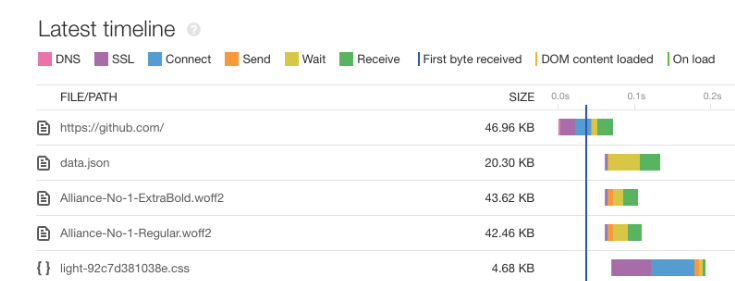
Pingdom's page speed monitoring provides a request waterfall that shows when different resources on your website load.
Those details help you identify what changes would speed up your website.
Pingdom provides a basic monitoring suite for marketing and IT teams, but the page speed reports stop short of Core Web Vitals and the detailed diagnostics that newer tools offer.
4. StatusCake: Uptime, page speed, and status pages
StatusCake helps you monitor your website status and communicate with customers.
You can run uptime checks from different locations, set up custom status pages, and identify the root causes of downtime.
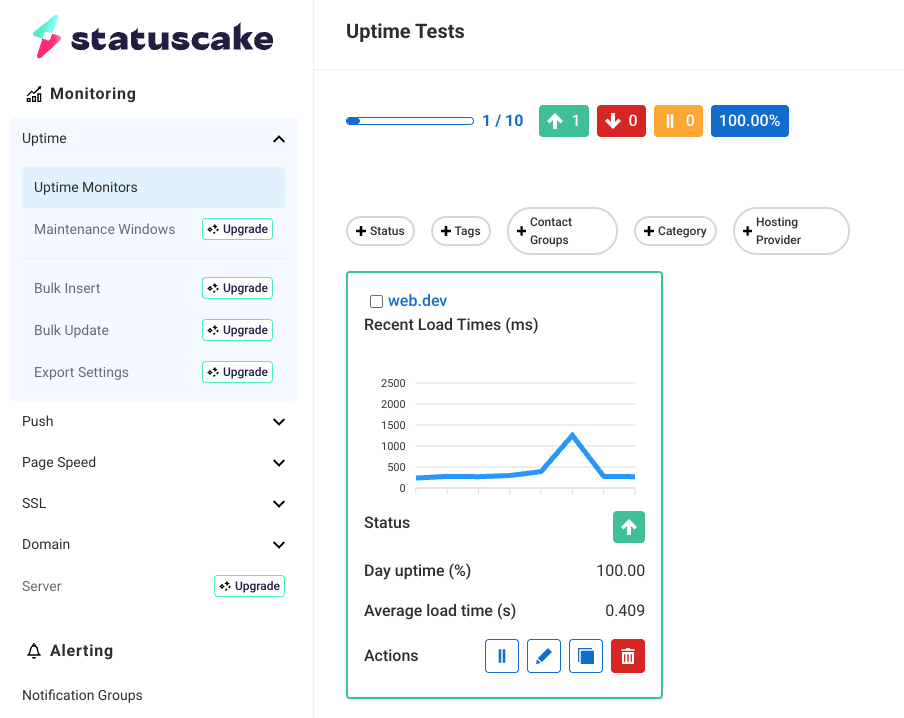
You can also run more detailed page speed checks that verify load time, page weight, or request count.
The page speed checks also show you what resources are loading and what file types are responsible for most of your site's download weight.
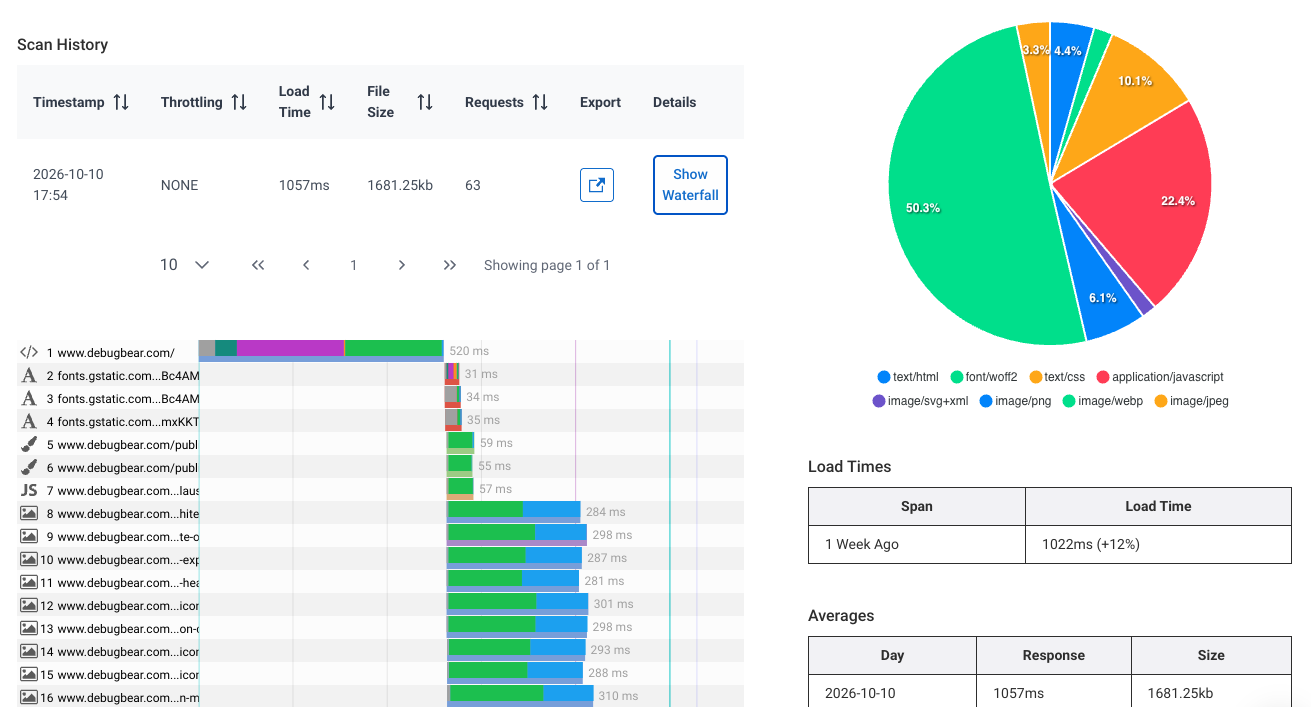
StatusCake is a good entry-level option to cover key aspects of visitor experience, but it does not provide real user metrics or detailed page speed reporting.
5. Oh Dear: All-in-one website checks
Oh Dear monitors key aspects of website health that matter to development and marketing teams. For example, you can track Lighthouse scores, certificate health, or broken links.
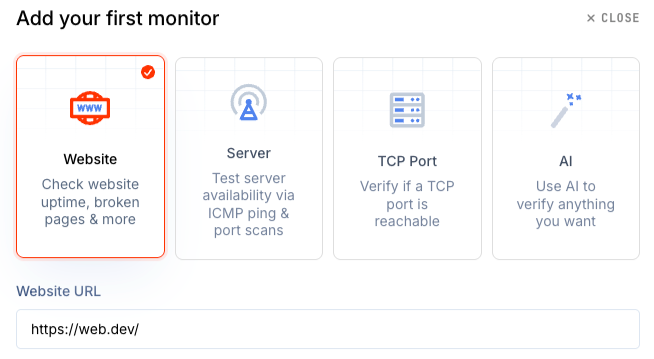
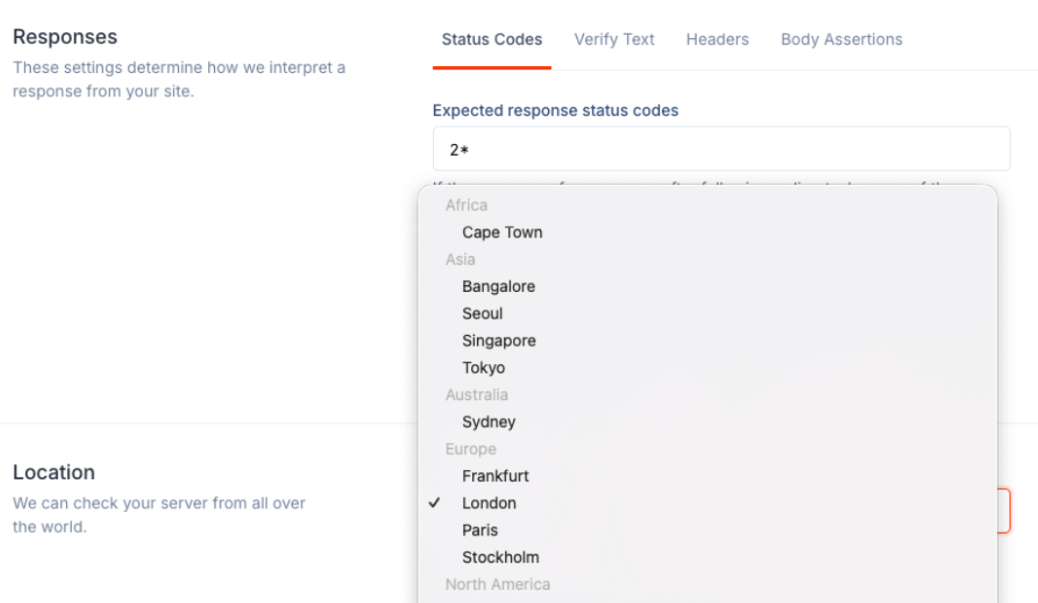
You can configure your uptime checks to run from different locations across the world and verify response status codes, headers, and text content.
Status pages are generated from your monitors. If you need to update customers during an incident, you add a note to the status page and pick a severity level.
Oh Dear is a modern tool that's easy to set up and provides a range of configuration options, though it doesn't offer the same reporting depth as other tools.
6. Checkly: Monitoring as code for developers
Checkly is a developer-focussed monitoring tool that lets you monitor uptime and run detailed synthetic checks.
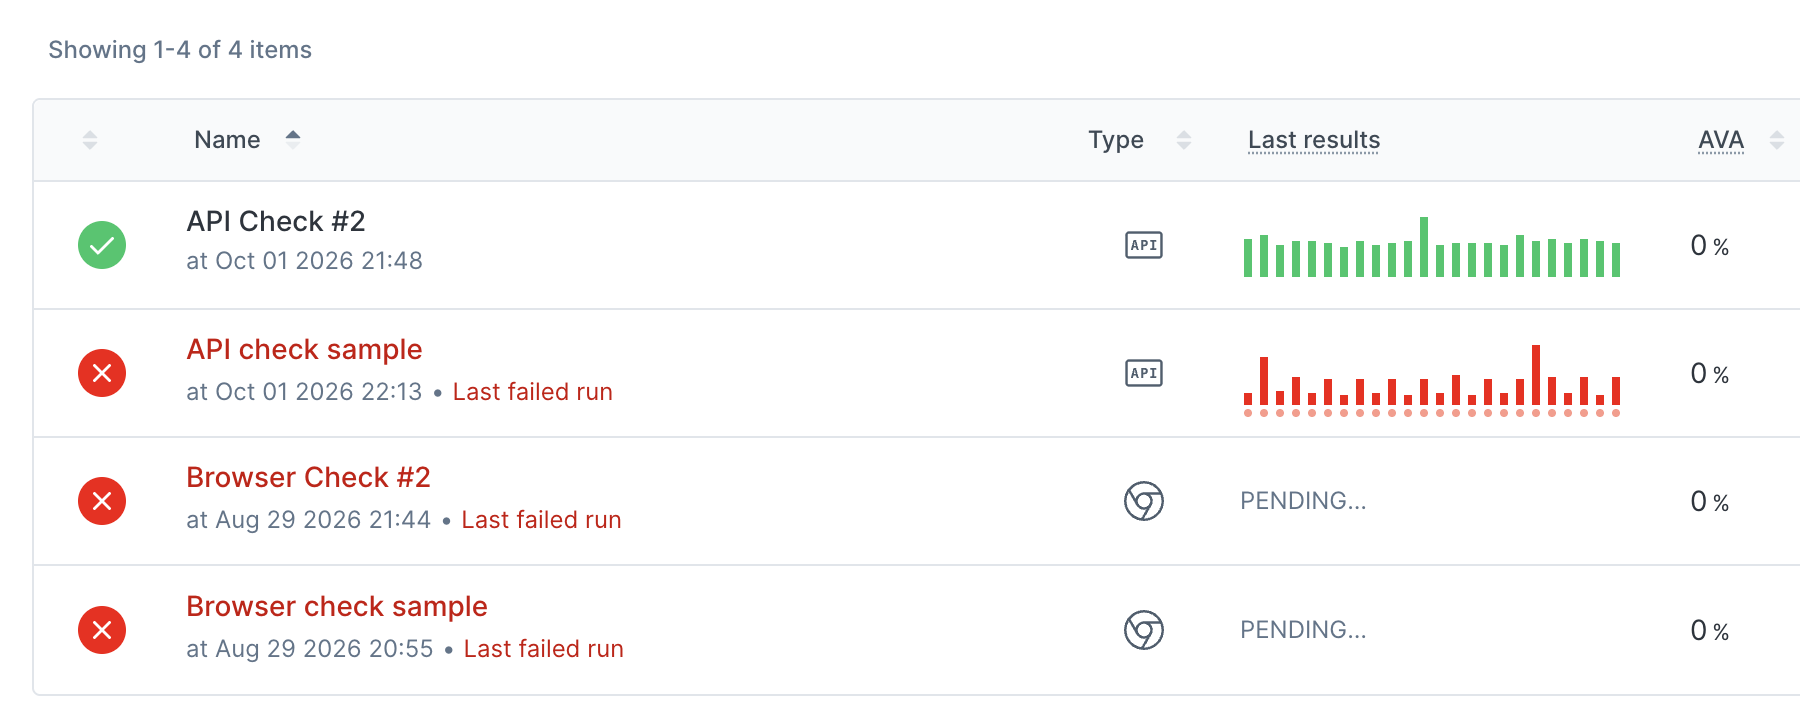
The tool supports a range of different monitors, for example browser checks, API checks, DNS monitors, and heartbeat monitors.
Browser checks let you configure detailed Playwright scripts and define specific test expectations to check inside your JavaScript code.
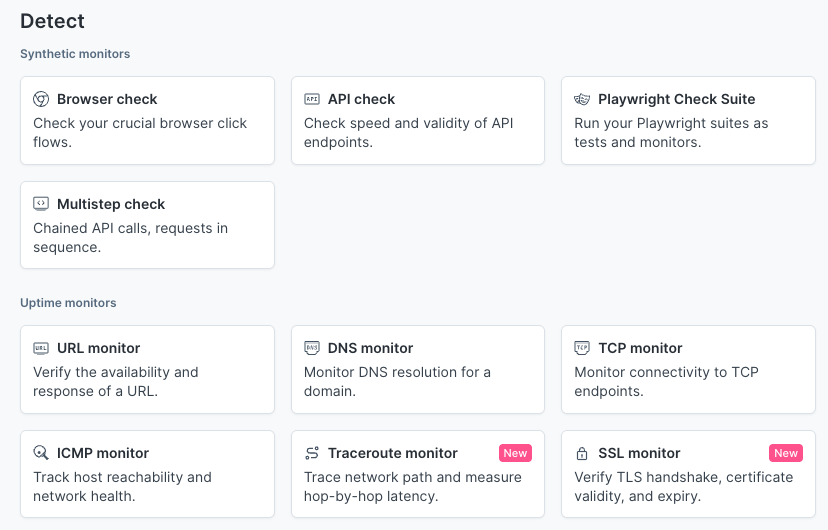
Checkly also lets you set up status pages and send alerts to channels like Slack, Discord, or SMS. It does not offer real user data or more marketing-friendly page speed reports.
How to choose
If you need both availability monitoring and page speed tracking, DebugBear is the strongest option.
Site24x7 provides more comprehensive monitoring coverage for IT teams. Checkly's strength lies in its flexible and developer-friendly transaction monitoring.
Pingdom is a safe choice if you want an established vendor and only need basic page speed data. StatusCake is an affordable entry point for uptime checks plus status pages, and Oh Dear is a good fit if you want broad site health checks with minimal setup.
For a longer list of options, see our comparison of the best uptime monitoring tools.
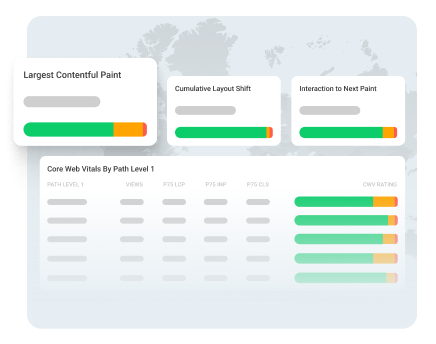
Monitor Page Speed & Core Web Vitals
DebugBear monitoring includes:
- In-depth Page Speed Reports
- Automated Recommendations
- Real User Analytics Data