Uptime Monitoring
Uptime monitoring helps you detect website outages quickly before they impact your users.
DebugBear can run automatic checks as often as every minute to continuously verify that your site is available and responding as expected. When downtime occurs, you'll get notified right away.
Uptime checks can validate status codes, page content, and more to help ensure your website is working properly.
How to set up uptime monitoring
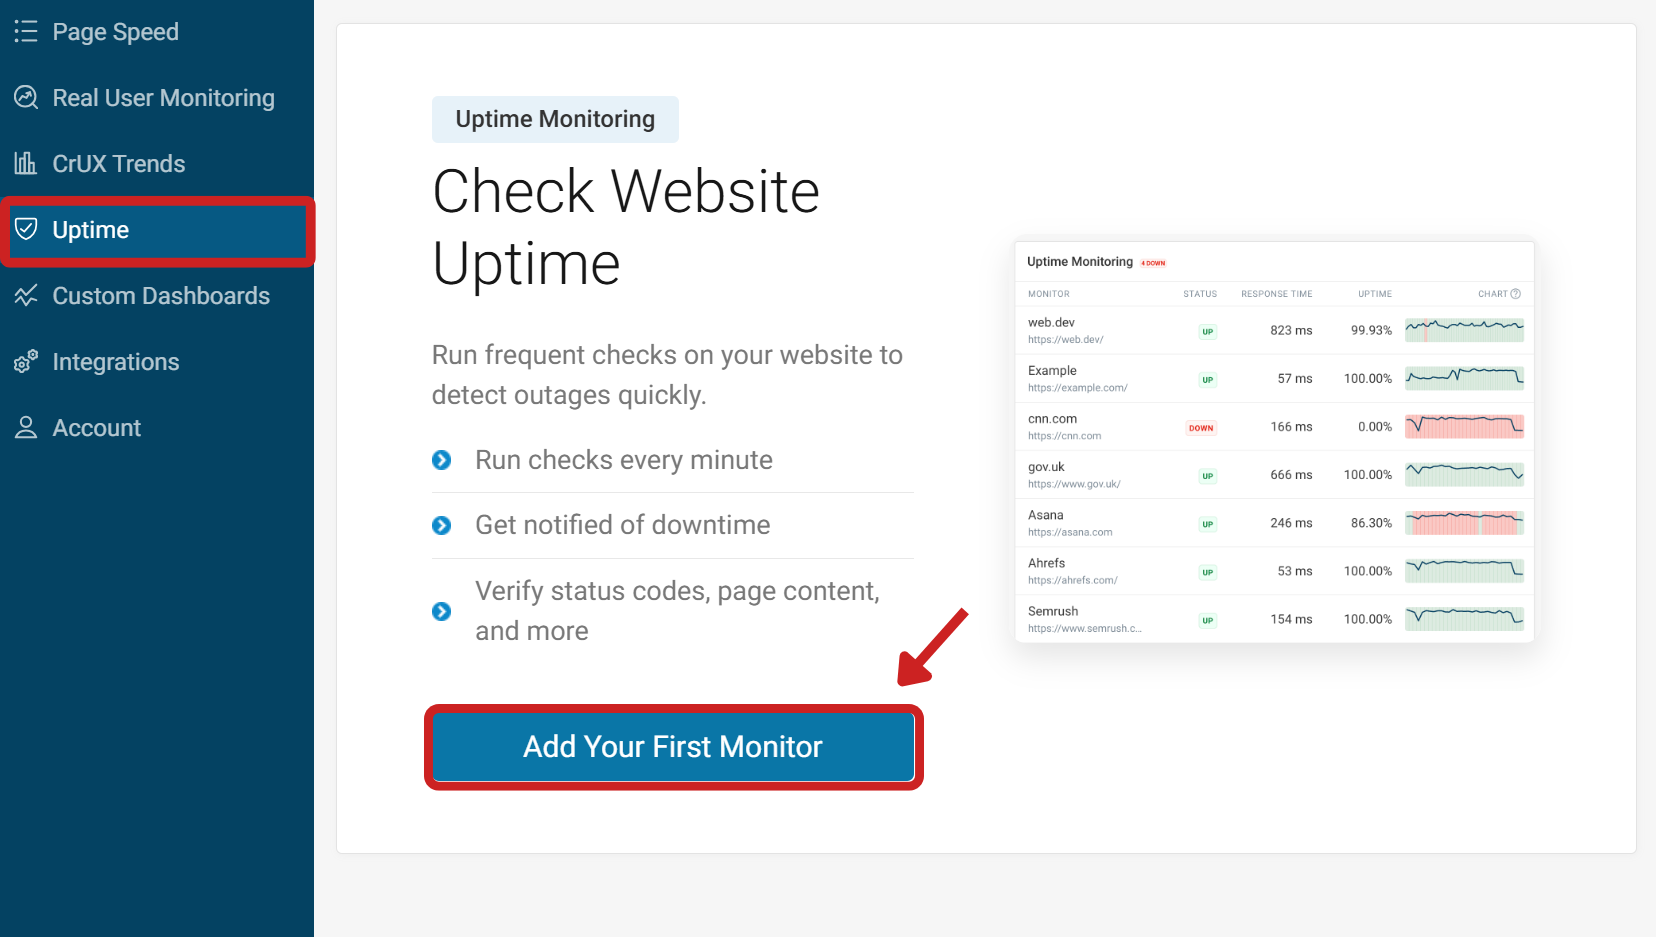
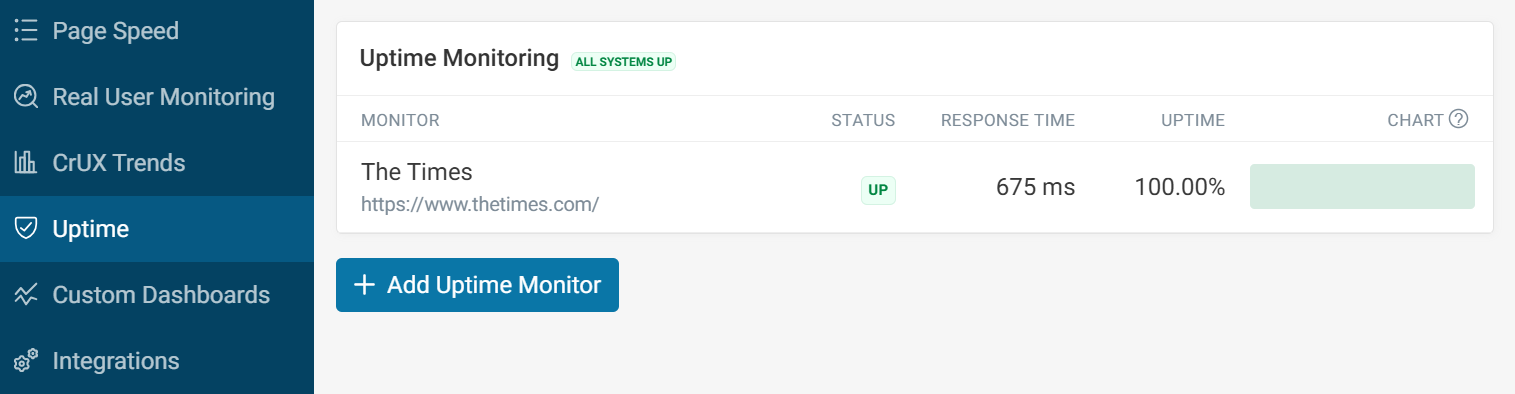
The Uptime Monitoring dashboard can be found in the project sidebar. To get started, click Add Your First Monitor.
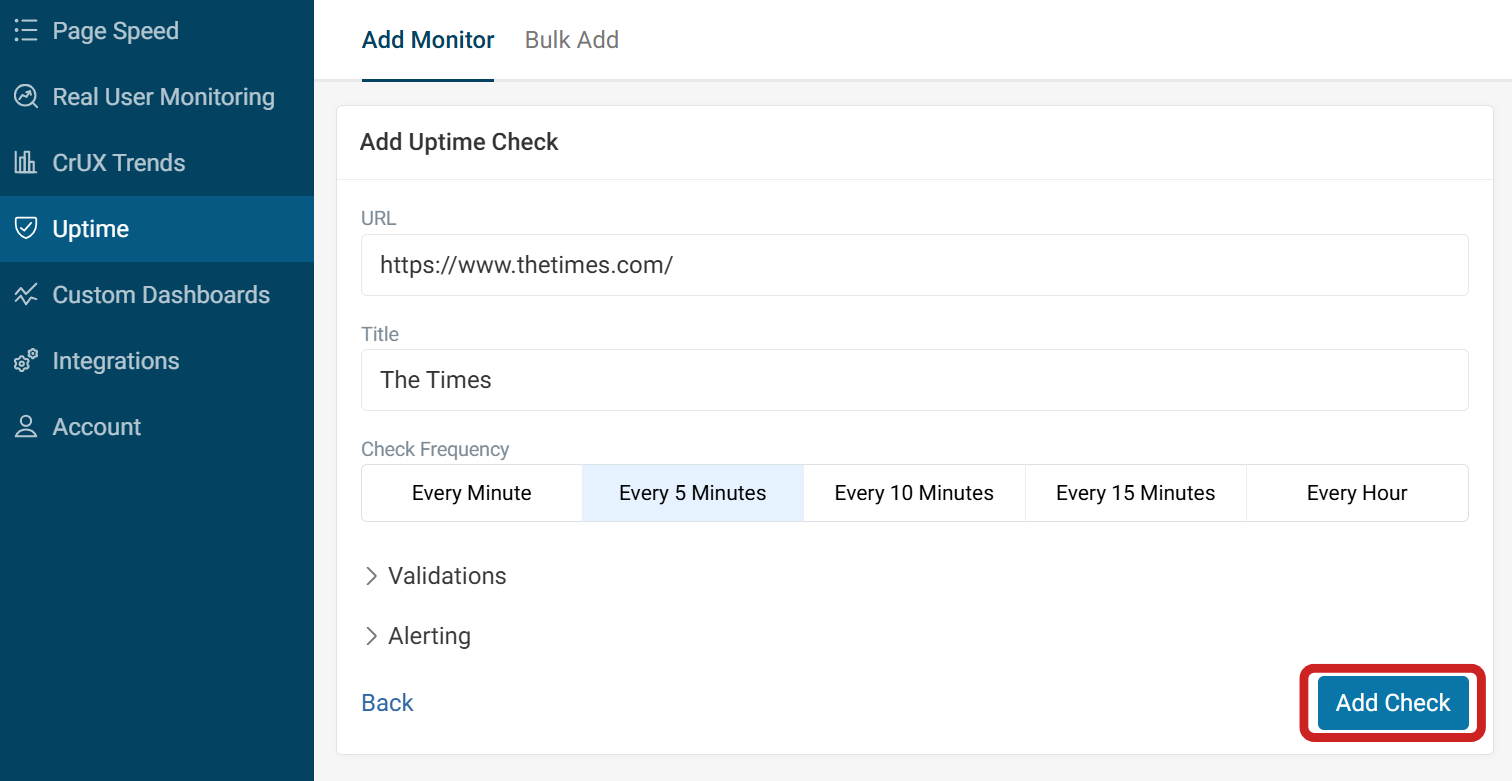
You will then need to add a URL and a name for the monitor. The check frequency setting decides how often an uptime check is run. There are five options to choose from:
- Every minute
- Every 5 minutes
- Every 10 minutes
- Every 15 minutes
- Every hour
After setting up the URL to monitor and the check frequency, click Add Check.
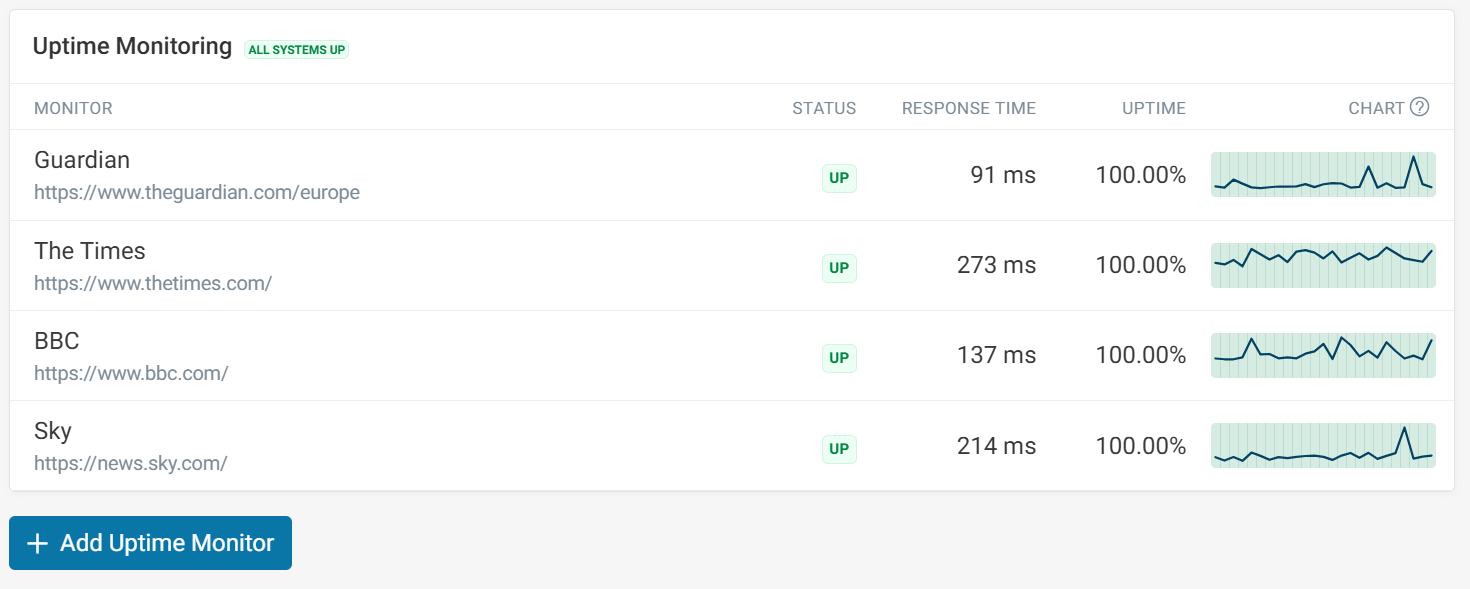
After adding the first monitor, the dashboard will be created.
Bulk add
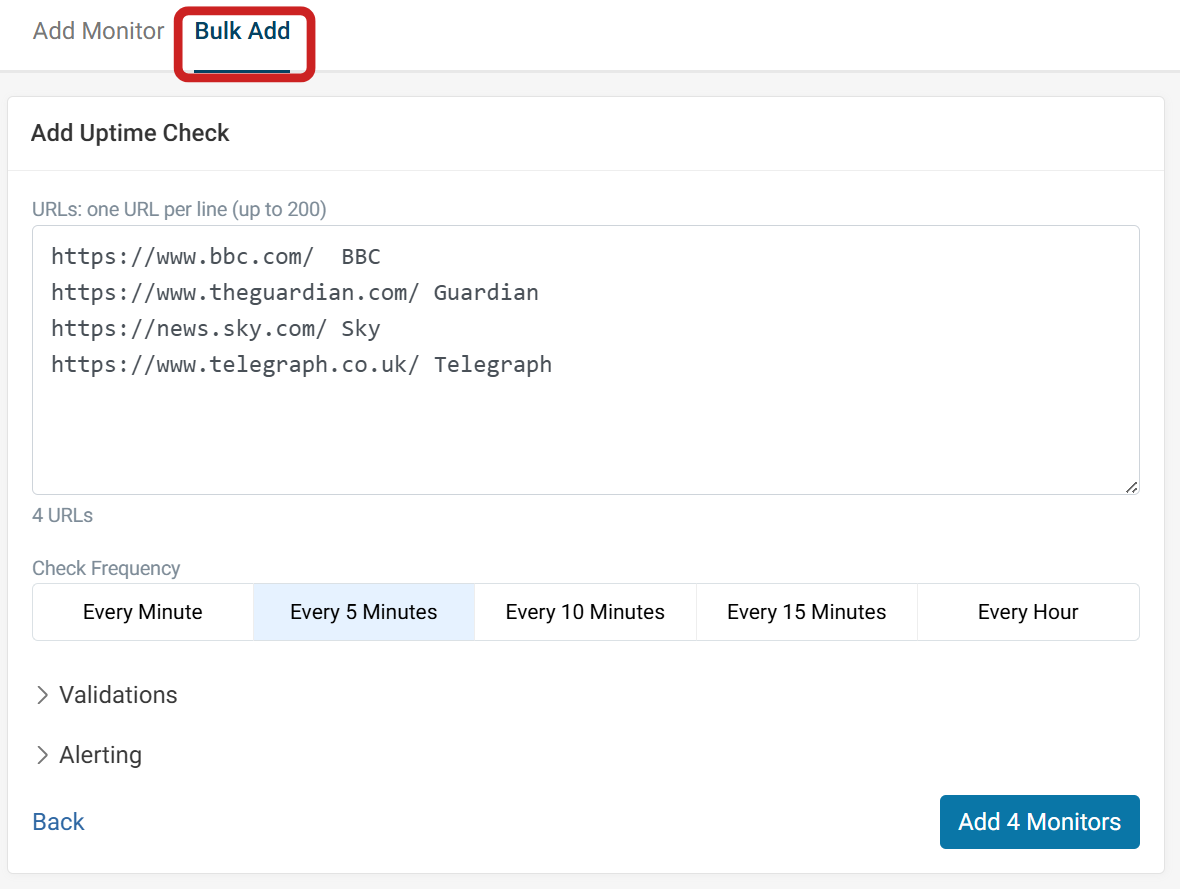
Multiple monitors can also be added via the bulk add option.
Put one URL on each line. By default an automatic monitor title will be generated, but you can also add a space after the URL followed by the title you want to use.
Monitor dashboard
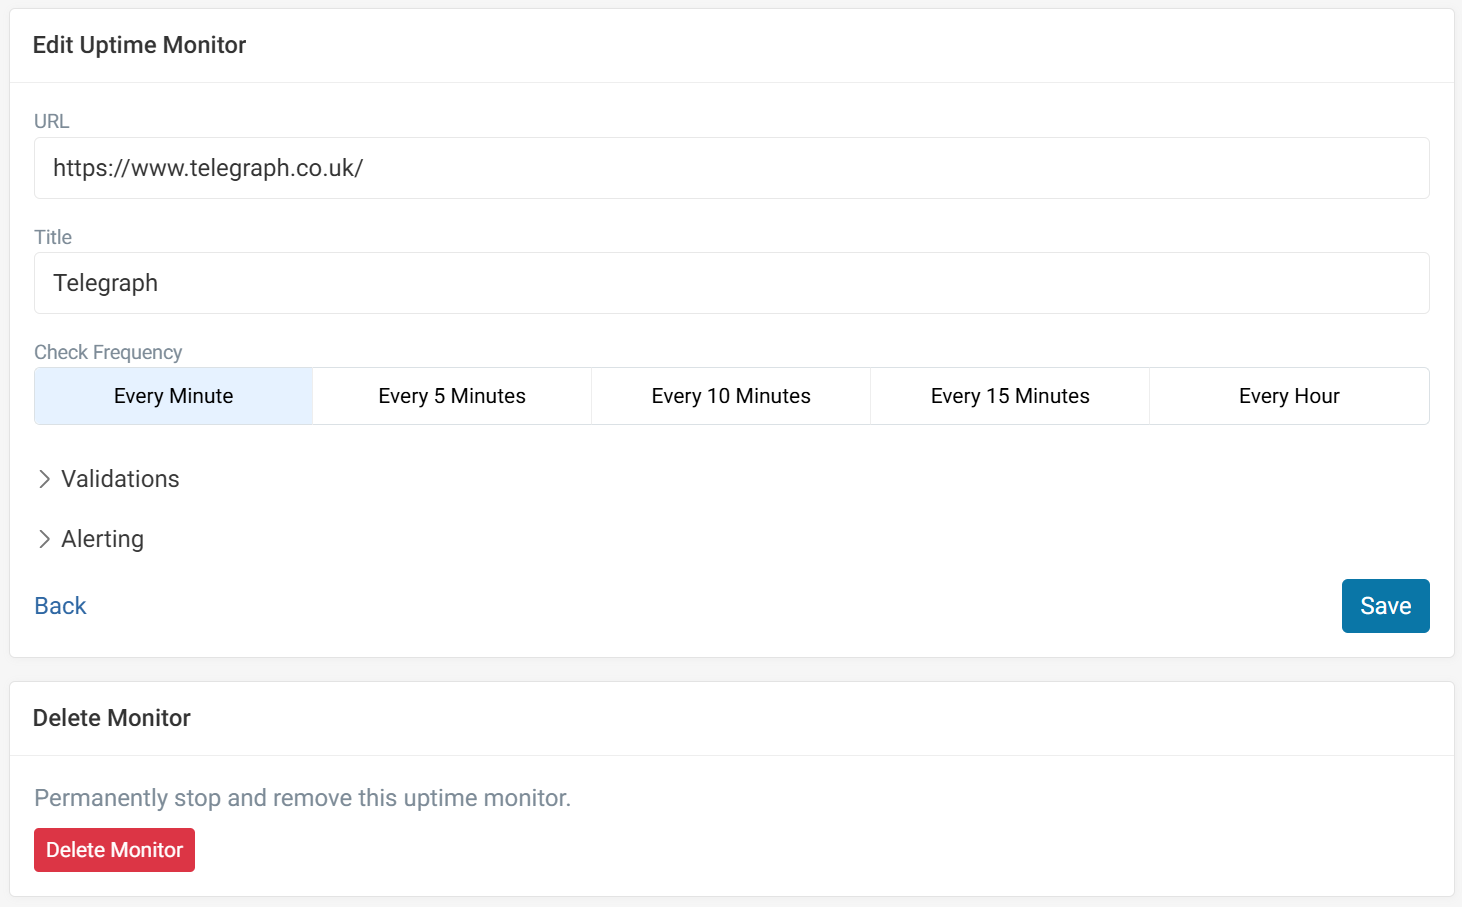
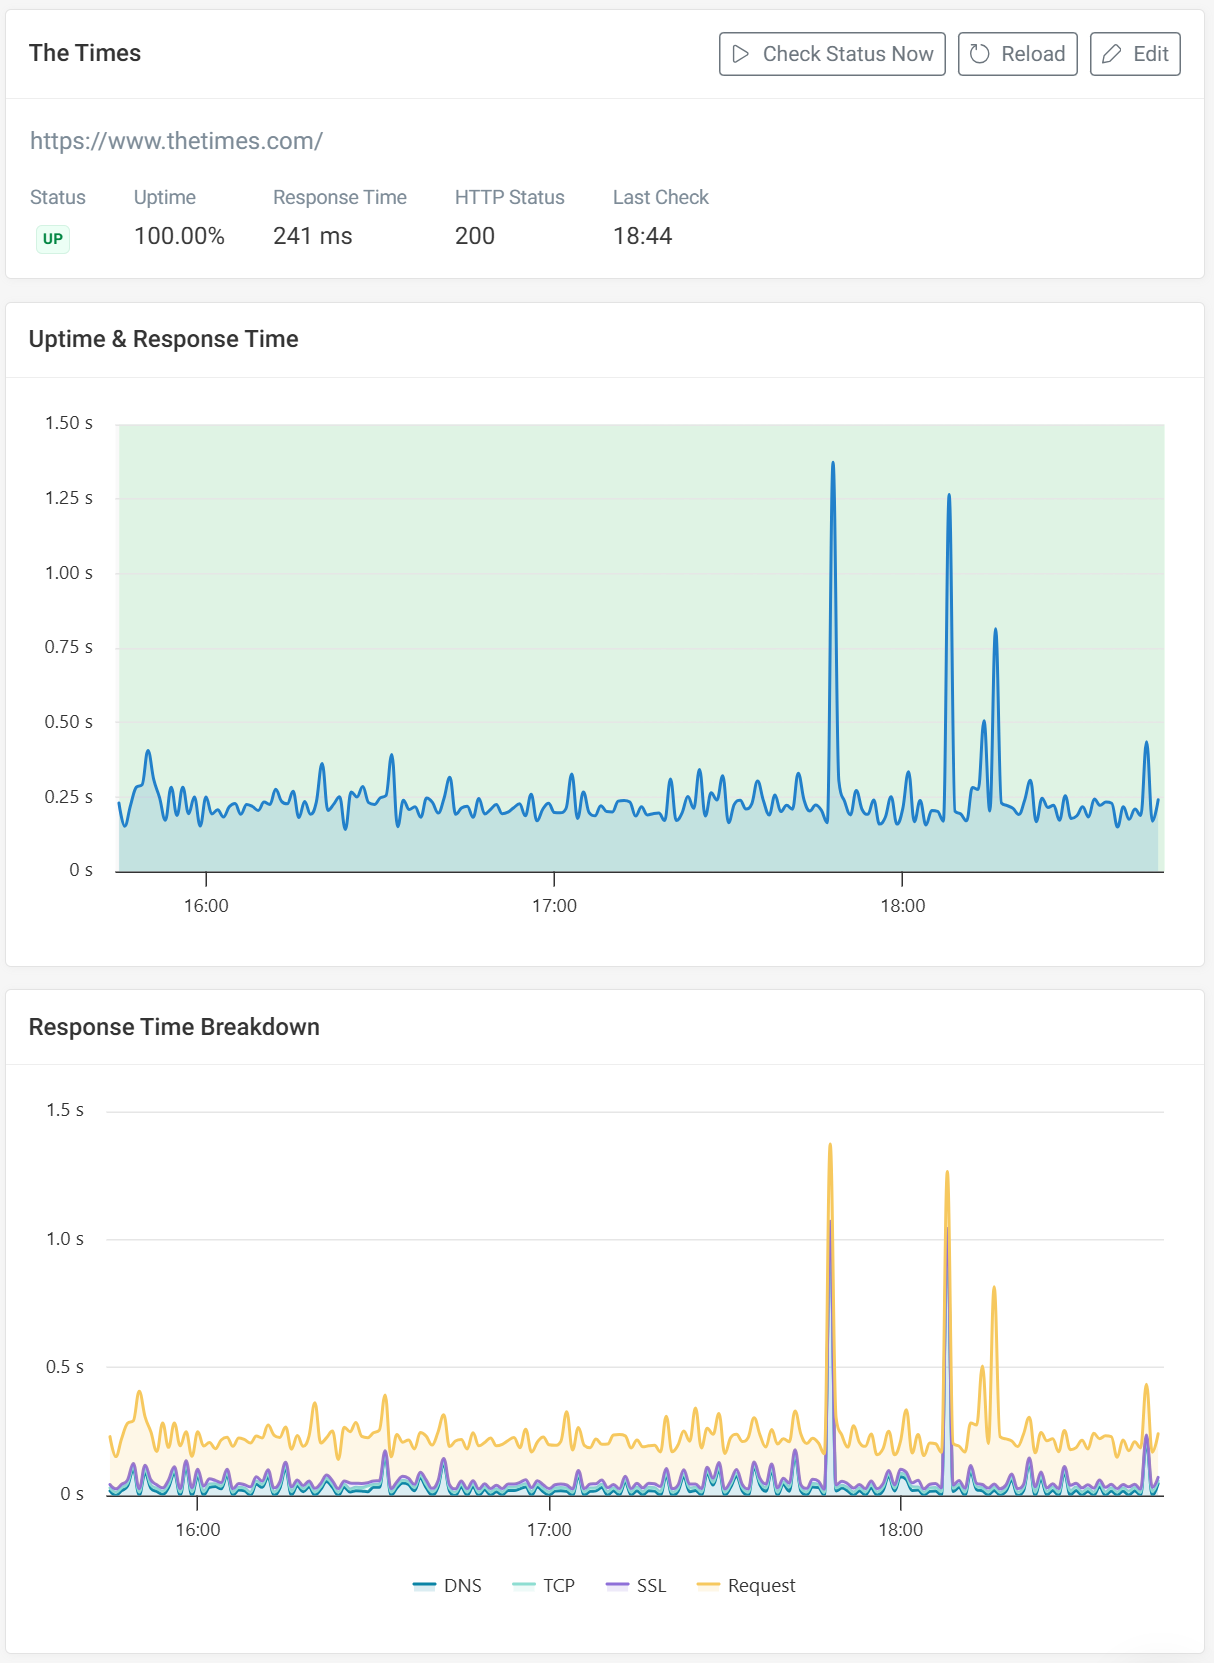
Clicking into an individual monitor will present the history of the URL's uptime. The most recent check result is listed at the top, with options to check the status manually and edit the monitor configuration.
The Uptime and Response Time chart combines both metrics in a single view. The green background represents the uptime status at that specific moment, while the blue graph shows the median response time.
Below the Uptime and Response Time chart is the Response Time Breakdown, which shows the individual response times of each component: DNS, TCP, SSL, and request time.
Any recent incidents are listed at the bottom of the monitor page, along with the incident timings and cause of the downtime, such as the 403 status in this example.

Uptime validations
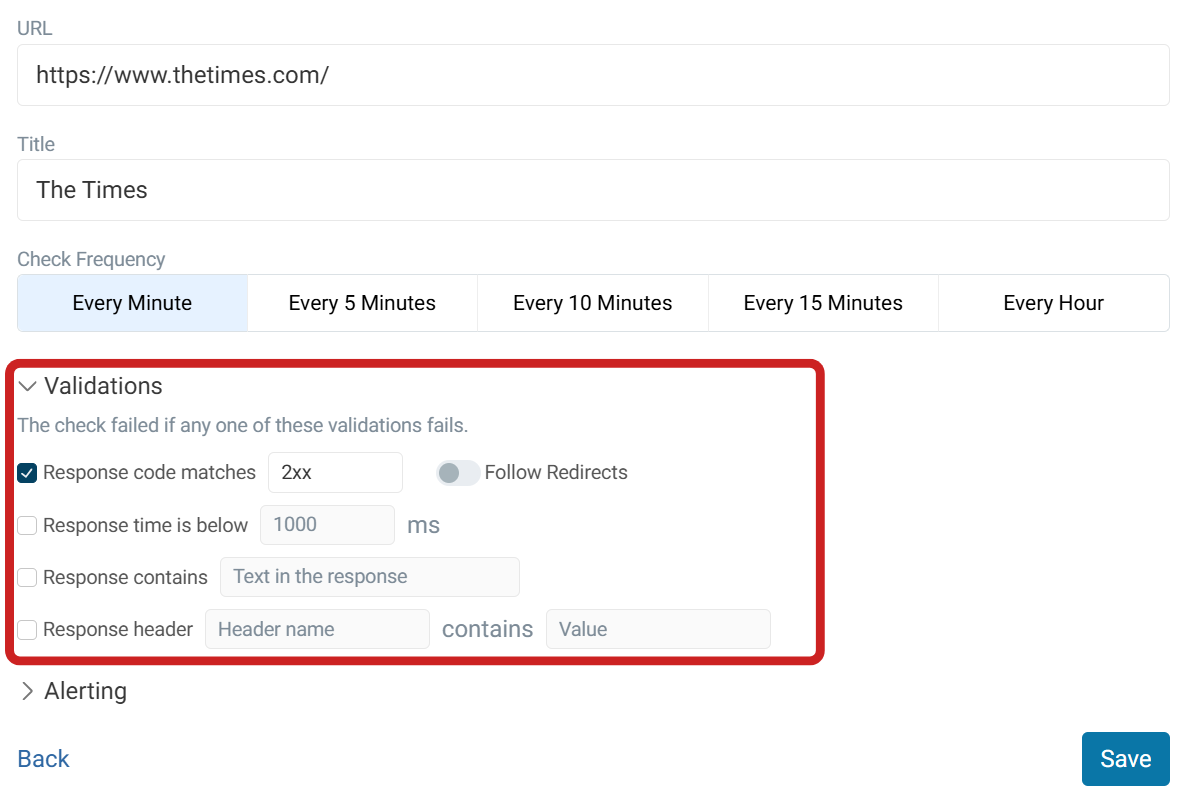
You can define what counts as an outage. That could be an error response code, a slow response, or missing text in the response body.
There are four validation options.
Response code matches
This is the only validation set by default. It checks for a 2xx response code, confirming that the website is live and returning a successful response. You can change it to check for other outcomes, such as 404 for a page that isn't found or 500 for an internal server error.
By default, the check does not follow redirects. For example, if you monitor a short link used in a marketing campaign that redirects to your landing page, the check will only verify that the redirect itself is working, not the page the URL points to.
Consider turning on the Follow Redirects toggle to also confirm the destination page loads successfully.
Response time below
As seen in the Response Time chart in the check dashboard, we track the page's median response time. You can set a threshold to ensure that the response time is aligned with your performance goals. For example, if you set a threshold of 1000 ms and our check returns 1200 ms, then the check will fail.
Response contains
Checking for specific text in the response is a great way to ensure that the page is working correctly. For example, the visitor may be able to access the page but not find the correct content. Checking for text relevant to your website, such as "Buy Now", can help identify such cases.
Response header
Checking a header name and value is another way to verify that the page is working correctly. A simple example would be checking that the response includes a Content-Type header (the header name) containing text/html; charset=UTF-8 (the header value).
Alerts
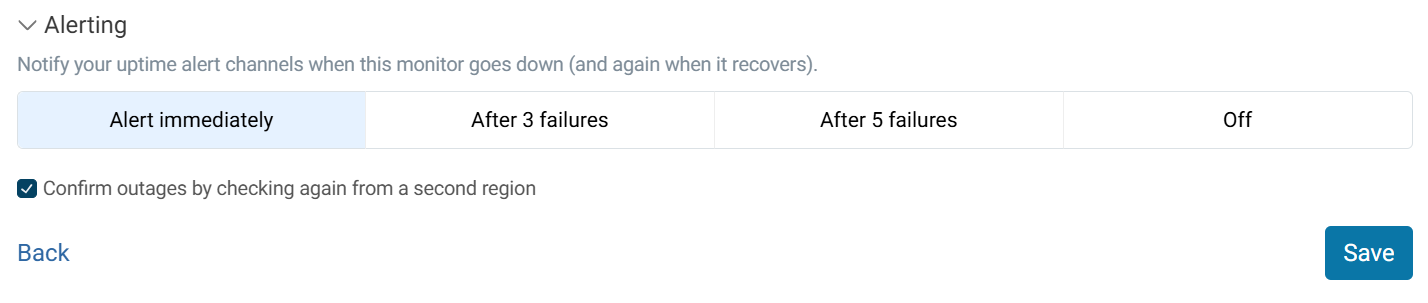
By default, alerts are set to be sent immediately when a monitor goes down.
You may not want to be alerted immediately when a check fails. Other options include waiting for three or five consecutive failures. If you don't want to receive any alerts, select Off.
Before alerting, monitors are checked again from a second region to verify the status. This can be disabled by unchecking Confirm outages by checking again from a second region.
See Uptime Alerts for when alerts are sent and what they contain.
Configuring alert notifications
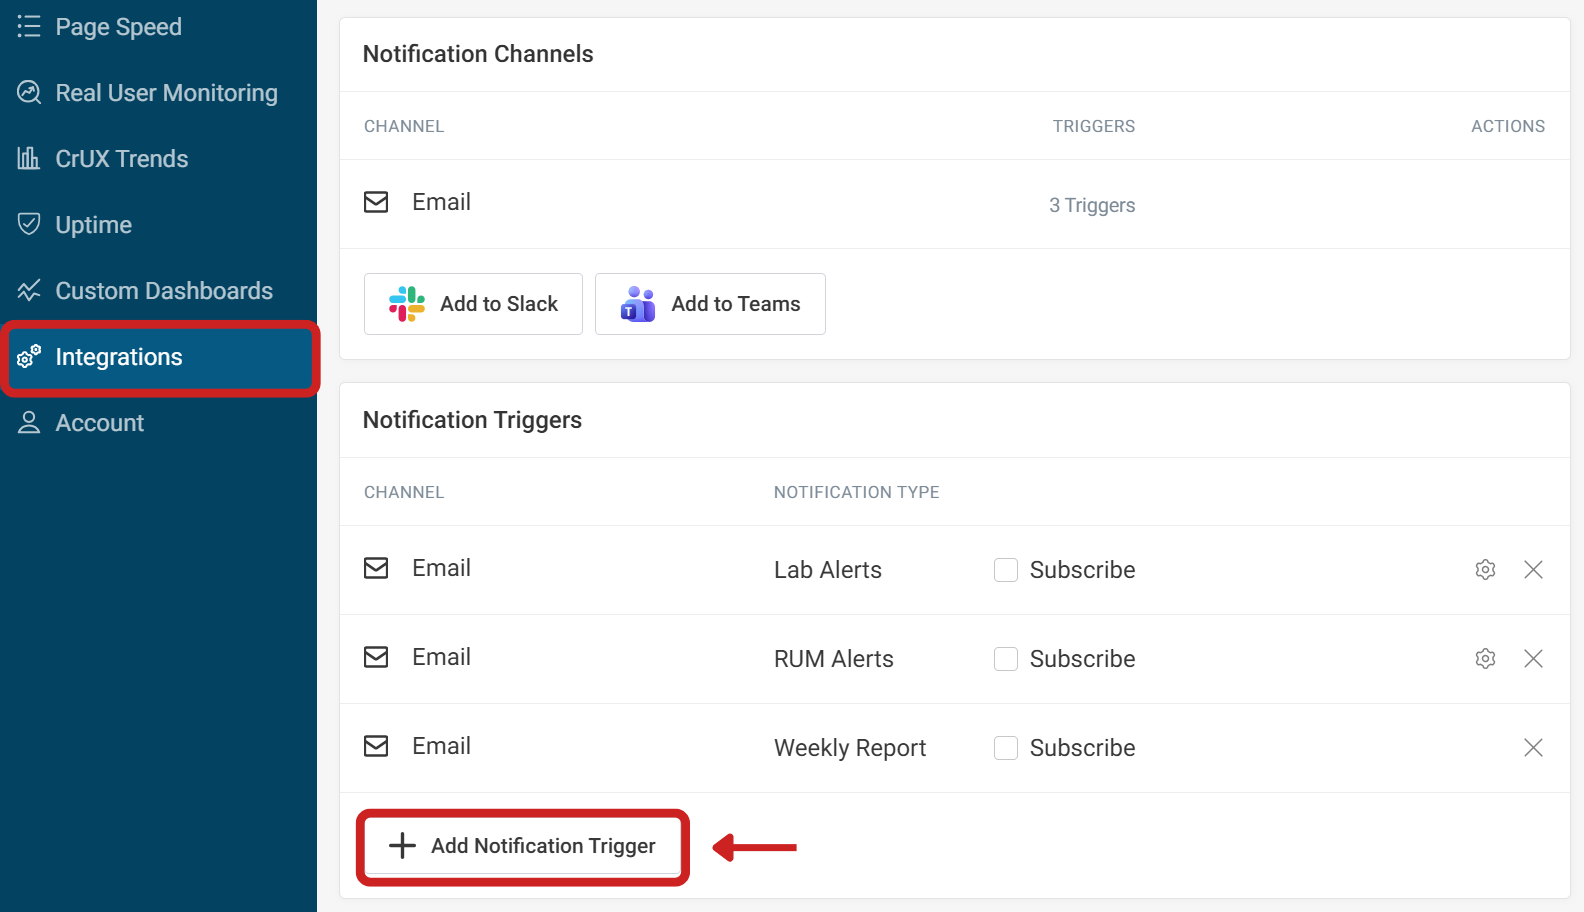
To send uptime alerts to your email or to your work channel, select Integrations from the project sidebar. Click Add Notification Trigger to create a new notification channel.
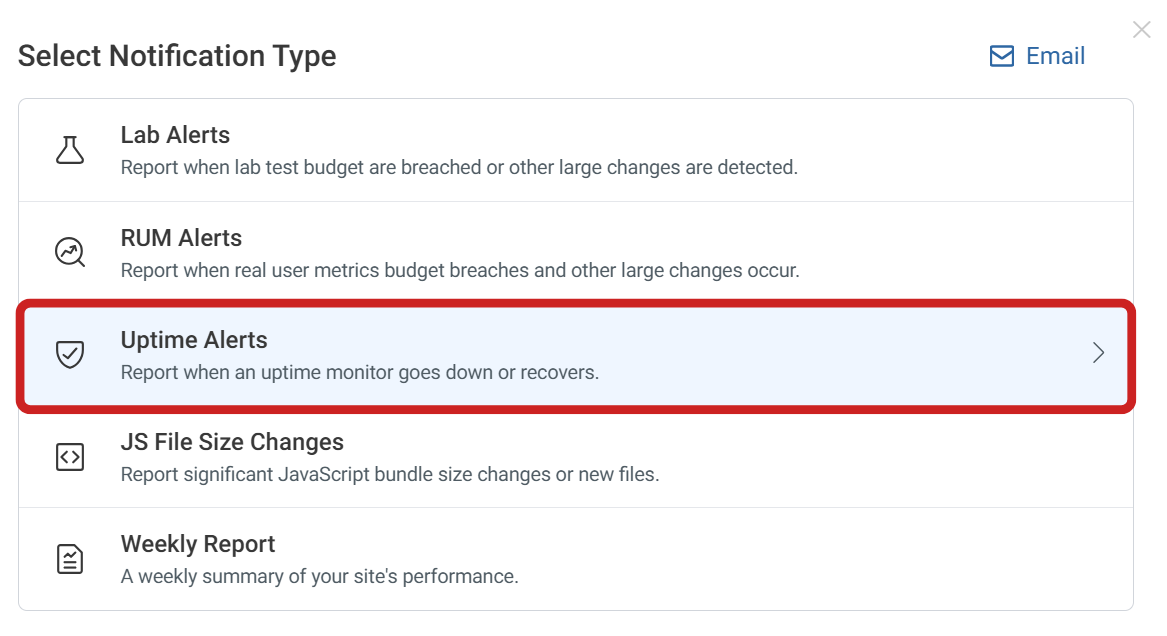
After selecting a channel where you want to receive the alerts, select Uptime Alerts from the list.
Deleting monitors
Monitors can be deleted by clicking the Edit button on the monitor's dashboard, then clicking the Delete Monitor button at the bottom of the configuration settings.