Measure And Optimize Time to Interactive (TTI)
Google's Time to Interactive metric is one way to measure the page load time of a website.
This article explains how you can use this metric to assess your website speed and what you can do to improve your Time to Interactive scores.
What is Time to Interactive?
Time To Interactive (TTI) is a lab metric used by Google to diagnose issues that could impact website performance.
While a page can look interactive and responsive, it doesn't necessarily mean that it is. Additional code may be loading after the initial render, causing CPU processing that can hurt performance. TTI measures the time from when a page begins loading to when the main page resources have been loaded and the page can reliably respond to user activity.
TTI used to be one of the metrics reported by Google Lighthouse, but was then removed. However, it still impacts the Total Blocking Time metric, as tasks after the TTI milestone don't contribute to blocking time.
How is Time to Interactive defined?
For Lighthouse to recognize that the page is ready for interactions, the following criteria have to be fulfilled:
- Content is displayed on the page, as measured by the First Contentful Paint
- The network is quiet, and no more than two GET requests are in progress
- The page successfully responds to user interactions within 50 milliseconds, as tracked by the First Input Delay – in practice this means that the CPU is also mostly quiet
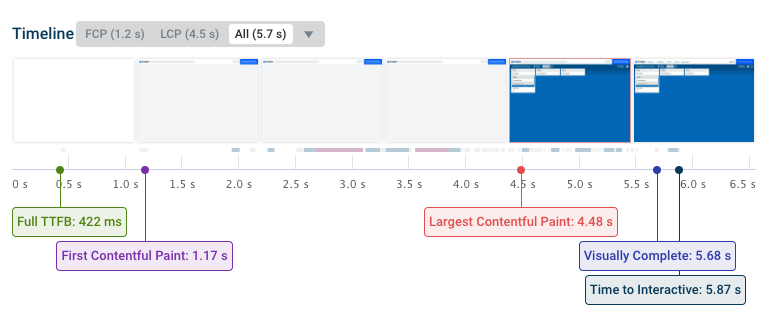
This timeline view from DebugBear shows that the Time to Interactive milestone is reached when the CPU becomes quiet. The small red and blue markers below the screenshots are CPU tasks.
What is a good Time to Interactive score?
A Time to Interactive score of 3.8 seconds or below is considered good.
Is Time to Interactive a Core Web Vitals metric?
TTI is not one of the Core Web Vitals metrics that directly impact SEO.
However, it's still useful as a diagnostic metric to see how quickly your website finishes loading and whether long tasks are causing poor Interaction to Next Paint (INP) scores. INP is a Core Web Vitals metric and can therefore impact your rankings.
How does Time To Interactive affect Lighthouse scores?
As of 2025, Time to Interactive no longer directly impacts the overall Lighthouse Performance score. However, it still impacts the Performance score indirectly through the Total Blocking Time metric, which determines 30% of the overall score.
In earlier versions of Lighthouse, TTI accounted for 10% of the Performance score.
How to improve Time To Interactive
Since Time To Interactive measures the interactivity of a page, analyzing JavaScript execution on the page is the first step to solving a potential performance bottleneck. The following optimizations are a good place to start:
- Reduce how much JavaScript code runs on the page
- Use code splitting to load only necessary code
- Review third-party JavaScript code
- Use Lighthouse to identify opportunities for optimization
Reduce and speed up JavaScript code
Remove and optimize as much of the JavaScript payload as possible. This reduces the time spent downloading, parsing, compiling, and running JavaScript code.
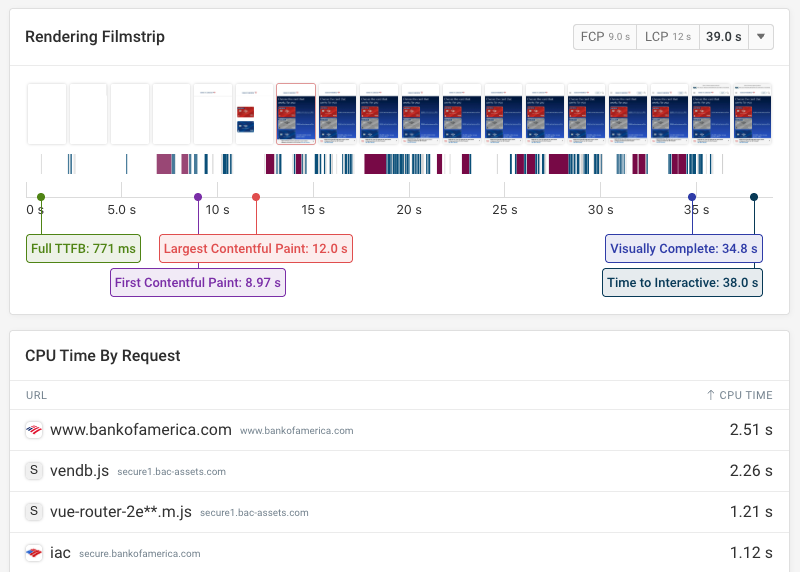
Modern browsers provide a Performance tab in the DevTools which gives you the ability to record page activity. Use this tab to gain insights about how time is spent when loading the page.
Implement code splitting
Use code-splitting to further reduce the impact of JavaScript on page speed. Use dynamic imports to only serve necessary JavaScript code.
Remove Third-Party JavaScript
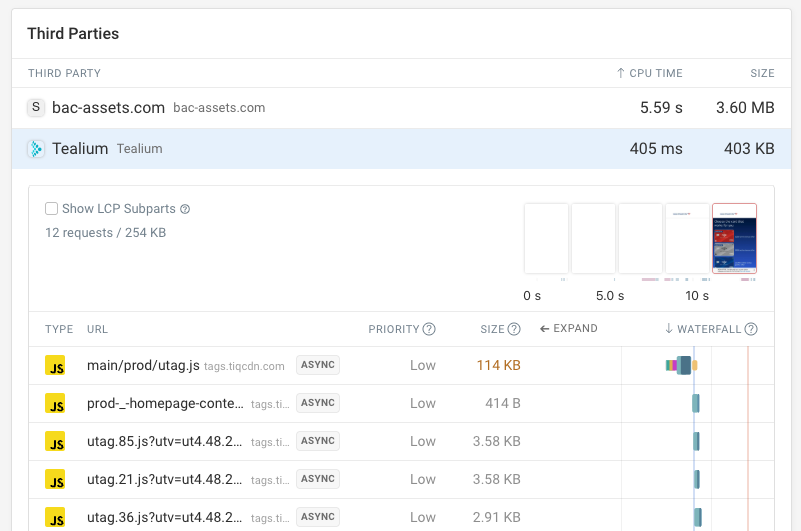
If your page depends on various external services, chances are that you're loading too much third-party JavaScript code.
Where possible, remove third-party scripts or only load them where necessary.
Identifying opportunities for optimization using Lighthouse
Every site suffers from different issues causing poor performance. The opportunities section of the Lighthouse report gives specific details of what is causing a poor TTI score, and how the page could be improved. Each opportunity has a link to further helpful documentation on how to implement these fixes.
Here's an example of the opportunities section in a Lighthouse report. We can see that we can improve page speed by removing unused JavaScript and not serving legacy JavaScript to modern browsers.
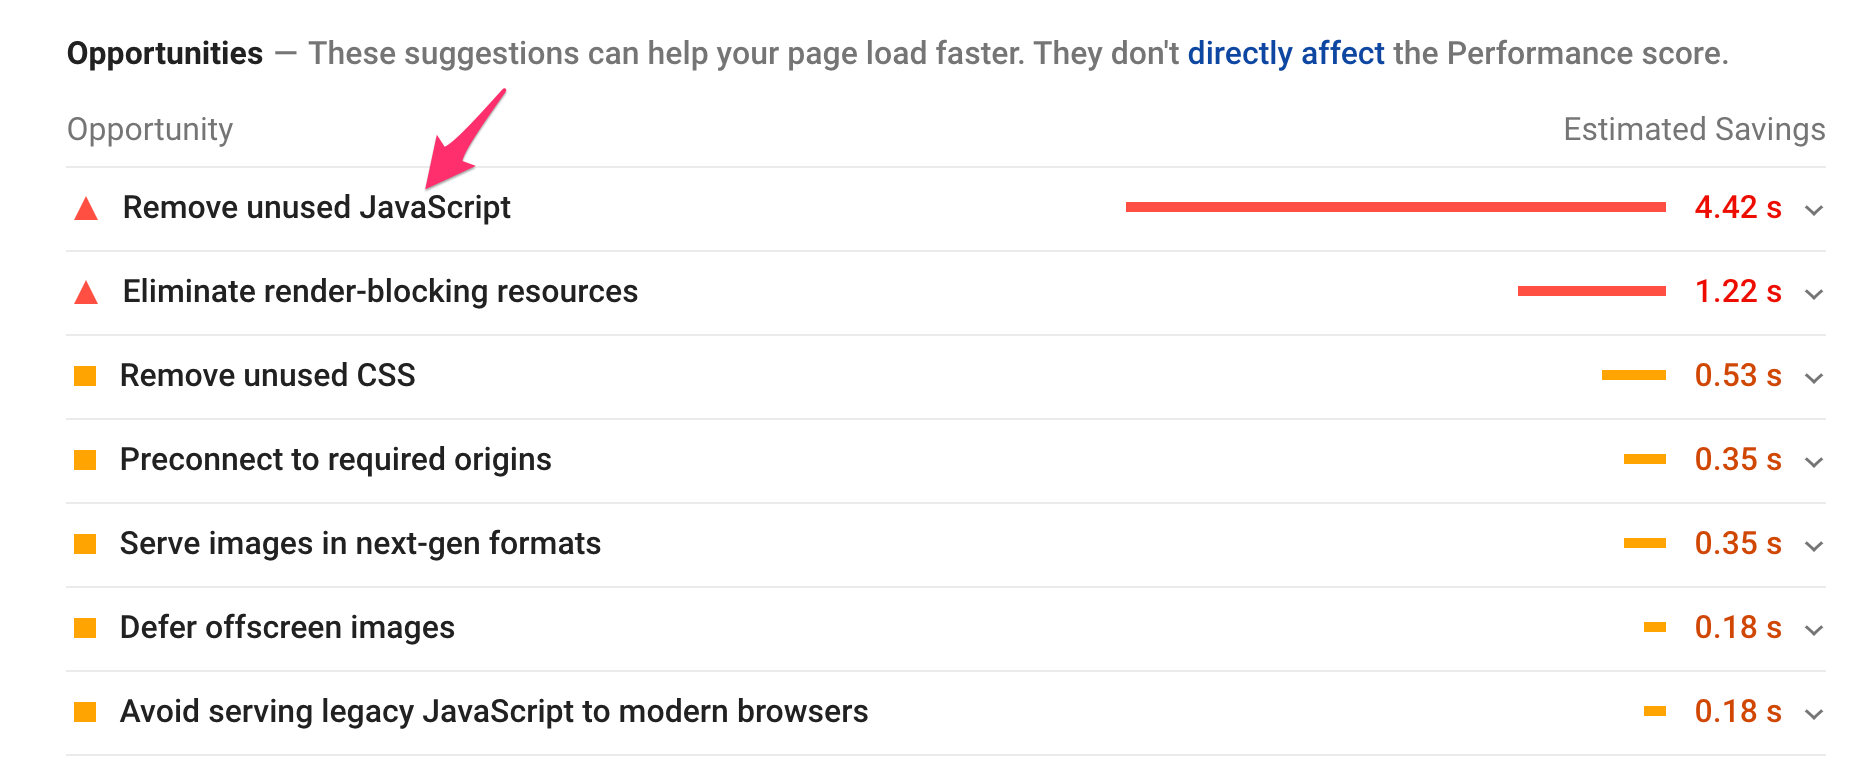
The best way to tackle these suggestions and improve performance quickly is to go from top to bottom, from the biggest issues impacting your page performance to the more low-impact ones.
Measuring Time To Interactive
Various tools can help you optimize your website's performance:
- Google's PageSpeed Insights diagnostic tool
- Lighthouse in Chrome DevTools
- DebugBear's Website Speed Test
Pagespeed Insights
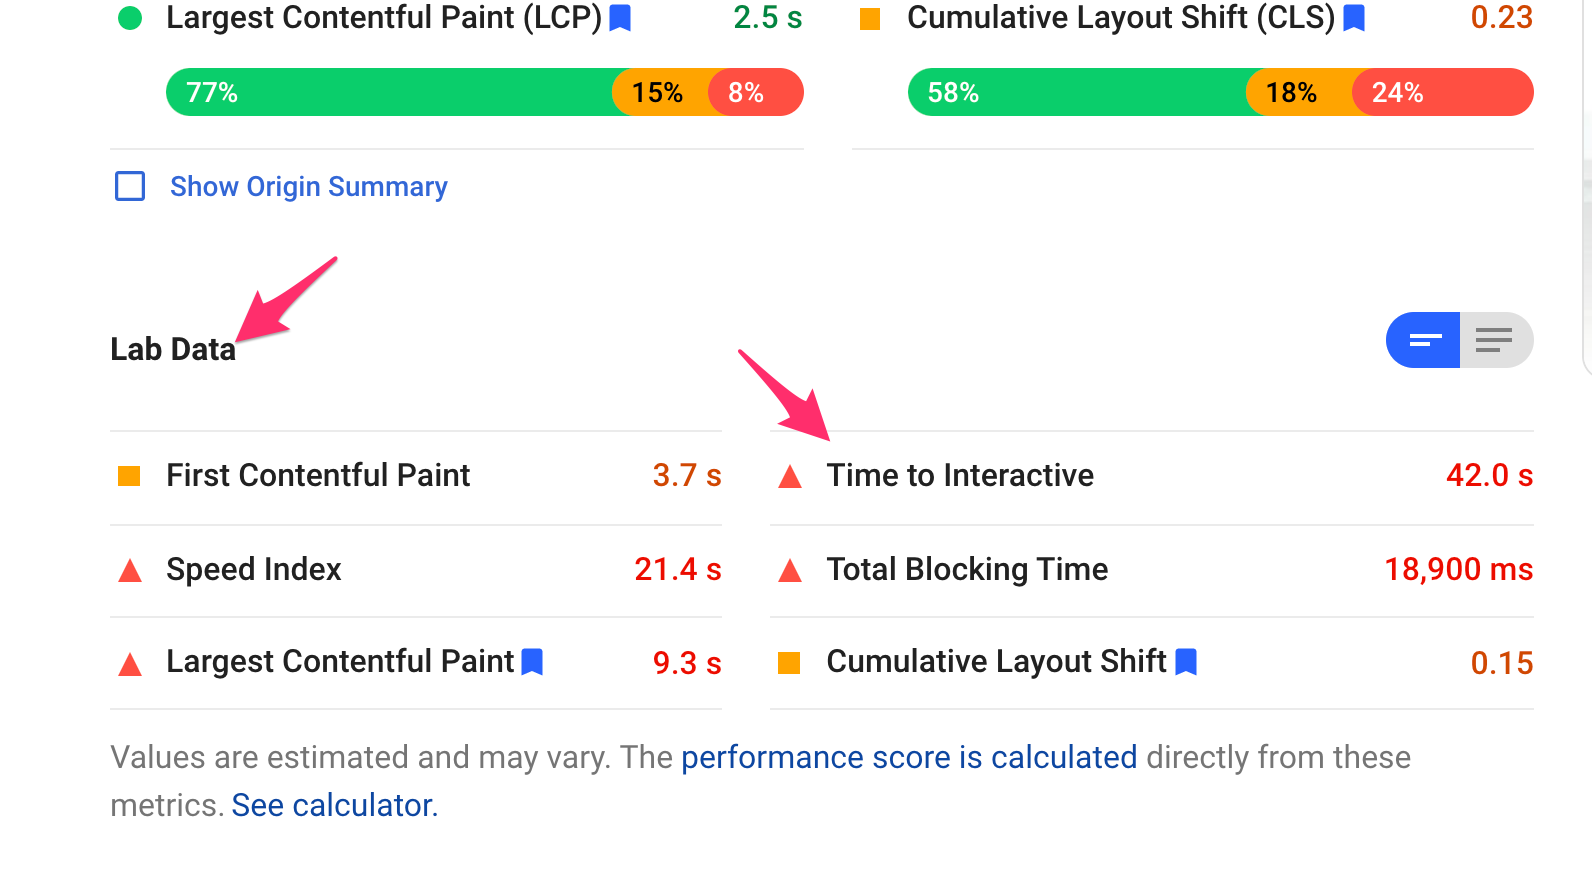
The easiest way to measure Time To Interactive is with PageSpeed Insights. After entering the page URL, PageSpeed Insights will run a performance test and report the relevant data. The TTI score can be found under the Lab Data section of the report.
PageSpeed Insights no longer reports the Time to Interactive metric.
Lighthouse
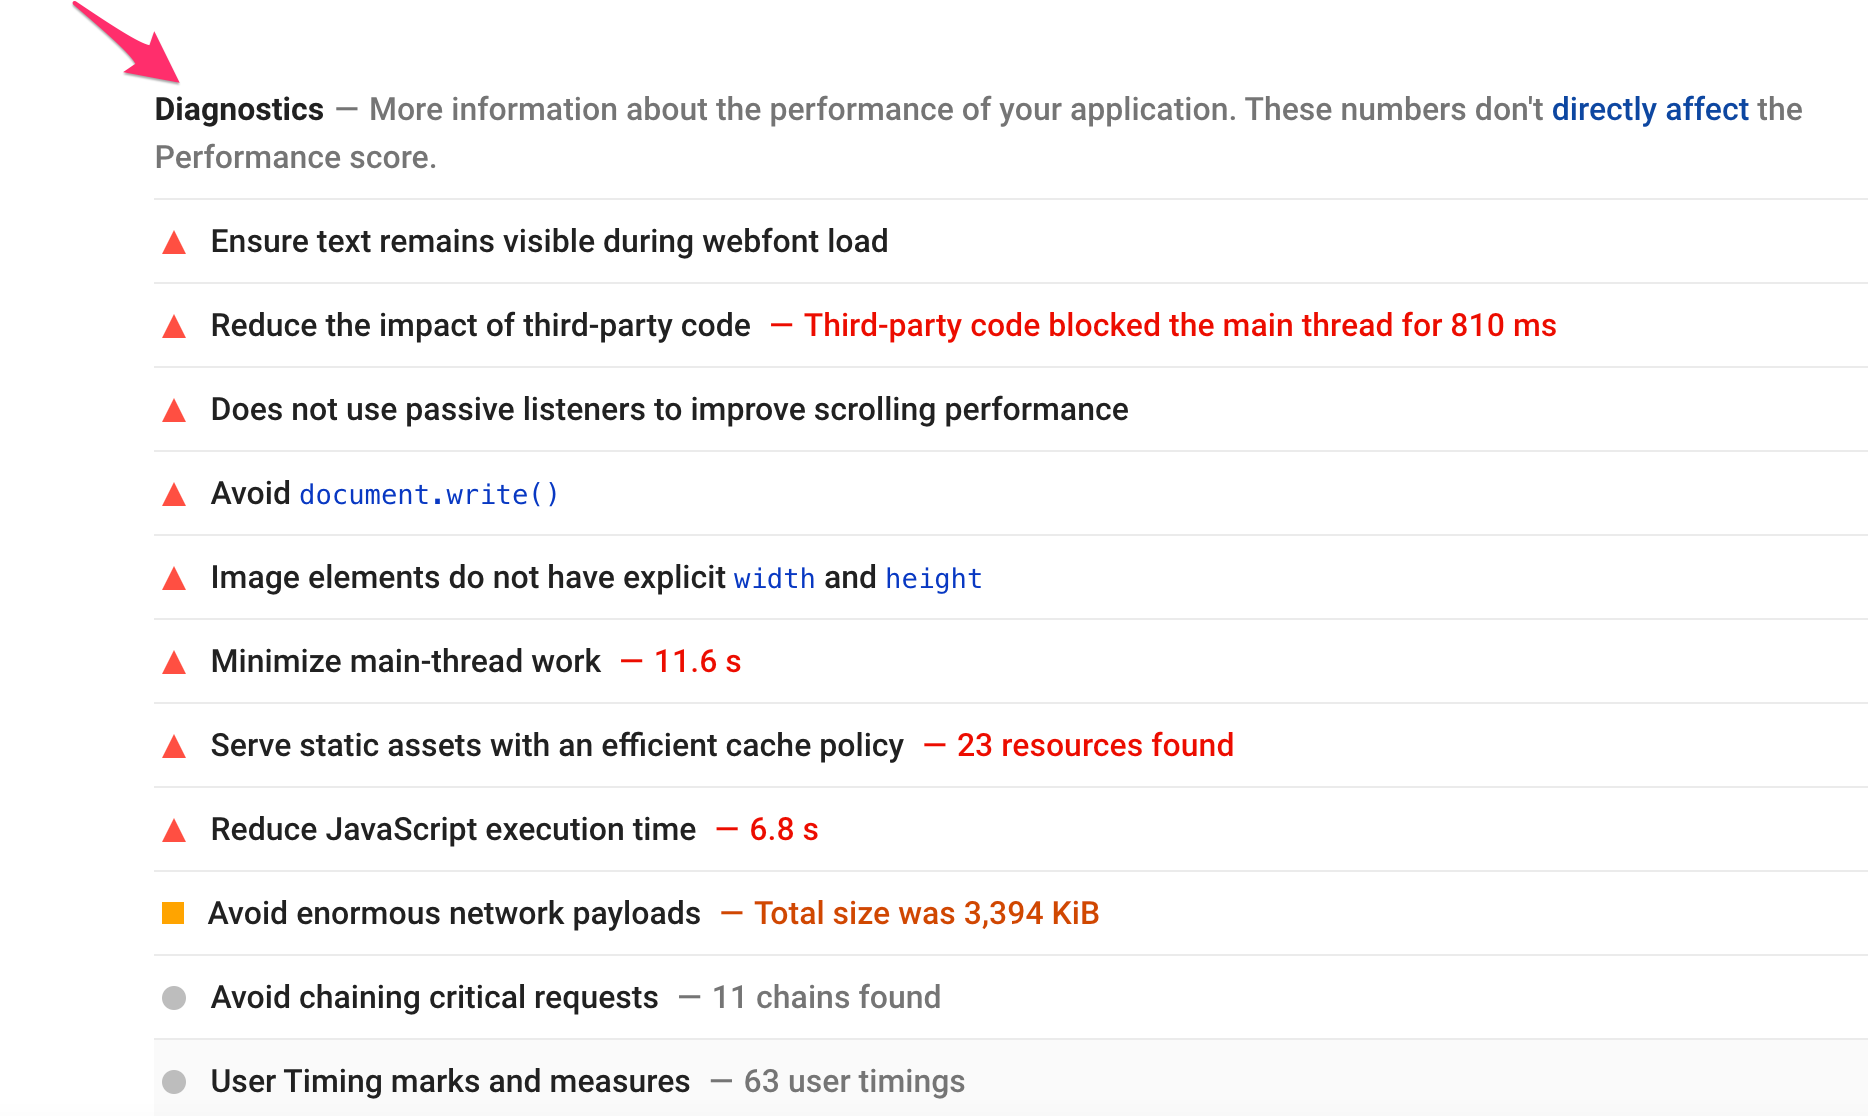
PageSpeed Insights is based on Lighthouse, and you can also run Lighthouse on your computer. Lighthouse is integrated in the Chrome Developer Tools. The Diagnostics section of the report gives you a great overview of the issues causing a poor TTI. For items that are not self-explanatory, you can open the dropdown to reveal detailed information on how to tackle the issue.
Lighthouse no longer includes the TTI metric in the Performance score, so this only applies to Lighthouse 9 and earlier.
While PageSpeed Insights runs the test suite for mobile and desktop scans at the same time, in Lighthouse you can only run the test for either desktop or mobile at once. The mobile simulation usually results in a lower performance score, since the test is using a low-end mobile device.
Consider running Lighthouse in Chrome Incognito mode, as browser extensions and other saved data can impact the score negatively.
DebugBear Website Speed Test
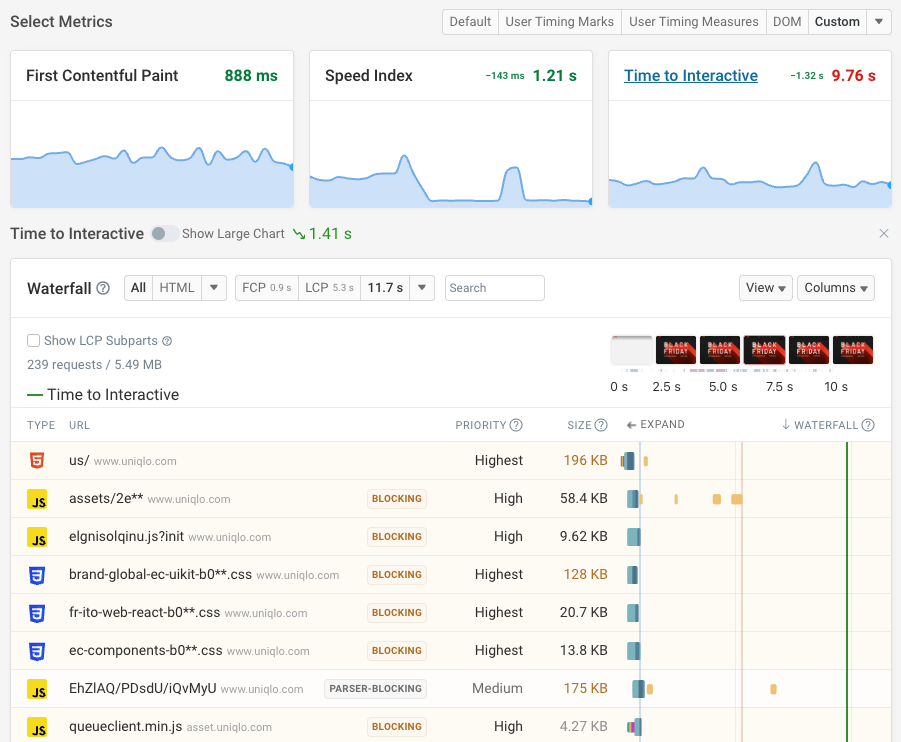
The DebugBear website speed test analyzes the loading speed of your website and reports a range of page speed metrics, including Time to Interactive.
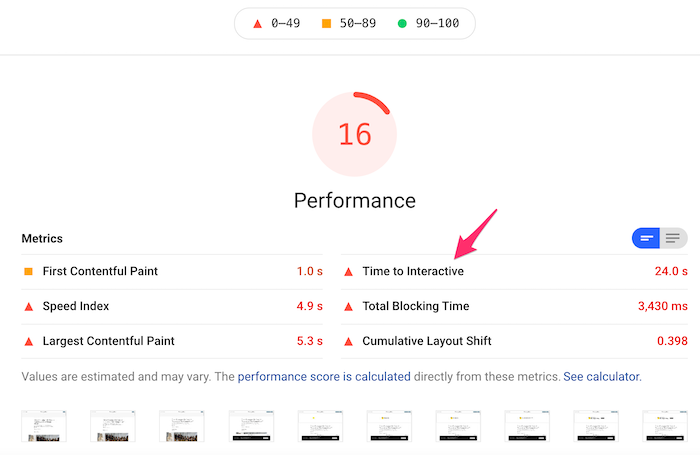
After running the test you can open the Metrics tab and scroll down to the Time to Interactive value.
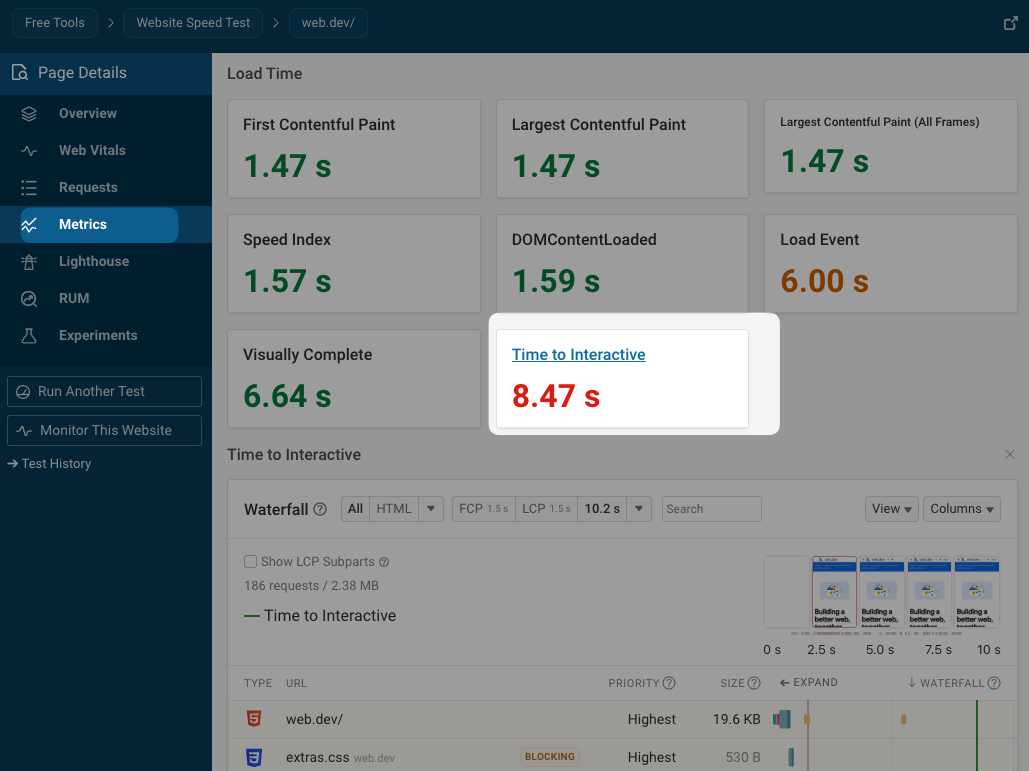
Click on the metric title to see how the score is determined and what you can do to optimize it.

How to monitor page speed and Time to Interactive with DebugBear
Continuous performance monitoring helps you optimize your website and get alerted when there's a problem.
DebugBear can keep track of key page speed metrics and provides in-depth reports to help you make it faster. Try it for free with a 14-day trial.
Our DebugBear performance dashboard shows trends of Lighthouse scores and metrics. It also shows the Core Web Vitals that Google uses as a ranking signal.
DebugBear continuously collects detailed reports for each metric, including Time to Interactive. You can see how these scores have changed over time and compare test results when there's a regression to see what's changed.


Monitor Page Speed & Core Web Vitals
DebugBear monitoring includes:
- In-depth Page Speed Reports
- Automated Recommendations
- Real User Analytics Data