How To Measure And Optimize Page Load Time
Loading web page content quickly not only matters to your visitors but is also a Google ranking factor that impacts your SEO. So optimizing page load times can also bring you more traffic.
This article explains what page load time means, how to measure it, and how to optimize the performance of your website.
What is page load time?
Page load time measures how long it takes for website content to show up in the user’s browser.
There isn't one single metric that measures page load time. Instead, the loading process of a website consists of multiple milestones. For example, when the server starts sending the document to the browser or when the browser first starts displaying some page content.
Many different metrics have been defined to identify and measure specific milestone timings. We recommend focusing on the Largest Contentful Paint (LCP) metric. This metric measures how soon after opening a page the largest content element becomes visible.
Other milestone timings like the First Contentful Paint (FCP) are also useful to look at. The FCP metric tells you how quickly the first page content (like text or an image) becomes visible.
Some older tools report the timestamp of the browser Load Event as the page load time. However, the load event is a purely technical metric and doesn't look at what the visitor can see. For example, it may happen long after anything changed on the screen. At the same time, it can also fire long before the page content is ready. While the Load Event timing can be useful for debugging technical issues, it is not a good way to measure page speed.
Run a free website speed test to measure page load time for your website.
Why does the page load process consist of multiple milestones?
Loading a web page normally consists of many different steps, for example:
- Loading the document HTML
- Loading CSS stylesheets
- Loading images
- Loading a chat widget from a third-party provider
- Running JavaScript code
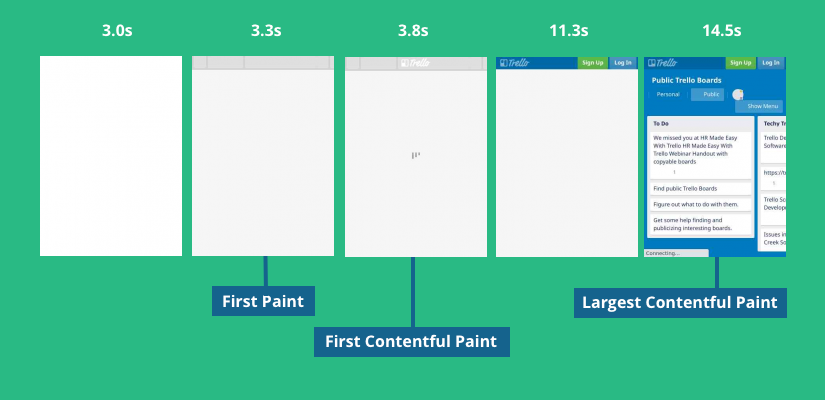
To make the browsing experience better, browsers try to display content as soon as it’s ready. Content usually appears gradually on the page.
There’s no single time when the page is “loaded”. A page might have loaded 98% of its contents except for a small footer image and an analytics script – but this doesn’t impact the user so we wouldn’t say that the page hasn’t loaded yet. Counting the final stretch to 100% as “the” loading time isn’t what we want to measure, since users can use that page just fine before that time.
Instead there are multiple metrics that can be considered:
- Time To First Byte (TTFB): How long does it take for the server to respond to the initial HTML request?
- First Contentful Paint (FCP): How soon does some content show up (for example text or an image)
- Largest Contentful Paint (LCP): How soon does the main page content show up?
- Time To Interactive (TTI): When do network and CPU become idle
- Visually Complete: When does the page stop changing visually (this may never happen if a site contains videos or animations)
- Browser Load Event: When has the page loaded all dependent resources like stylesheets and images
It’s also worth mentioning that the page load times aren’t absolute. They vary depending on the device type (desktop/mobile), browser, user location, internet connection and many other factors.
Speed Index is another common page load time metric. However, it does not mark a single page load milestone but rather provides a statistical assessment of overall rendering progress.
Why focus on the Largest Contentful Paint?
There are a few reasons why LCP is the best starting point for page load time optimization:
- It measures how soon the user can see content, rather than just measuring a technical detail
- It focuses on the main page content and does not count minimal rendering progress
- It’s one of the three Core Web Vitals that impact Google rankings
What is a good page load time?
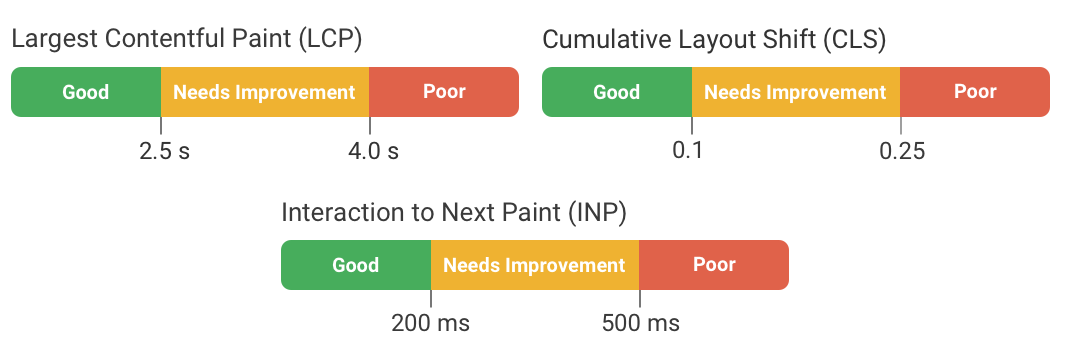
According to Google’s Core Web Vitals, a Largest Contentful Paint of 2.5 seconds or below is a good page load time.
Page load times up to 4 seconds are acceptable, and Google will flag them as "Needs Improvement". A page load time over 4 seconds is slow and Google will rate it as "Poor".
In addition to the Largest Contentful Paint, the Core Web Vitals metrics also include Interaction to Next Paint and Cumulative Layout Shift.
What is the average speed of a website?
According to Google's CrUX dataset, the largest content takes 2.6 seconds to show up on mobile devices. Desktop sites are slightly faster, with a Largest Contentful Paint of 2.3 seconds. A normal page load time for real users is therefore in the 2 to 3 second range.
Another aspect of page speed is how long it takes for a page to respond to user input. This is measured using the Interaction to Next Paint metric. On mobile the average INP is 274 milliseconds. On desktop, users only wait 108 milliseconds for the page to respond to user interaction.
These numbers look at the 75th percentile of experiences, which means that 25% of users wait longer than the reported value, while 75% don't wait as long.
Does page load time affect SEO?
Yes, page load times can have an impact on search engine rankings.
While content quality is more important than page speed, Google uses a set of page experience metrics as part of their ranking algorithm.
In addition to the Largest Contentful Paint metric, Google also looks at Cumulative Layout Shift and Interaction to Next Paint.
How do you measure page load time?
You can measure page load time using a free tool like Google’s PageSpeed Insights or the DebugBear Speed Test.
Simply enter your website URL to see your page speed metrics and get recommendations on how to optimize your website performance.
Often you’ll see a mix of lab and field data:
- Lab data is collected on demand in a controlled test environment
- Field data is collected from real users
Field data is often based on the Chrome User Experience Report (CrUX) which aggregates data from the last 28 days.
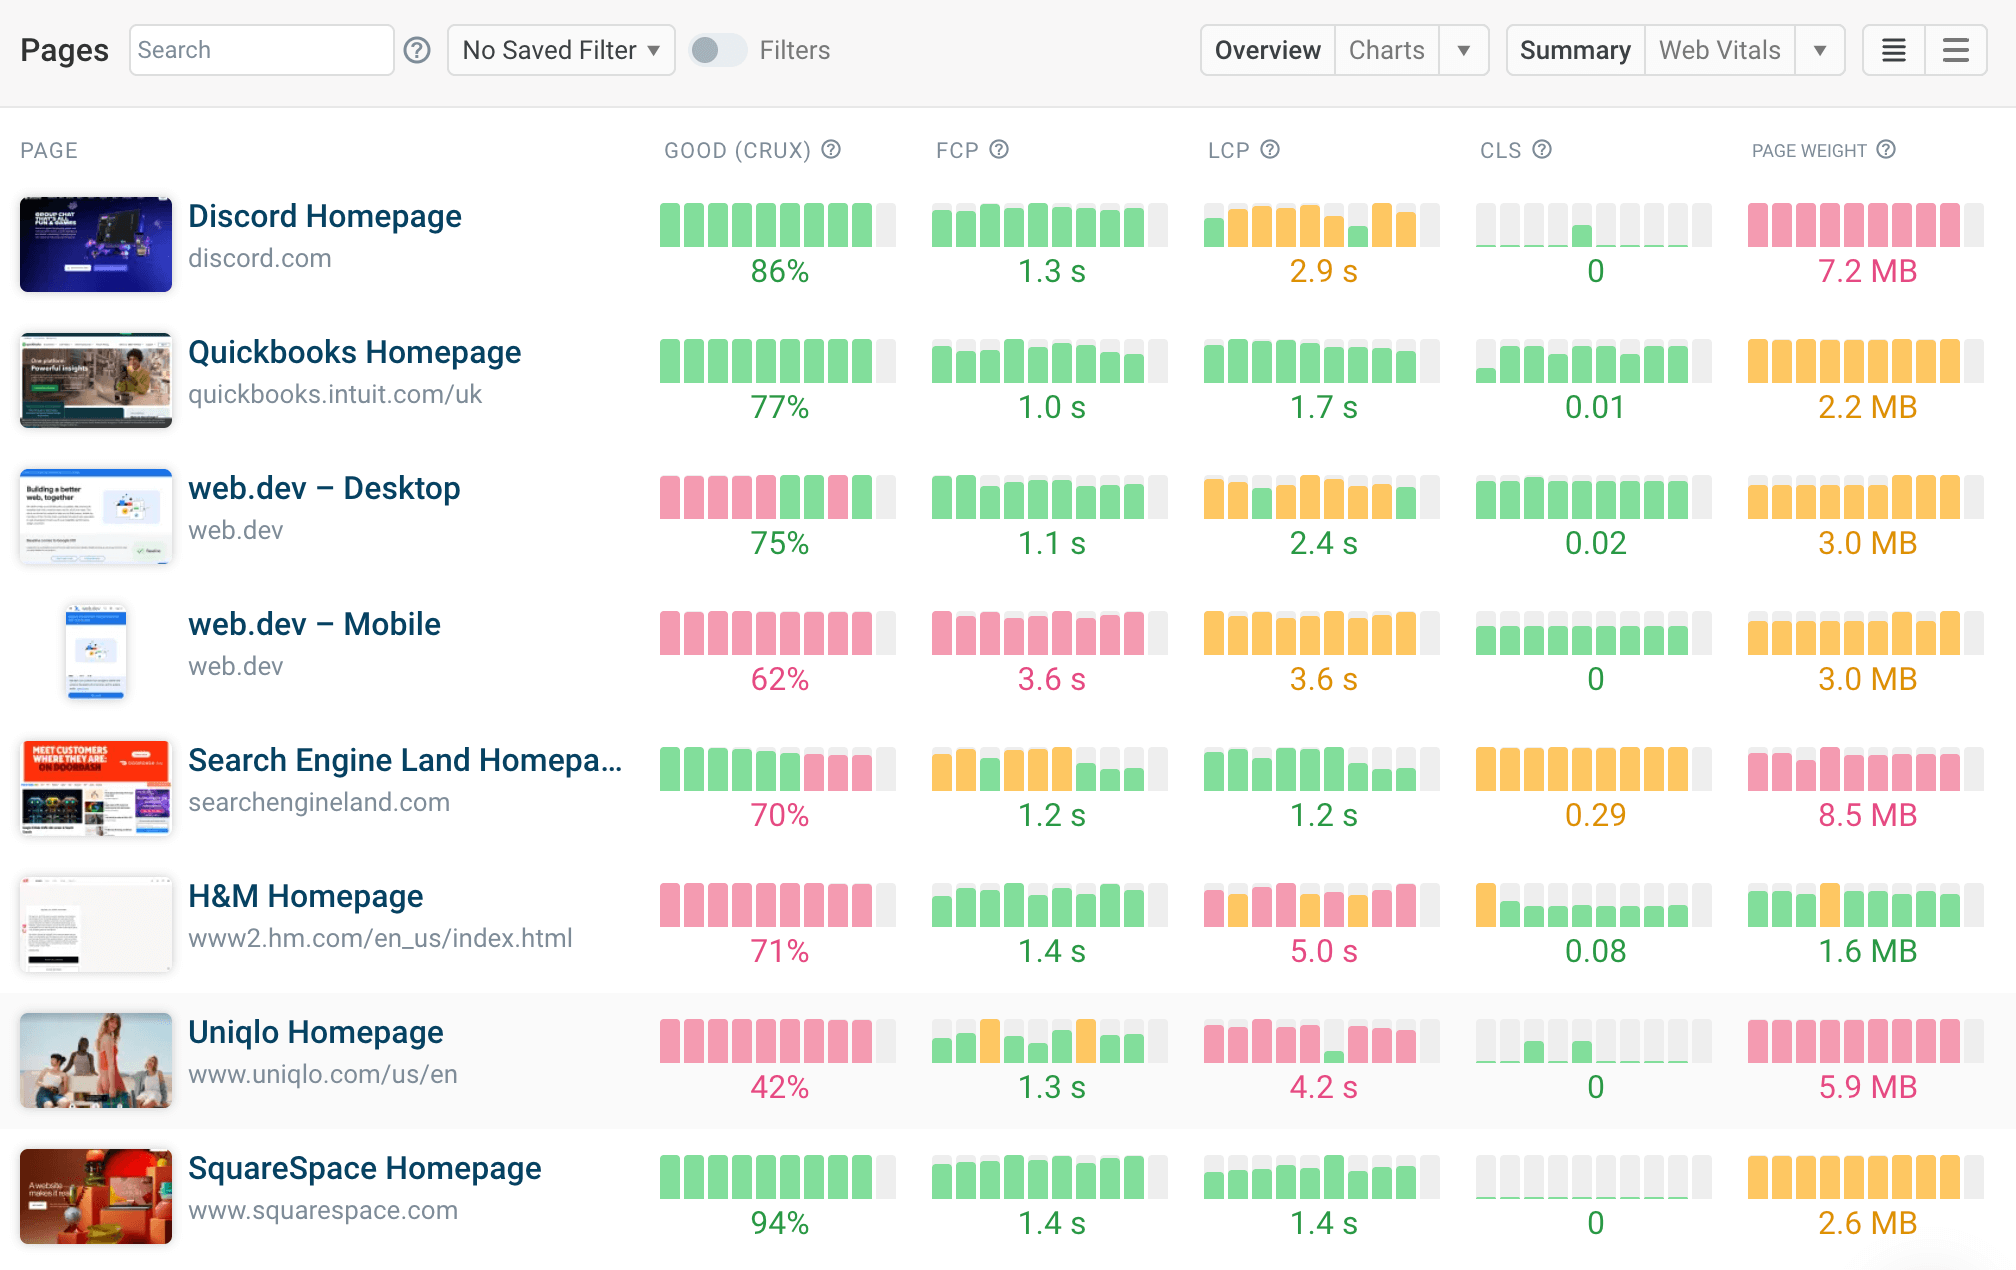
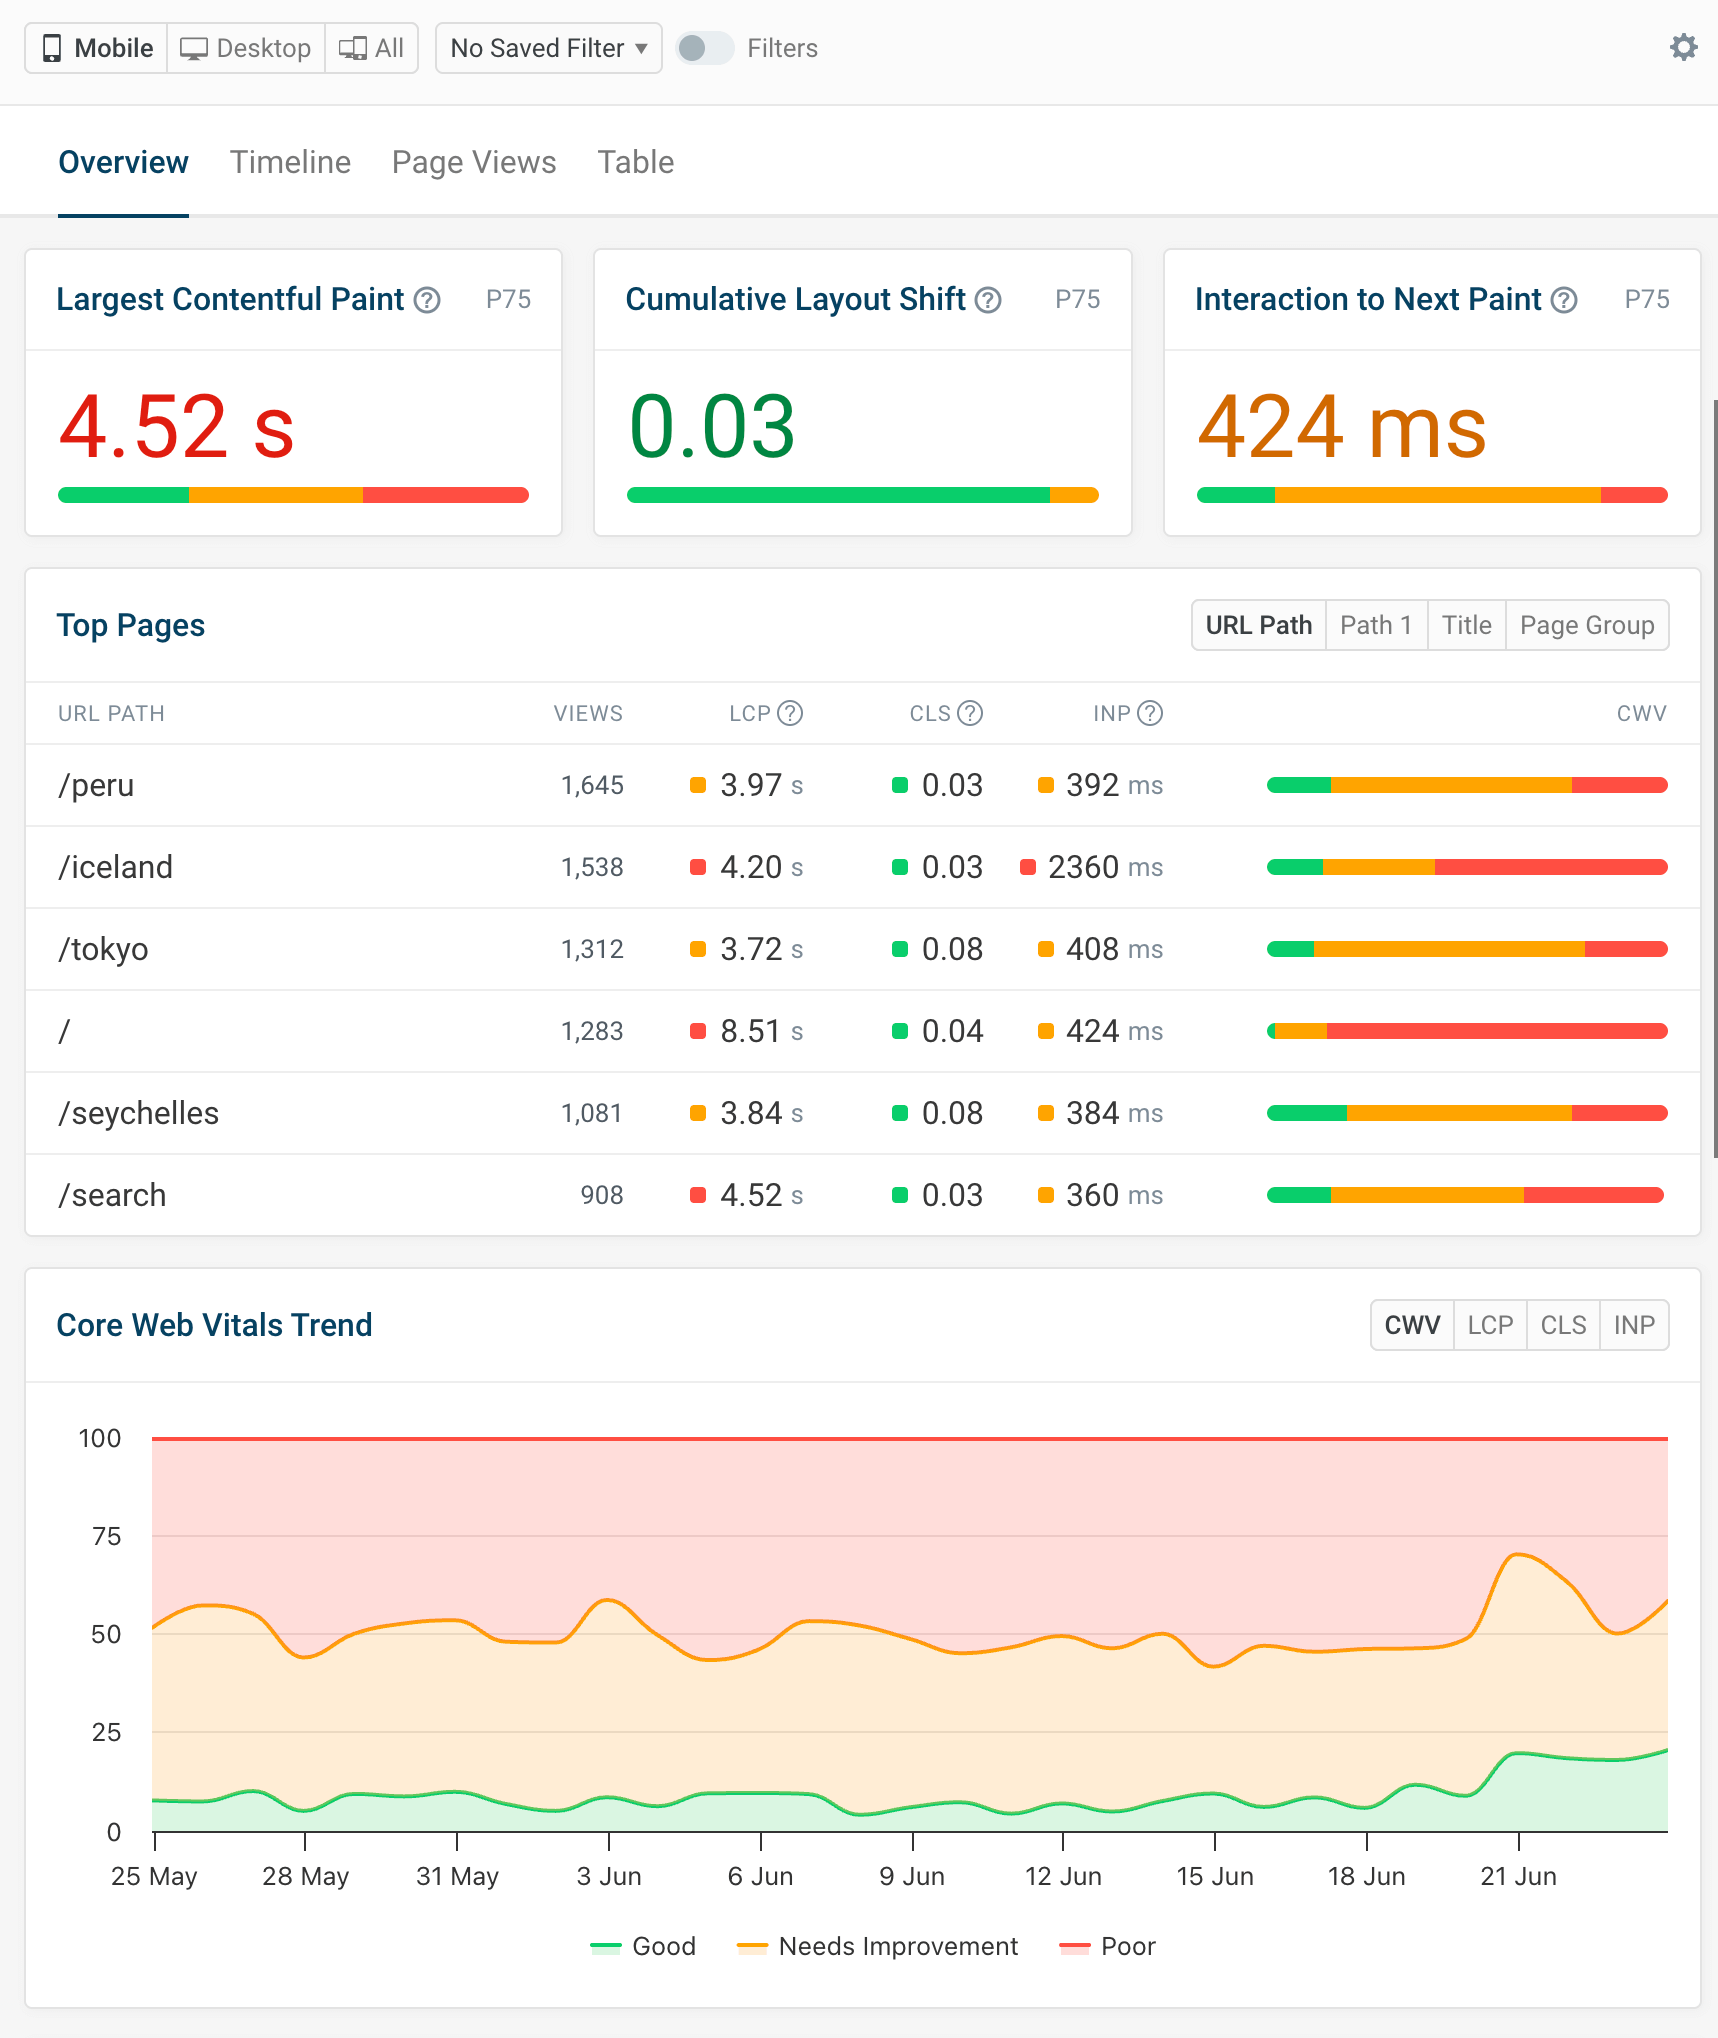
Here’s an example of what part of a website performance report might look like.
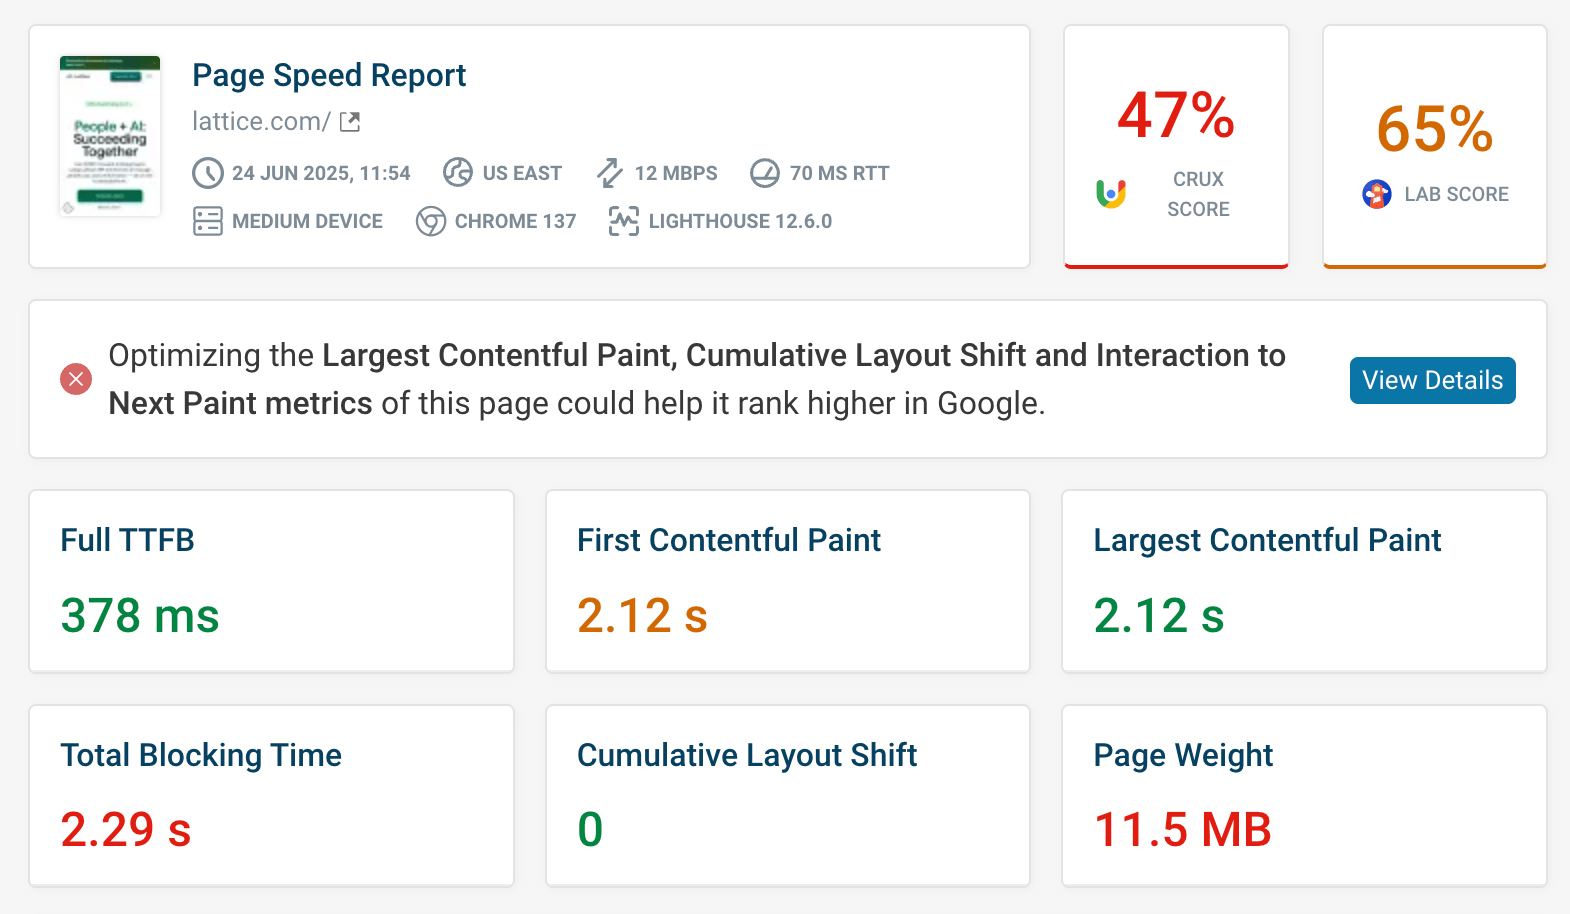
Straight away, you can see that optimizing the Largest Contentful Paint metric of this page could help it rank higher in Google. There are other metrics to keep an eye on as well, and these are all highlighted in red.
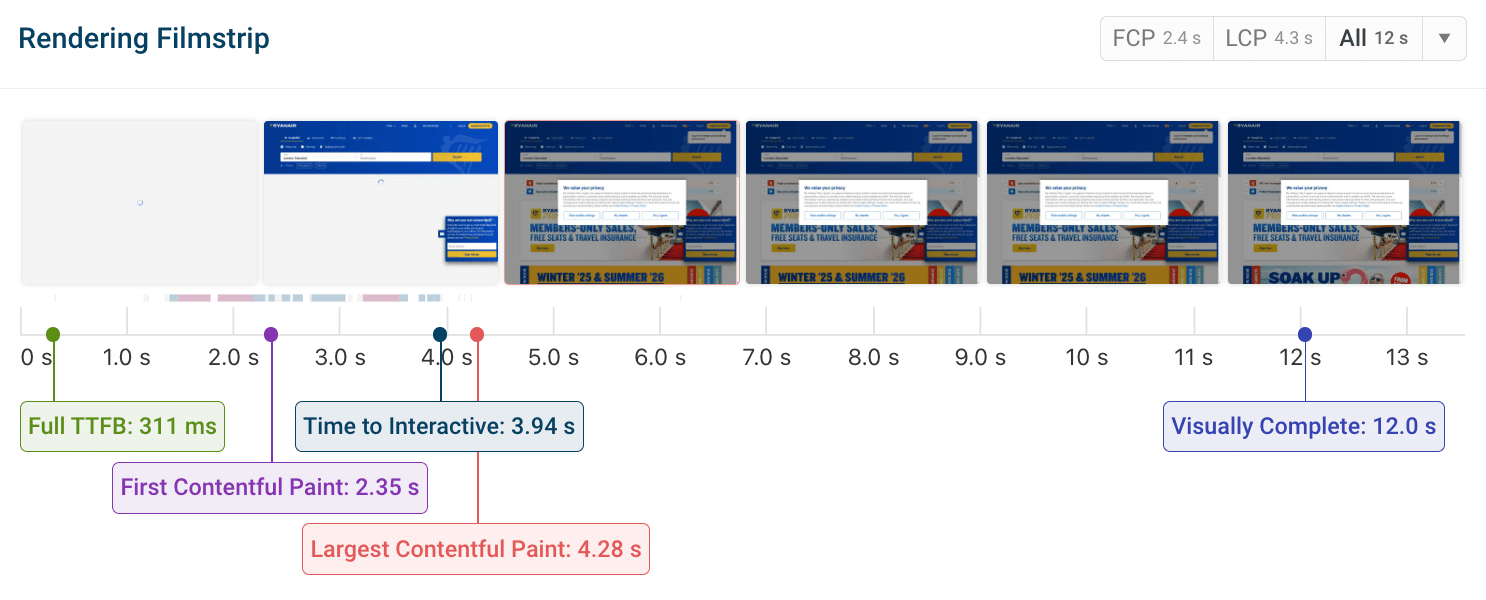
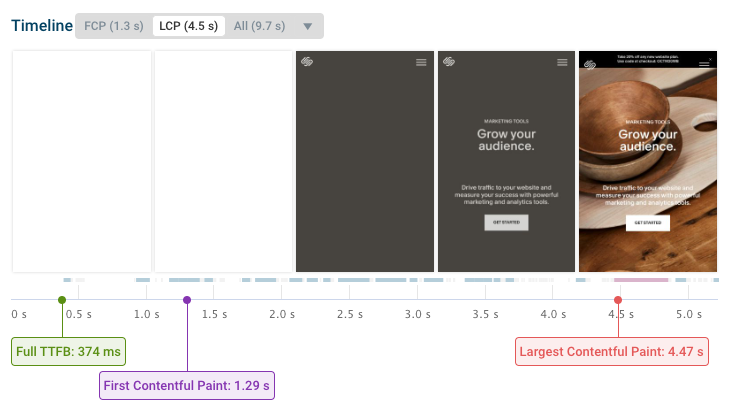
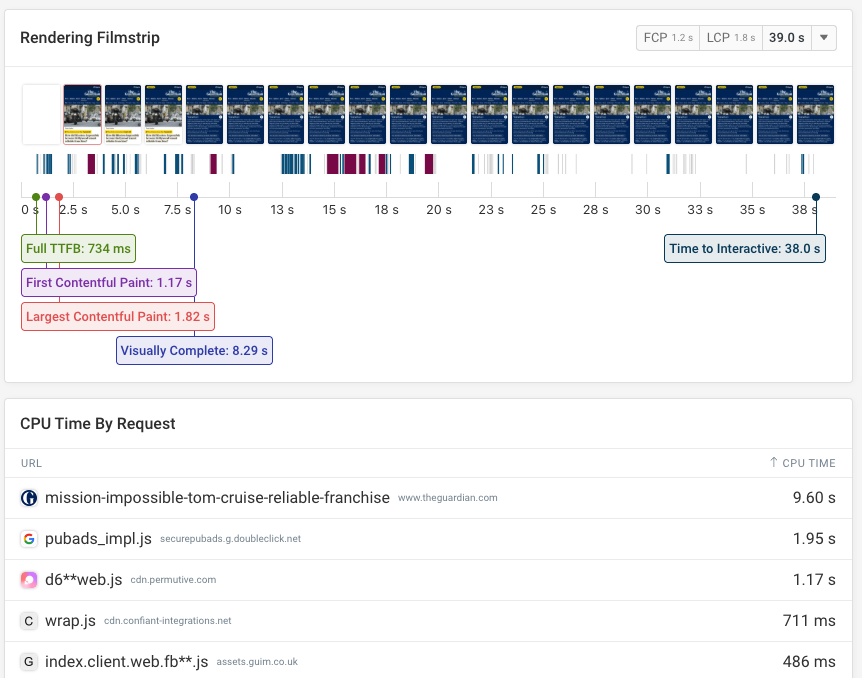
You can also see a visualization that shows how the page renders gradually.
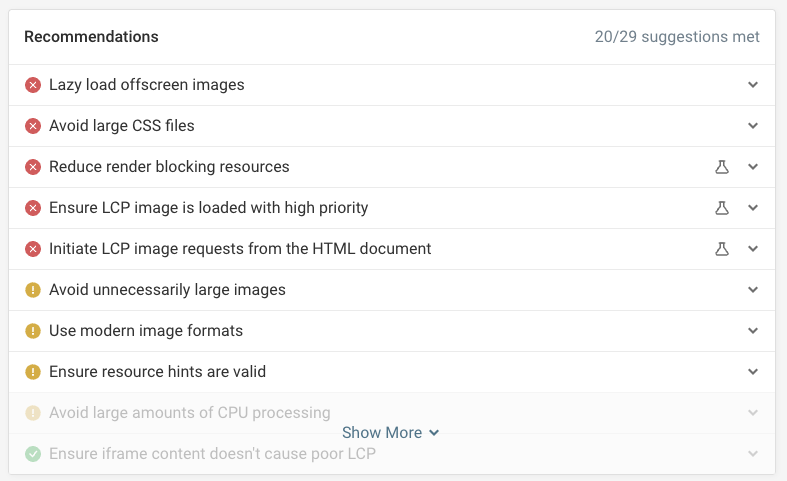
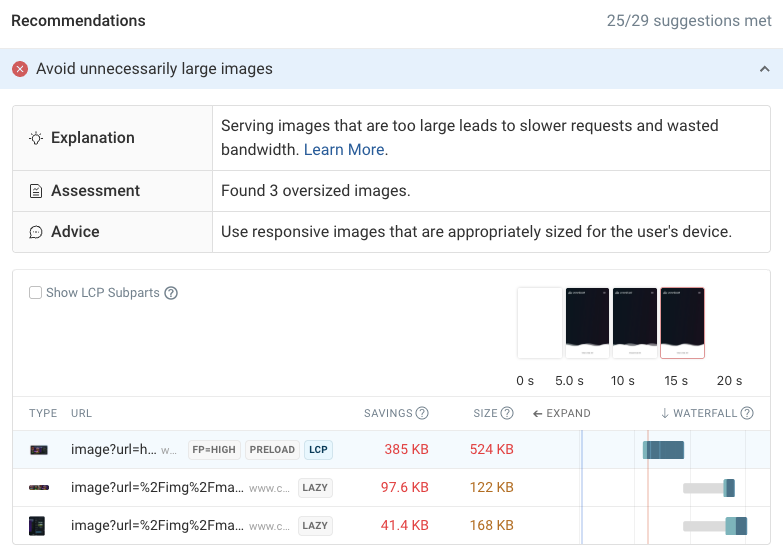
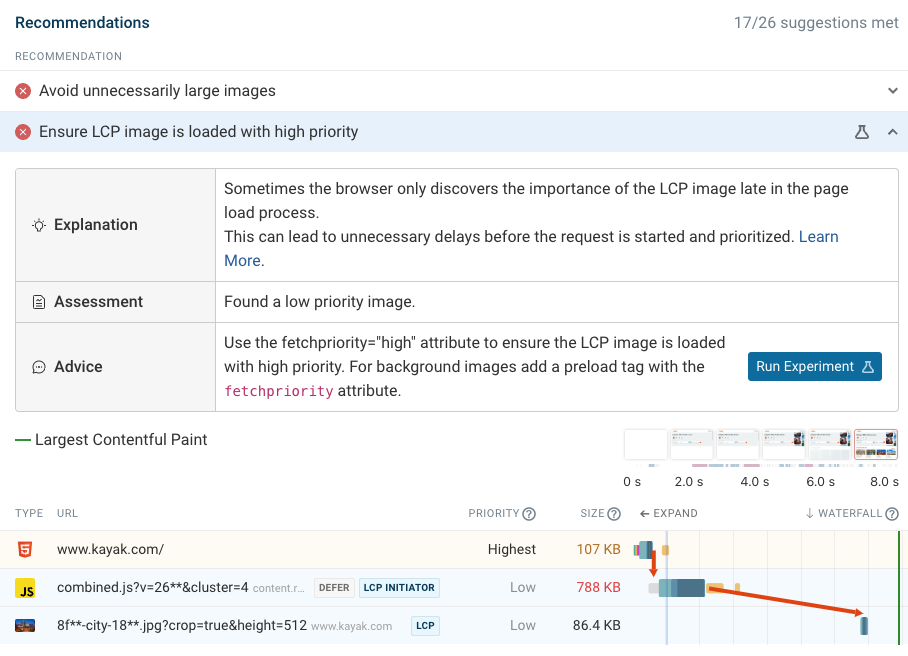
In many cases there’ll be performance recommendations specific to your website.
The DebugBear speed test also shows a beaker icon next to some of these recommendations. That means you can run a page speed experiment to quickly try out an optimization and measure its impact, all without making any changes to your production website.
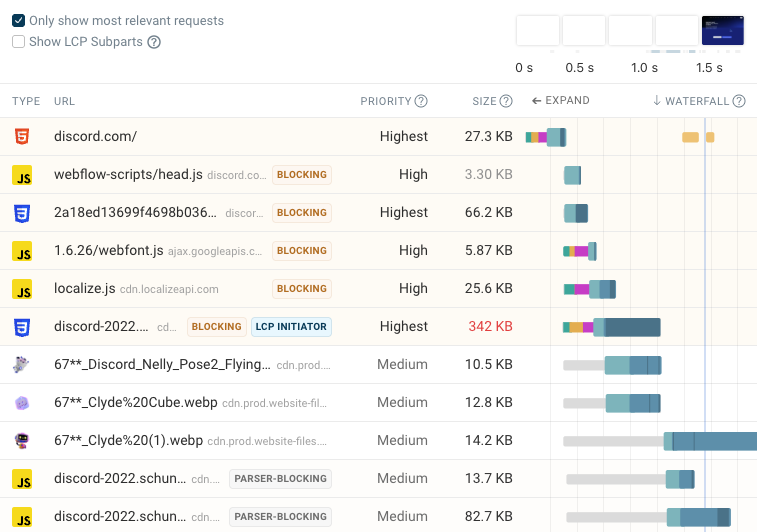
A request waterfall visualization can also help identify potential performance improvements. It allows you to see when different resources load and what role these files have in the rendering process.
For example, you can see whether a file is render-blocking and see what the request priority is for each file.
Check page load time in Chrome DevTools
Google Chrome's developer tools let you measure page load time and identify what's slowing down your website.
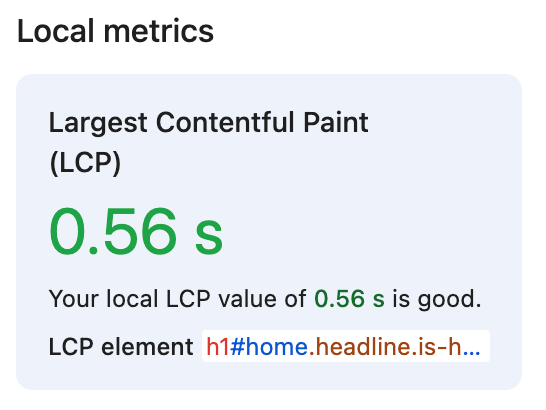
After opening the Performance tab you get a set of local metrics right away. 'Local' means these were measured on your computer, rather than in a separate testing environment or for real users.
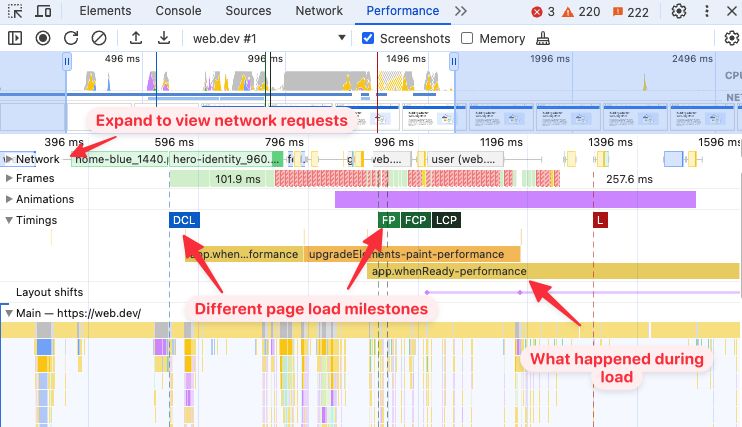
Click the Record icon in the top left of the performance tab to get more detail on page speed. You can find out:
- When different page load milestones occur
- What network resources load before each milestone
- What CPU tasks run on the page
The performance profile shows you every single step of loading and rendering your page.
How to monitor page load time
Continuously measuring page load time not only lets you check if your optimizations are working, but will also alert you if your site got slower.
DebugBear can monitor site speed over time, including the Core Web Vitals metrics that impact search engine rankings.
How do I reduce page loading time?
You can reduce page loading time by looking at 4 big factors:
- Server response times
- Download sizes
- Resource loading efficiency
- Rendering time
To make your website load fast you need to process requests quickly on the server, use image and text compression to reduce file sizes, and minimize the amount of JavaScript on your page.
Step 1: Optimize server response times
Once a user clicks on a link or types a URL, the browser requests that page from a remote server. It then waits until the server responds with the contents of the page.
This part of the page load process is represented by the TTFB (Time To First Byte) metric. In addition to the time spent processing the request on the server, TTFB also includes time spent looking up the server IP address via DNS and establishing a secure server connection using TCP and SSL.
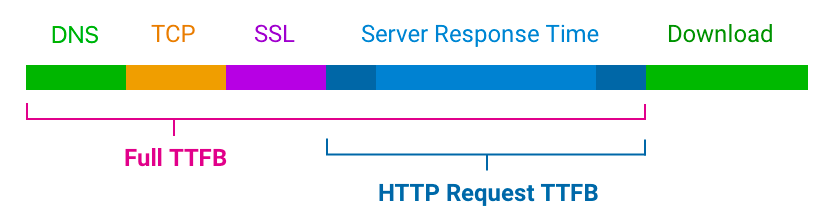
If you notice that your TTFB is too high, you can focus on this part of the loading process. A TTFB under 0.8 seconds is considered good by Google. If it’s higher than 1.8s, it’s considered poor.
Now let’s see how you can improve the TTFB.
Reducing processing time on the server
HTML documents typically aren’t static but are generated by the server for each request. For example, different users will be served different page contents, or the content of a news website will change throughout the day. Generating the HTML involves loading data from a database and using templates to construct the page.
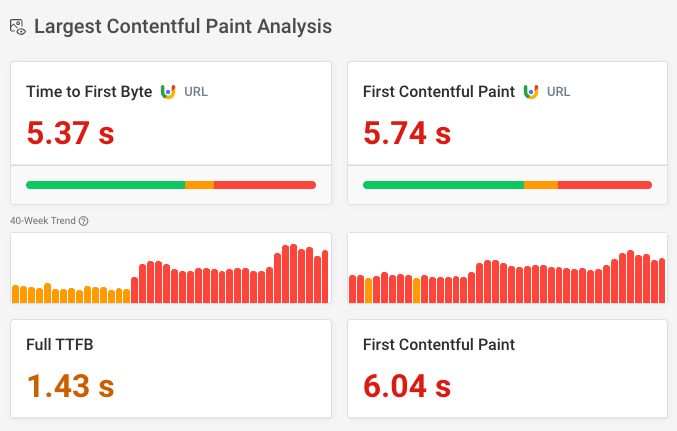
The Web Vitals tab on DebugBear shows you both real user server response times as well as data collected as part of a lab test. Based on data from Google's Chrome User Experience Report you can also see a 40-week trend for key page speed metrics.
Caching all or parts of the HTML can speed up server responses. Instead of regenerating the response every time the server will save the generated response and reuse it later on.
If you’re using a content management system like WordPress make sure that you aren’t using too many plugins, as these can slow down your website. For simple websites you could also consider switching to a faster solution like a static site generator.
Another key factor to processing times is the hosting provider. If your hosting provider is too slow, you’ll need to switch hosting plans or pick a different provider.
Physical distance between client (browser) and server
No matter how fast your server is, there is still the time it takes for the request to travel from the visitor’s browser to your servers, and then for the content to be sent back.
For example, if your server is based in New York but some of your visitors are in Tokyo, then it will take around 180 milliseconds for each round trip between client and server. Typically at least 3 round trips are needed to create a connection and make a request. So this factor alone could cause a delay of 0.5 seconds just for a single request.
Content Delivery Networks (CDNs) can address this issue. They have locations in hundreds of places across the world, so round trip times will be much lower.
Step 2: Optimize download sizes
Once your server has provided the page HTML for the website it will start downloading other content on the page. For example, it will load render-blocking stylesheets and download images.
The amount of available bandwidth and latency determine how long it takes to download a given file. Larger files will take longer to download.
You can often see pages render gradually as more content becomes available.
There are a few things you can do to reduce download sizes and load resources efficiently.
Image, video, and text compression
Compression means making a file smaller without changing its contents. For images the image quality can also sometimes be reduced.
Using modern image formats like WebP or AVIF can reduce download sizes without impacting image quality. You can also reduce the resolution of your images, or load different images depending on the device size using the srcset attribute.
Text files like HTML, CSS, and JavaScript can be compressed with algorithms like gzip and brotli.
Many WordPress plugins and tools can automatically compress resources, for example WP Rocket.
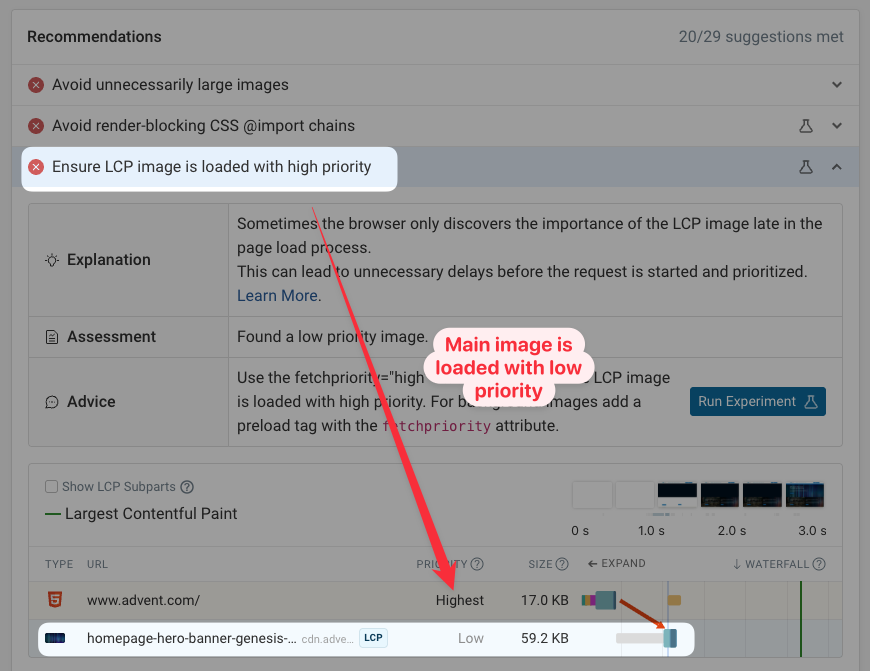
Optimize resource priorities
Not every resource on your website is equally important. You can improve the LCP and the overall user experience by controlling when to load which assets. That way bandwidth is allocated to the most important content.
For example, you can use priority hints to tell the browser that a hero image on your website should be prioritized. This page speed test result shows an example where the LCP image is loaded with low priority. Adding the fetchpriority="high" attribute to the <img> tag can fix that and ensure there's no delay before the image starts loading (indicated by the gray part of the waterfall bar).
Images further down on the page can be lazy loaded, so they don’t compete for bandwidth with more important content.
If a script isn’t important it should be loaded asynchronously with the async HTML attribute.
You can also preload important resources if the browser doesn't discover them right away.
Step 3: Ensure efficient resource loading
Your page load time does not just depend on what content is loaded, but also when the browser starts loading it. Sequential request chains indicate that the browser isn't able to identify all the important page resources right away.
For example, here you can see that the browser only starts loading the Largest Contentful Paint image once a large CSS file has finished loading. The image is a background image, so rather than being specified in the HTML, the browser only discovers it once it tries to apply the styles from the CSS files.
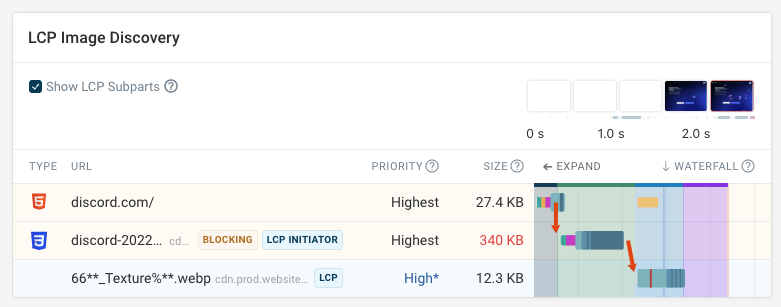
To fix that, you can add a preload tag to the page HTML so that the browser starts loading the LCP image at the same time as the stylesheet.
Step 4: Reduce rendering times
Your visitor is connected to your server and has downloaded your important resources. But there is still some work to do.
The browser needs time to process resources, display the layout, load sliders, widgets, or render dynamic content. Rendering this content quickly is particularly important in mobile browsers, since they have less processing power.
You can measure the impact of CPU processing on page loading times with metrics such as Total Blocking Time (TBT) and Time To Interactive (TTI).
Identify what code is slowing down your website
CPU timelines in DebugBear or the Chrome DevTools Performance tab will tell you whether this is slowing down your website and what tasks the browser is spending time on.
Third-party requests are a common cause of poor performance. Running this code on a separate thread using the Partytown library can help your website load faster and respond more quickly to user input.
Use less JavaScript
When adding JavaScript to your page you need to factor in the processing power that it will take. Notifications, animations, sliders, tracking codes, are all really useful. But be mindful of how much they can cost in terms of conversions, rankings, and revenue if they slow your site down.
Sometimes the best solution is to just remove them and reduce overall JavaScript execution time.
How to make sure you have fast page load times
Page load time optimization is important for user experience and SEO. If website performance is important to your business, you need a monitoring tool that can track page speed over time and tell you what steps you need to take to optimize.
DebugBear lets you track overall performance, benchmark against competitors, as well as collecting detailed analytics to make your website faster.
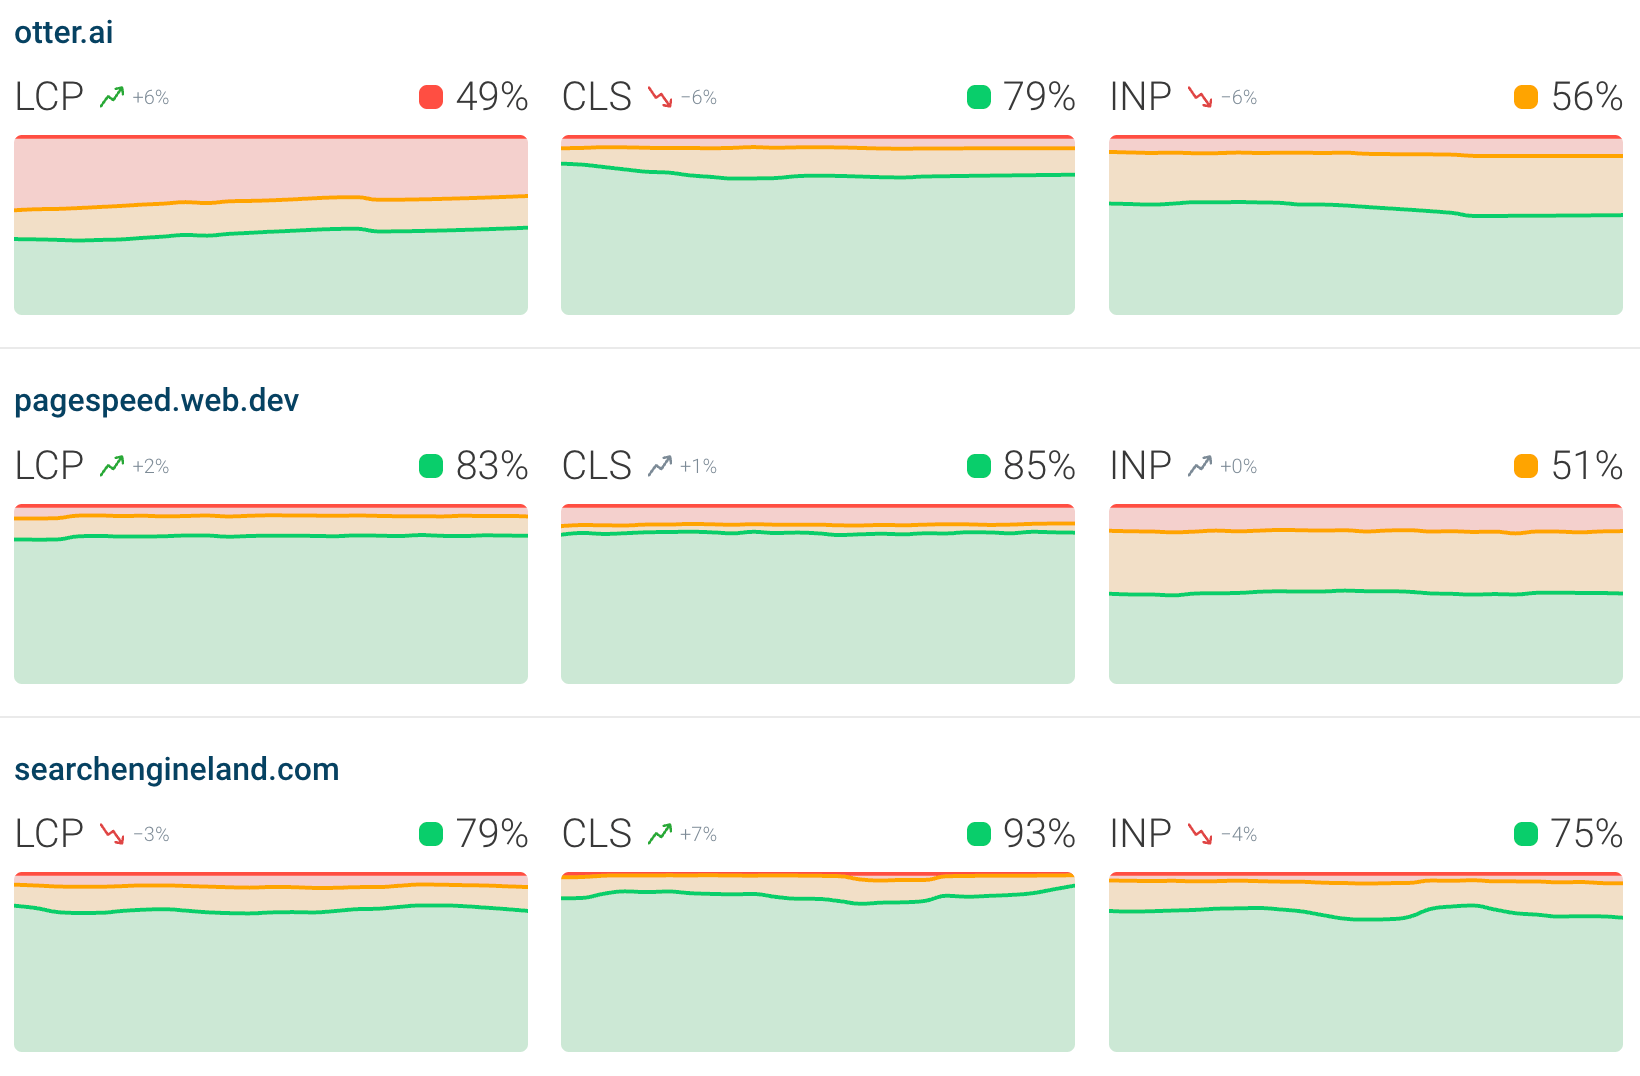
Start by checking your overall website performance, as well as that of your competition, using the CrUX Trends dashboard.
Tailored page speed recommendations based on synthetic tests then tell you what you need to improve.
You can also run experiments to try out the impact of optimizations without having to deploy any code.
Finally, real user monitoring tells you where on your website you have performance problems, and how many users are impacted.
You can also see what requests are delaying the page load for actual visitors and what scripts need to run before the initial render of the page.


Monitor Page Speed & Core Web Vitals
DebugBear monitoring includes:
- In-depth Page Speed Reports
- Automated Recommendations
- Real User Analytics Data