The web is best experienced with a fast network connection. Still, a large number of people will visit your site using slower speeds. They might visit your page while on the road or in a remote place.
Faster loading times can help you keep more visitors and positively influence your website SEO.
The Chrome DevTools network throttling feature lets you imitate degraded network conditions. In this article, you will learn how to use it and how exactly it works.
How to test a page speed with a slower connection
In order to throttle the network, first open Chrome DevTools.
- Right-click on a website and select Inspect
- Select the Network tab
- Choose the appropriate connection throttling speed from the dropdown
- Reload the page to experience the simulated network speed
Now you can observe the website being loaded on a slow connection.
You can also pause loading and inspect the page step by step to understand each stage of the loading process.
Check the example below to better understand how to use this tool.
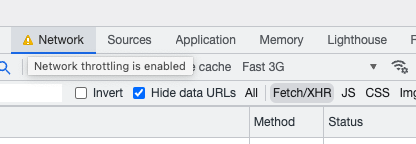
When network throttling or the local overrides feature are enabled, DevTools shows a warning triangle next to the Network tab title. In this case, there's a "network throttling is enabled" tooltip that tells you Chrome is interfering with the normal network behavior on the current page.
Another way to test your website on a slowed-down connection is using DebugBear's free page speed testing tool.
What do Fast 4G And Slow 4G mean in DevTools?
The Fast 4G setting causes each request to take at least 165 milliseconds. Bandwidth is also reduced to 9 megabits per second.
With the Slow 4G configuration, Chrome introduces a request latency of 562 milliseconds and slows down data transfer to 1.4 megabits per second.
A closer look at network presets in Chrome DevTools
When you select the throttling setting Chrome shows three pre-defined profiles:
- Fast 4G
- Slow 4G
- 3G
- Offline
Let’s dive deeper into what they mean and when to use them.
DevTools throttling vs. other approaches
Different performance testing tools slow down the network in different ways. Chrome DevTools uses a request-level throttling approach: a delay is only applied once the server response is received.
Request-level throttling does not consider individual network round trips like DNS resolution and establishing TCP/SSL connections. We'll discuss how request-level throttling differs from other approaches further down in this article.
Latency settings
Due to the way DevTools throttling is implemented, the latency values tend to be higher than what other tools use. However, they are selected to achieve a roughly equivalent slowdown.
| Preset | Request latency | Equivalent in other tools |
|---|---|---|
| Fast 4G | 165 ms | 60 ms |
| Slow 4G | 562.5ms | 150 ms |
| 3G | 2,000 ms | 400 ms |
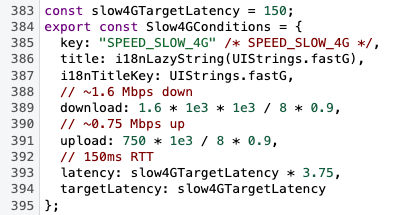
You can find these values in the Chrome source code.
Bandwidth settings
| Preset | Bandwidth down / up | Equivalent in other tools |
|---|---|---|
| Fast 4G | 9 Mbps | 8.1 Mbps |
| Slow 4G | 1.44 Mbps / 675 Kbps | 1.6 Mbps / 750 Kbps |
| 3G | 400 Kbps / 400 Kbps | 500 Kbps / 500 Kbps |
What is latency?
Latency measures the time it takes for data to pass from one point on a network to another. It's most important in applications where the duration of a back-and-forth response is important, for example, collaboration tools, chats, and multiplayer games.
Latency can also make a big difference when loading a page using resources from different servers. When sending requests to multiple servers, a connection needs to be established to each server. How long this takes depends greatly on network latency.
The request waterfall shows how time is spent establishing connections to different servers.
Latency usually refers to the one-way transfer delay time. In contrast, network round trip time (RTT) looks at the way to and from the server. DevTools has a specific definition of latency: here the term refers to the minimum request duration.
What is bandwidth?
Bandwidth is a measure of the capacity of a given network. It tells you how much data you can transfer in a given amount of time.
Mbps stands for megabits per second and is a unit used to measure bandwidth. On a 1 Mbps connection you can download 125 kilobytes per second.
Similarly, Kbps stands for kilobits per second.
What throttling setting should I use?
Use the Slow 4G setting to check your website's performance on a decent mobile connection. Slow 4G also aims to match the mobile throttling used by Google's Lighthouse tool, so you can use it to compare your metrics to those collected by Lighthouse and the PageSpeed Insights lab data.
The 3G setting is a good choice when you want to optimize your website's loading speed. It allows you to clearly see which elements load first. Using this setting lets you work on making the loading experience much smoother.
Custom network throttling profiles
DevTools also supports creating custom network configurations where you can choose the bandwidth and latency. For example, you could create a configuration that matches a typical customer.
- Go to the Network tab in the Chrome DevTools
- Open the throttling dropdown
- Click Add… below the Custom label
- Enter your desired network parameters
- Confirm with the Add button
You can now select your own profile from the throttling dropdown.
DevTools now also lets you apply throttling at a per-request level.
Testing websites offline
Many websites are interactive and can make requests for additional resources after the initial page load. Select the Offline profile to see what will happen when the internet goes down. It can be used to see if your site handles network errors properly.
The video below shows an example of offline mode in Google Translate.
You also might support offline functionality on your website by using a Service Worker. If that's the case, DevTools gives you the ability to test it properly. Below you can see an example of Twitter in offline mode.
How exactly does DevTools network throttling work?
Network throttling can be implemented in a number of ways, and Chrome DevTools uses a request-level approach.
That means not every network round trip is throttled individually and the browser initially sends a request as usual. Once it receives a response the browser adds a delay until a minimum response time is reached.
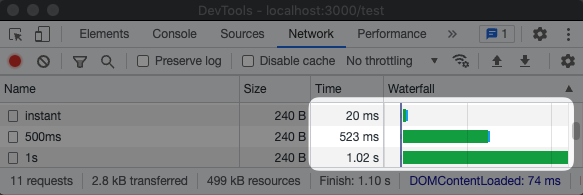
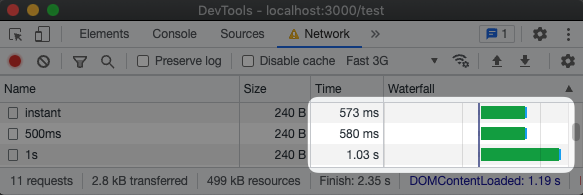
We created a test website that sends three small requests with a server response time of 0ms (instant response), 500 ms and 1 second.
When no throttling is applied the responses arrive with minimal delay. Around 20ms is added to the server response time due to time spent on the network.
When using the Fast 3G option, the requests have a minimum server response time applied to them, in this case around 550 milliseconds. The longest request doesn't take longer than before.
When we use the Slow 3G setting, all requests take equally long to complete, around 2 seconds.
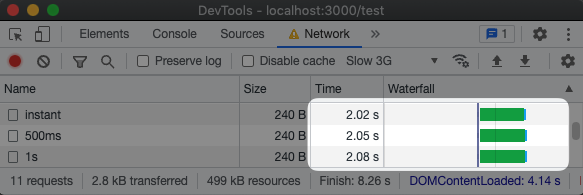
Testing your site with request-level throttling can lead to lower metric accuracy, as the underlying differences in response time are hidden.
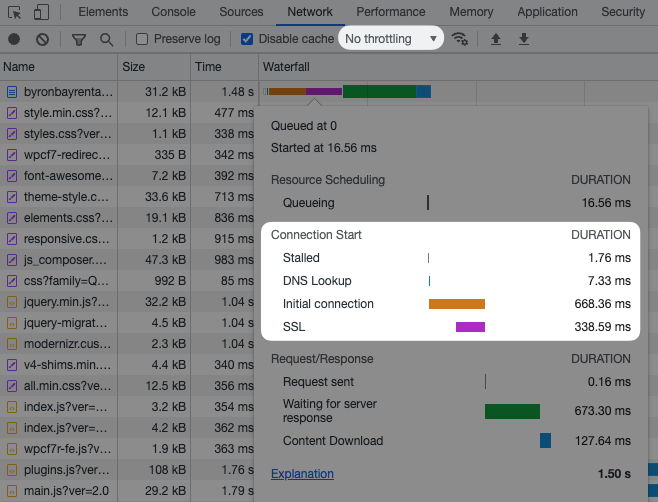
Real world example with TCP and SSL round trips
When first connecting to a site the browser needs to look up DNS records and then establish TCP and SSL connections. Only after that can it send the actual HTTP request.
These network round trips are only needed for the initial request to the server. Subsequent requests simply reuse the existing server connection, requiring only one round trip for the HTTP request (and possibly more to download the response).
DevTools doesn’t slow down all of those steps to set up a connection, it simply applies a minimum delay to the server response time. To make up for it, the delay is extended by a certain factor, defined by Chrome.
This works well for the first request due to the adjustment factor / equivalency mentioned in the tables above. But it also slows down subsequent requests disproportionately, making them slower than they would be in reality.
No throttling
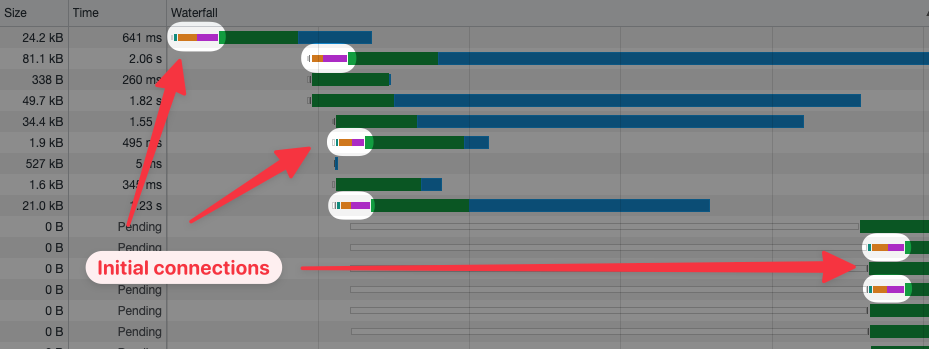
In the waterfall below, the first request includes the steps needed to establish the connection. All the requests after that are faster, since they can simply use the already established channel.
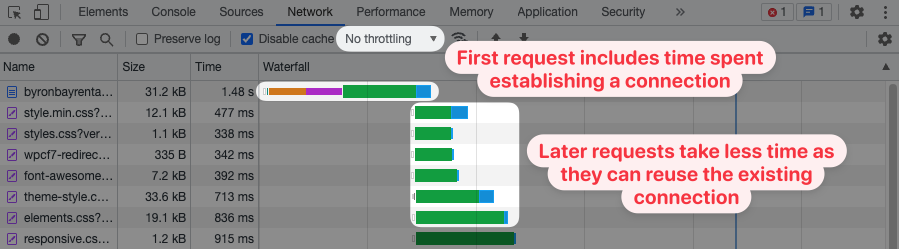
Let’s take note of the fact that establishing the TCP and SSL connections takes 668 milliseconds.
Slow 3G throttling
After enabling throttling, establishing the connection takes 695 milliseconds, which is basically the same as the unthrottled request. We can tell that Chrome is not slowing down the network at this stage.
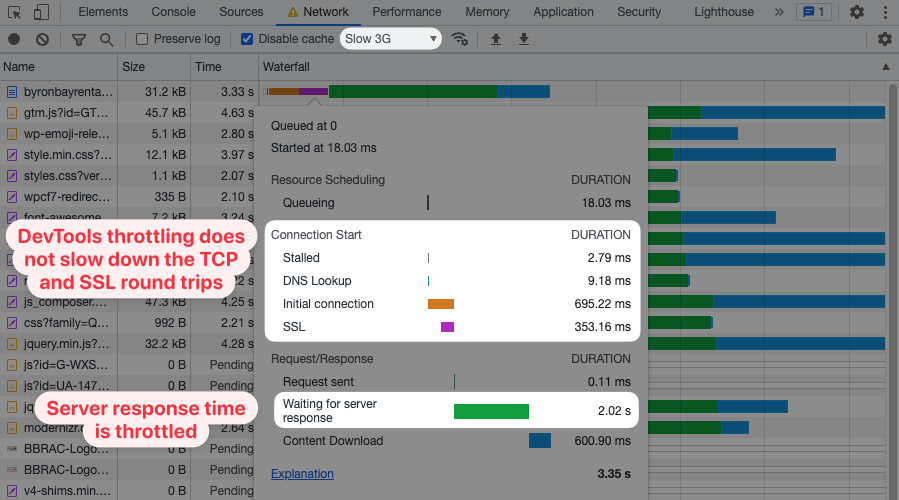
The server response time (TTFB) is increased to 2 seconds.
This large increase in latency is applied to all requests on the page, not just the initial request that consists of multiple network round trips.
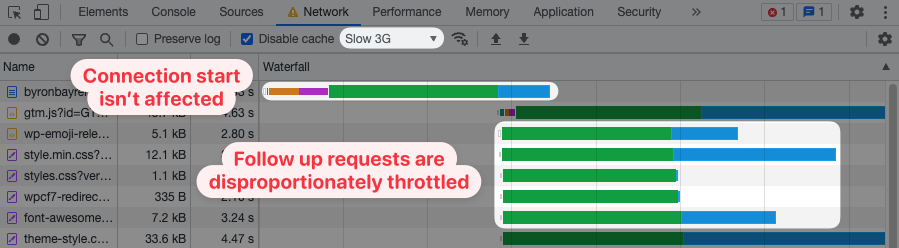
The throttling method used by Chrome’s DevTools is only an approximation of an actually slower network. The connection starts equally fast and to compensate for this the TTFB throttling is increased.
When trying to replicate those findings on your own, make sure to clear the connection cache to get accurate results.
Limitations of DevTools bandwidth throttling
Throttling network bandwidth in DevTools can also introduce inaccuracies compared to a real slow network.
Normally different requests have a certain request priority and order. Servers send high-priority responses first and low-priority ones later.
However, DevTools bandwidth throttling divides available bandwidth equally across requests. That means a high-priority file might load early for real visitors, but load slowly in DevTools.
Network throttling in Safari
Safari's developer tools no longer offer built-in network throttling functionality. Instead, you can install the Network Link Conditioner as an Xcode tool to slow down the network on your device.
Using DevTools throttling with Lighthouse
Lighthouse can analyze the loading experience of your website and point out the biggest issues.
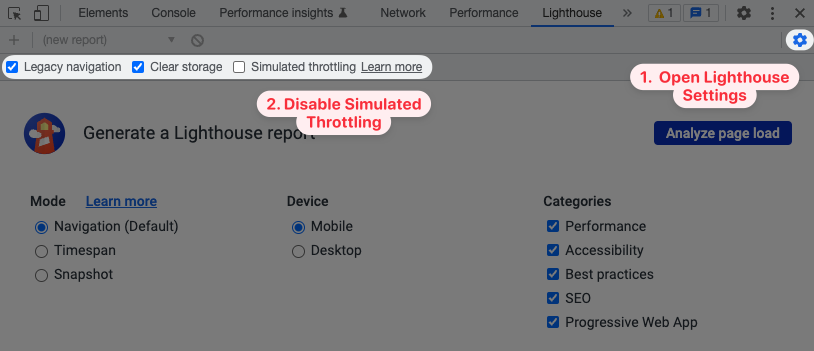
It uses simulated throttling by default. This works by sending unthrottled requests to the website and then simulating what the metrics would have been on a slower connection.
In contrast, DevTools throttling is a type of applied throttling where the page actually loads more slowly. It's generally more accurate than simulated throttling.
To run Lighthouse with DevTools throttling, open the advanced settings in the DevTools Lighthouse tab and uncheck Simulated throttling.
Monitoring your website with packet-level throttling
Packet-level throttling slows each individual network round trip at the operating system level. It's more accurate than both simulated throttling and DevTools throttling.
However, it can also be hard to set up, as it requires admin rights and affects all programs running on your computer.
DebugBear is a site speed testing tool that uses packet-level throttling to collect high-quality data. Start a free trial and monitor Core Web Vitals in our lab environment.
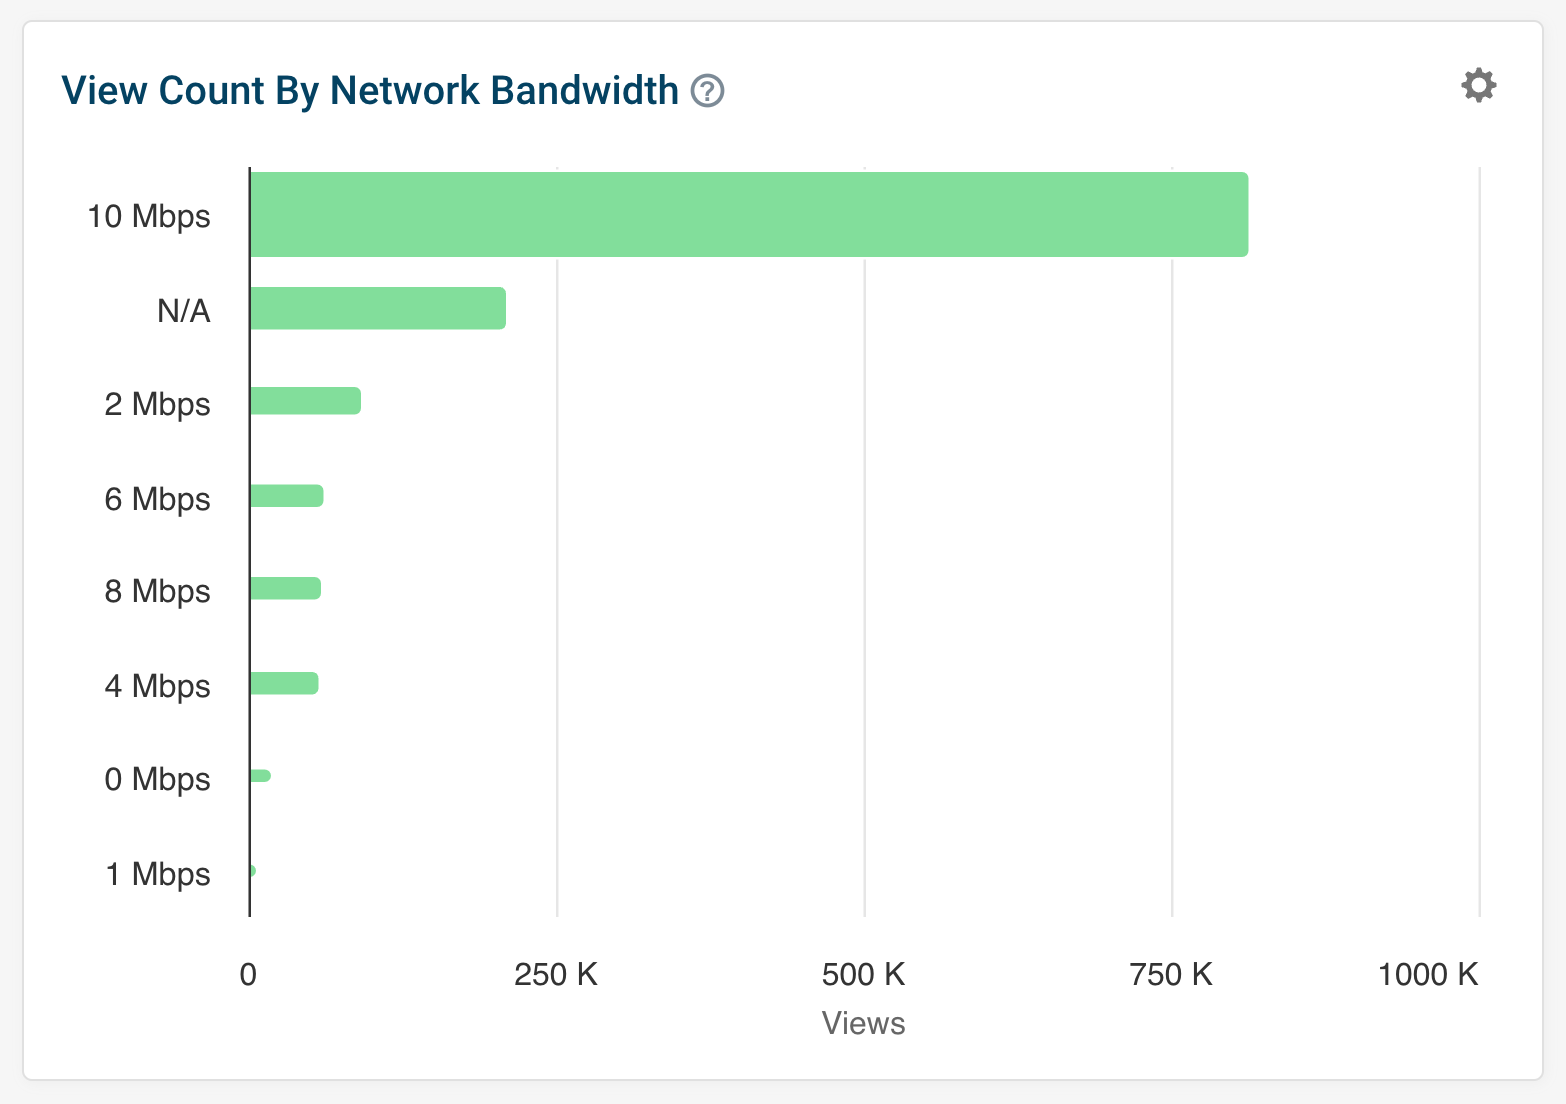
You can also use DebugBear to monitor your website's performance from real-world users. Individual user sessions are captured, so you can understand what type of network conditions a particular user experienced. In addition, you can see a combined view of all user sessions to understand the most common network conditions.


Monitor Page Speed & Core Web Vitals
DebugBear monitoring includes:
- In-depth Page Speed Reports
- Automated Recommendations
- Real User Analytics Data