
Google Lighthouse is the most widely used automatic testing tool for website performance and quality. It provides website operators with insights on how they can improve visitor experience.
This article looks at the different options you have for running a Google Lighthouse speed test and how to read the Lighthouse report.
What is Google Lighthouse?
Lighthouse is a free tool developed by Google that analyzes your website and generates a report on your page speed, accessibility, and SEO.
All you need to do is provide your website URL and Lighthouse automatically runs through a large number of individual checks (called audits). You can see how well you do on each audit and what you can do to improve.
How to use Google Lighthouse
You can use a number of tools to collect page speed test results with Lighthouse:
- PageSpeed Insights
- Chrome DevTools
- DebugBear Website Speed Test
- Lighthouse CLI
Let's take a look at each tool and see how they are different from each other.
Run Lighthouse on PageSpeed Insights
The easiest way to run Lighthouse is to use Google's official PageSpeed Insights tool that's built on top of Lighthouse.
Enter your website URL and click Analyze to start your page speed test. PageSpeed Insights can run tests from four different test locations and automatically selects the one that's closest to you.
Once your test is complete you will find real user data from Chrome User Experience Report (CrUX) at the top of the page.
Below that you find the Lighthouse report under the "Diagnose performance issues" section.
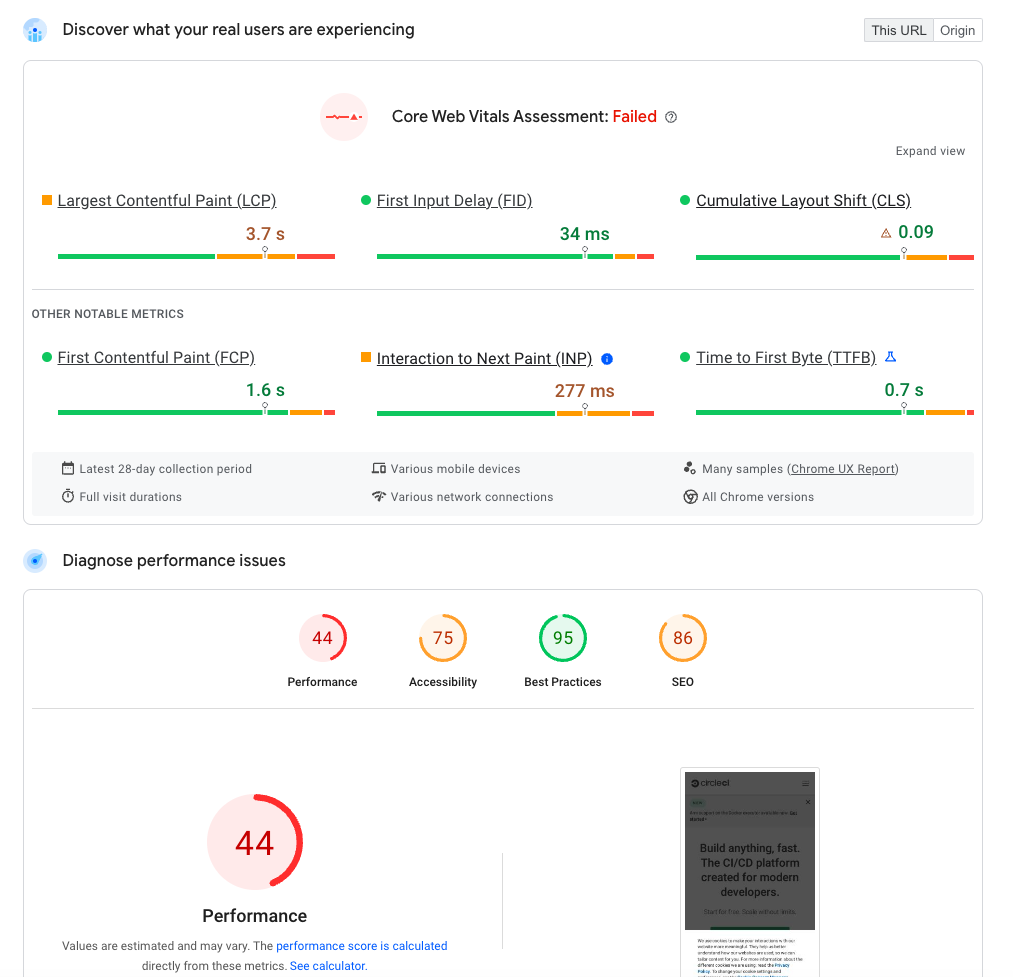
The top of the Lighthouse report provides a high-level Performance score. Below that you can find the individual opportunities for optimization ranked by estimated impact.
Read our detailed guide to PageSpeed Insights to learn how to best use Google's free web performance tool.
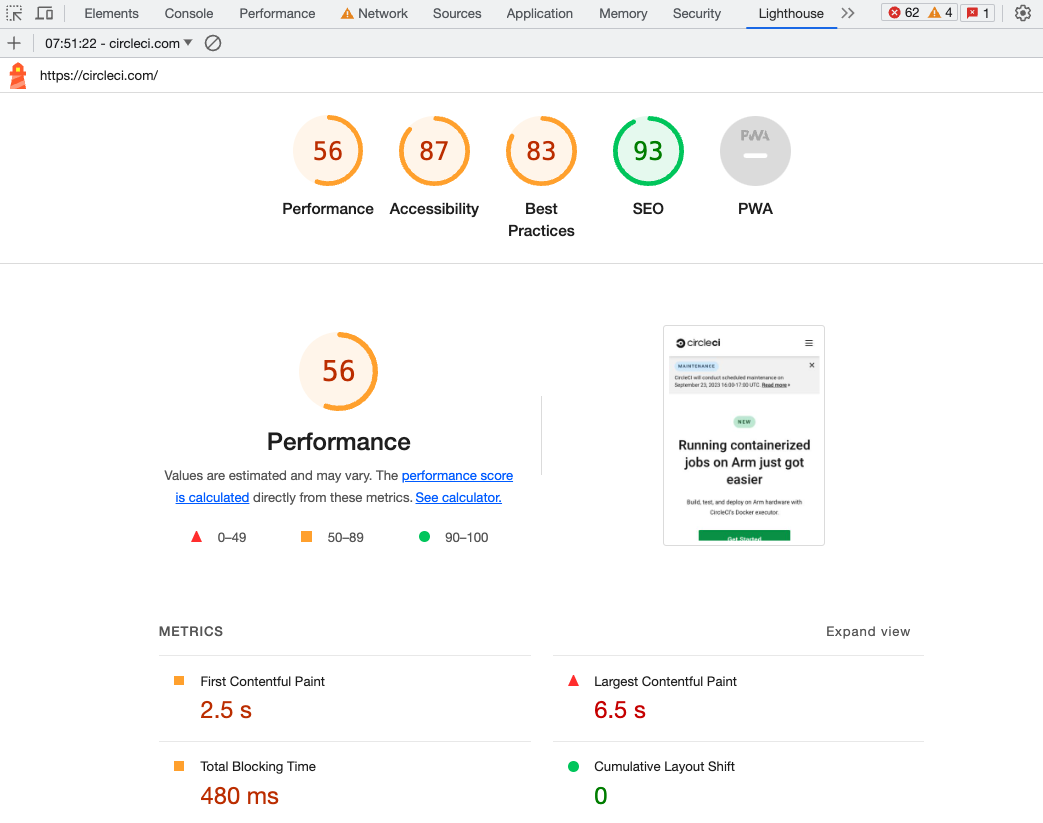
Run Lighthouse in Chrome DevTools
Lighthouse is directly integrated into Chrome's developer tools. Simply open the developer tools (via right-click + Inspect) and then select the Lighthouse tab.
Select whether you want to test mobile or desktop performance and then click Analyze page load to start the test.
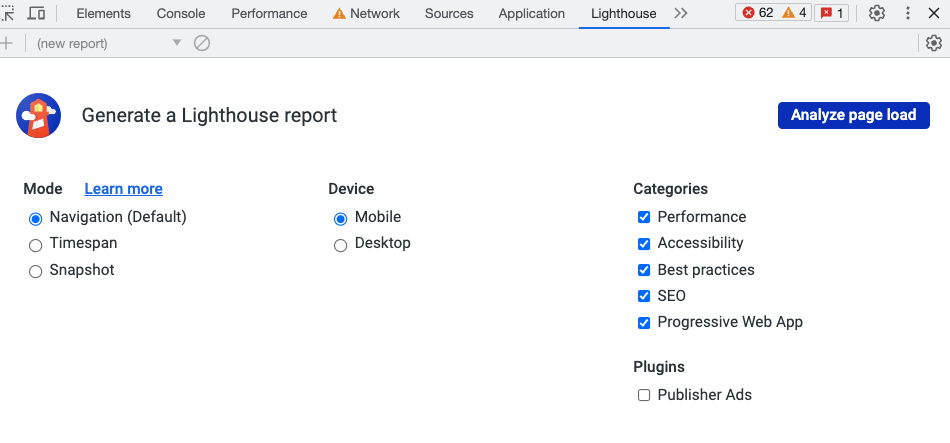
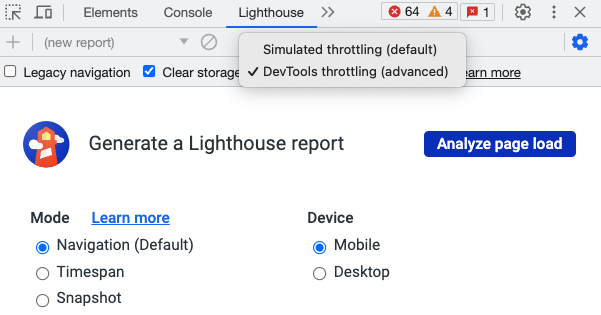
Running Lighthouse in DevTools offers more configuration options than are available on PageSpeed Insights.
For example you can select either the default simulated throttling or DevTools throttling. To view this setting, first click on the gear icon in the top right. DevTools throttling takes a bit longer but usually provides more reliable data.
Sometimes you might see different scores between Lighthouse on PageSpeed Insights and in other tools.
Run Lighthouse on DebugBear
DebugBear offers a free website speed test that's built on top of Lighthouse. In addition to running Lighthouse the tool also collects real user CrUX data and provides custom reports.
You'll also get the most reliable lab data as DebugBear uses realistic packet-level throttling.
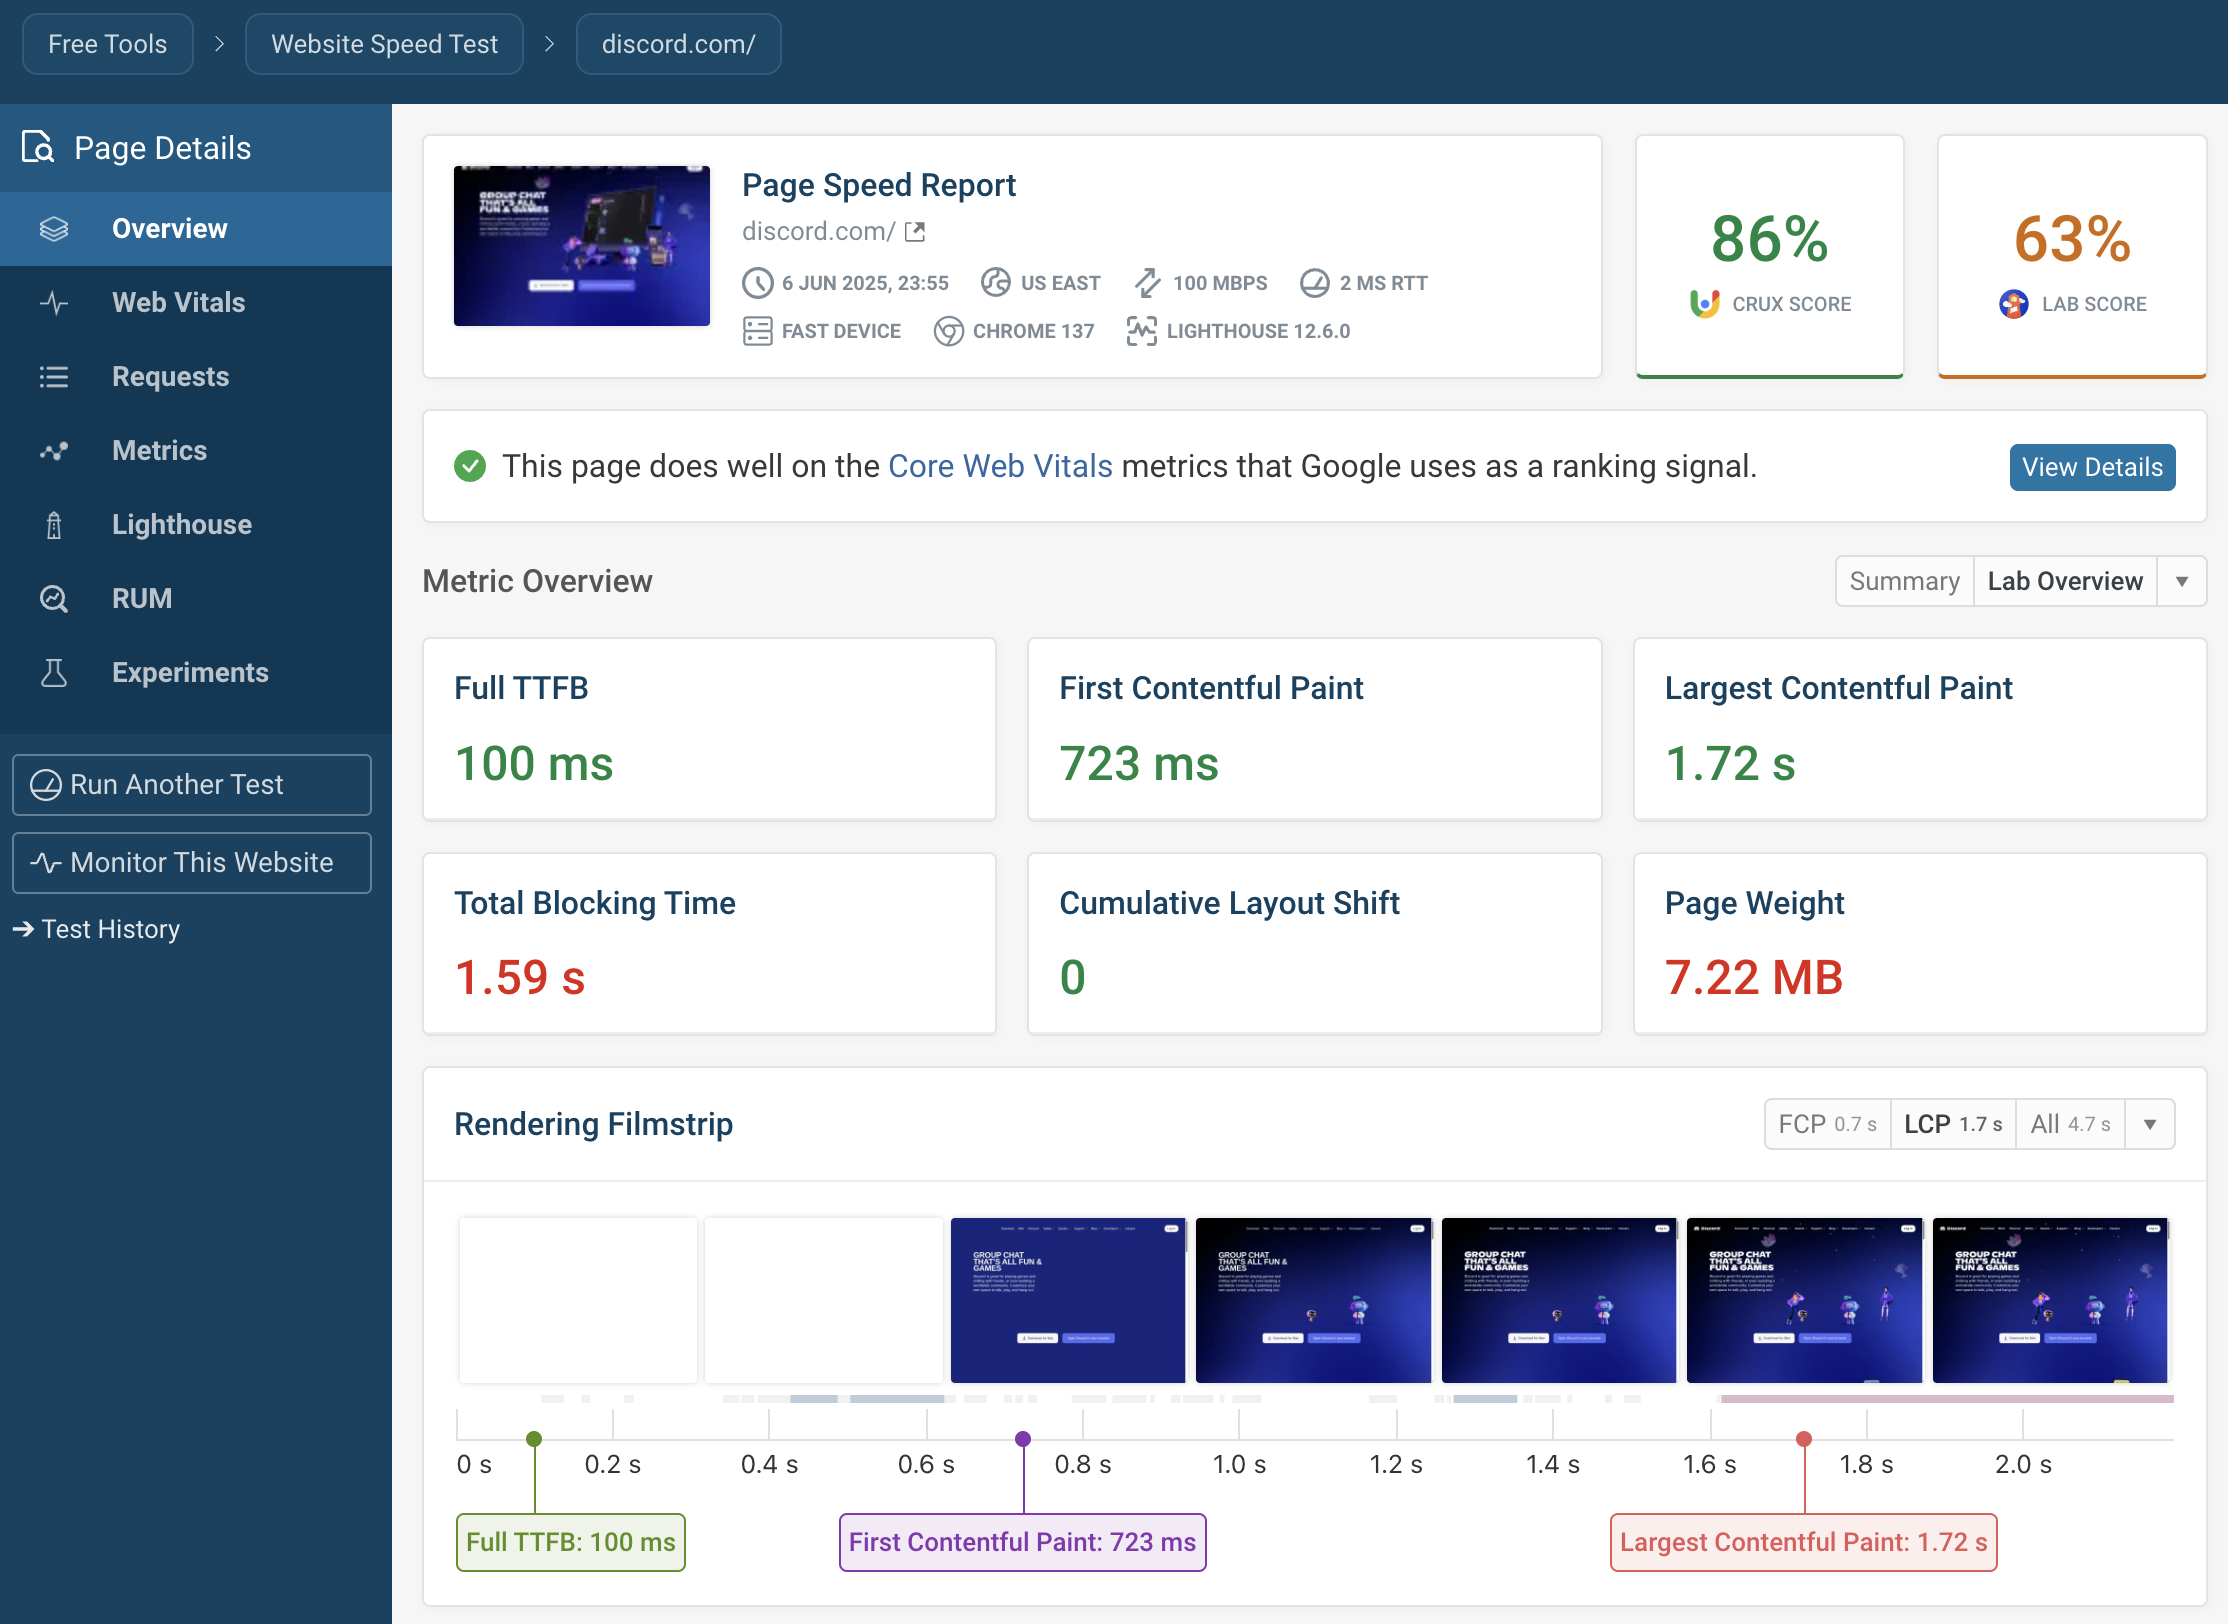
In addition to the Lighthouse test result you also get additional performance recommendations and more advanced analysis tools like a request waterfall.
Our guide on how to improve website performance explains how to use the DebugBear page speed test to identify page speed issues on your website and how to find solutions.
Run Lighthouse with the CLI
Lighthouse offers a feature-rich command line interface (CLI). If you already have Node.js installed on your computer you can run npm install lighthouse -g to globally install Lighthouse on your device.
Then run a Lighthouse test like this:
lighthouse --view https://www.example.com
The --view option means that Lighthouse will automatically open the generated HTML report in the browser for you to see.
As Lighthouse is running the test you can see each step that it takes.
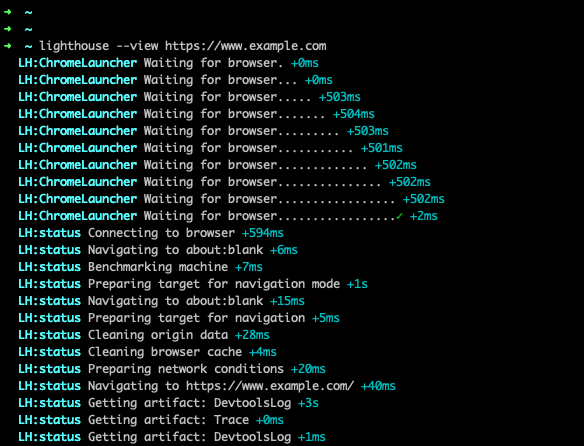
You can pass in various advanced options, for example the throttling method or the network round trip time (RTT). In the example below we use an RTT of 5 seconds, so the test result will be extremely slow.
lighthouse --view https://www.example.com \
  --throttling-method devtools \
  --throttling.rttMs 5000
Run lighthouse --help to get an overview of all available options.
Google's Lighthouse report explained
Once Lighthouse has analyzed your website it generates a report providing a rating for your website as well as a list of specific recommendations on what you can improve.
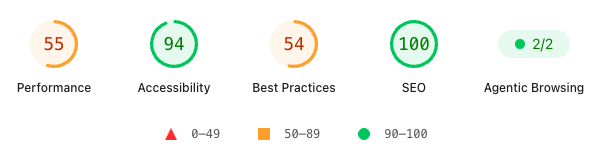
The report includes scores across five categories:
- Performance: how fast does your website load?
- Accessibility: can visitors with visual impairments use your website easily?
- Best Practices: does your website have errors or is it using outdated web features?
- SEO: can search engines crawl your site and read it successfully?
- Agentic Browsing: can AI agents interact with your website effectively?
How to use the Lighthouse page speed report
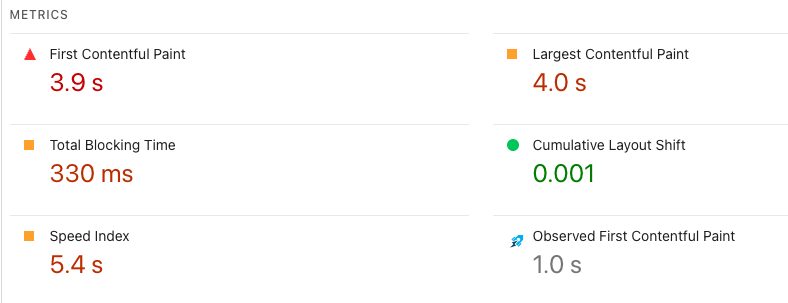
The Performance section of the Lighthouse test result is the most important part of the report. Lighthouse measures how fast content appears on your website using different web performance metrics:
- First Contentful Paint: how quickly does some content start to appear?
- Largest Contentful Paint: how long do visitors wait for the main page content?
- Speed Index: how quickly does the website load overall?
In addition to these load time milestones, Lighthouse also measures CPU processing time with the Total Blocking Time metric and visual stability with the Cumulative Layout Shift metric.
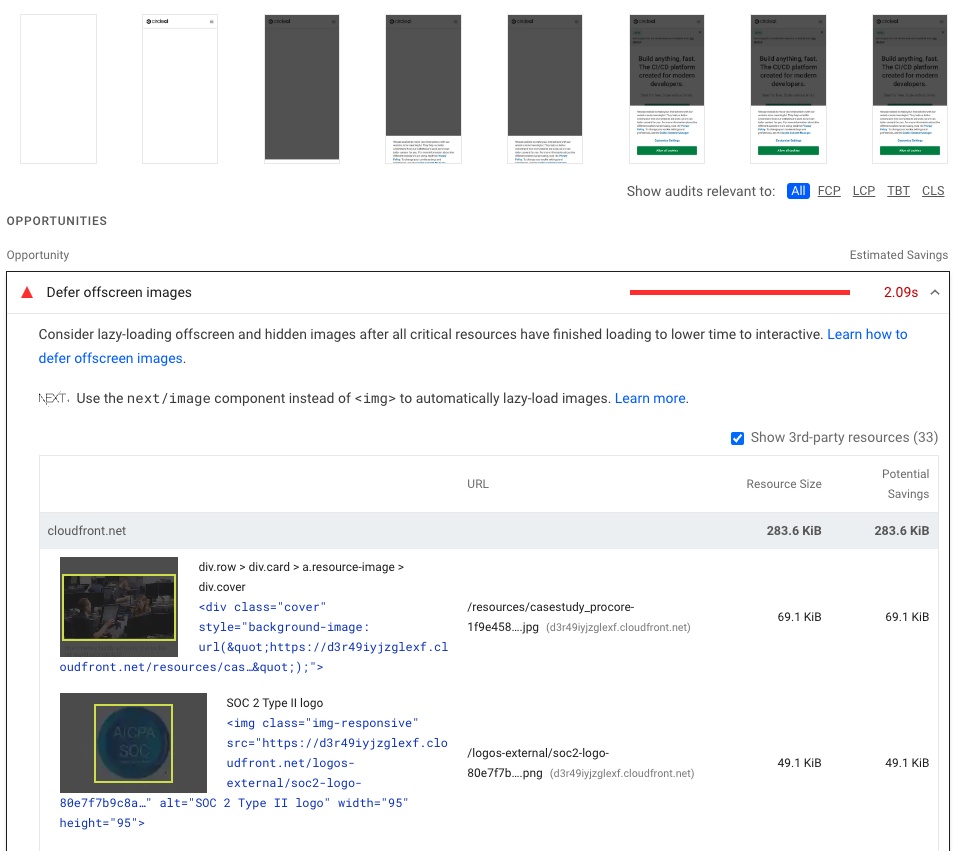
Below the metrics Lighthouse lists a number of performance insights, sorted by the impact of issue. Each issue reported by Lighthouse can delay how quickly your website loads.
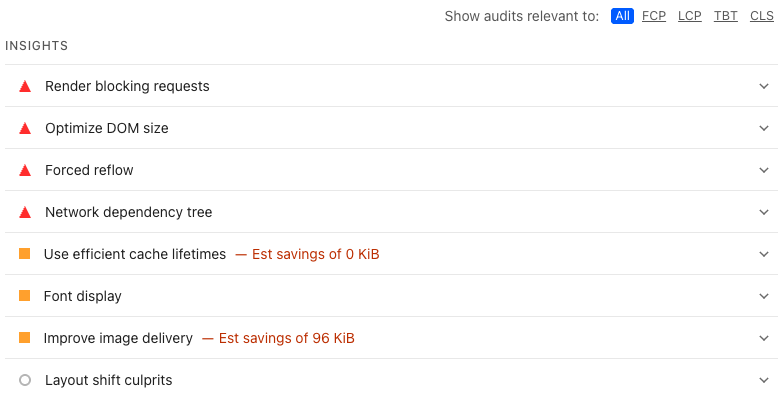
You can click on each insight to learn more about what's holding back page speed and what you can do to improve your website performance.
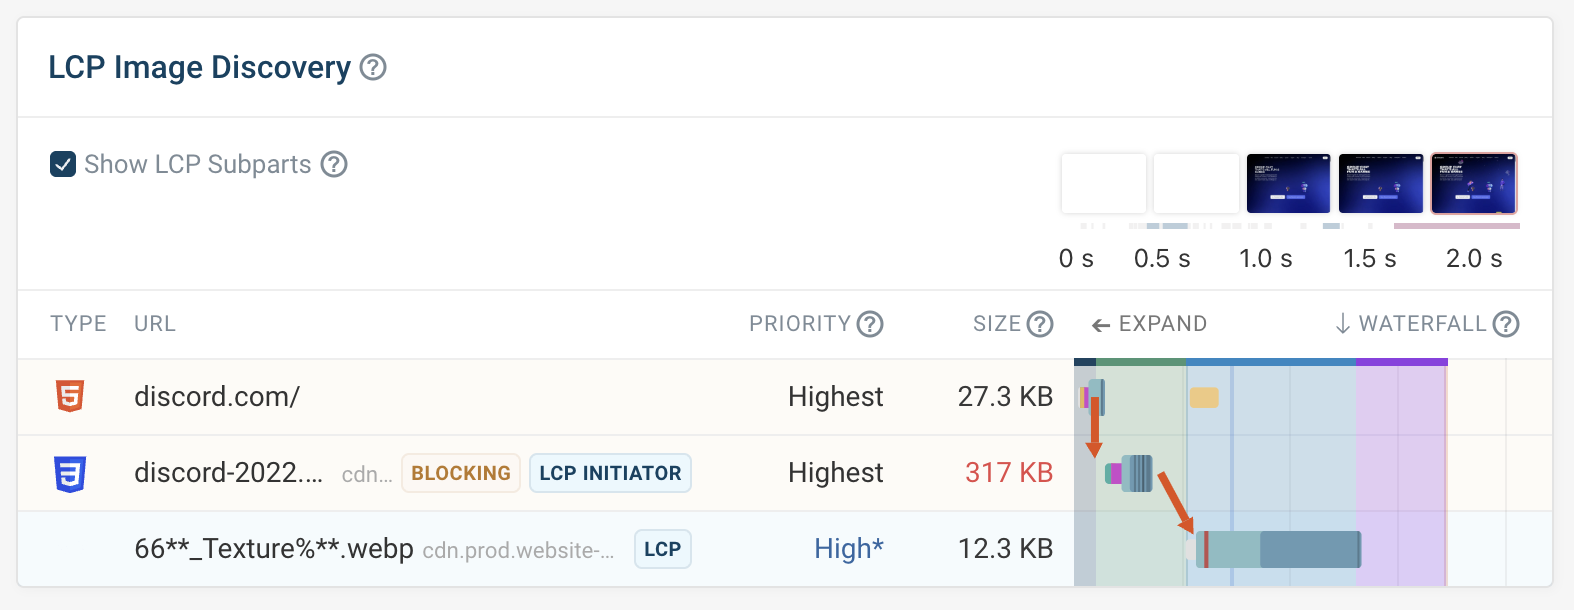
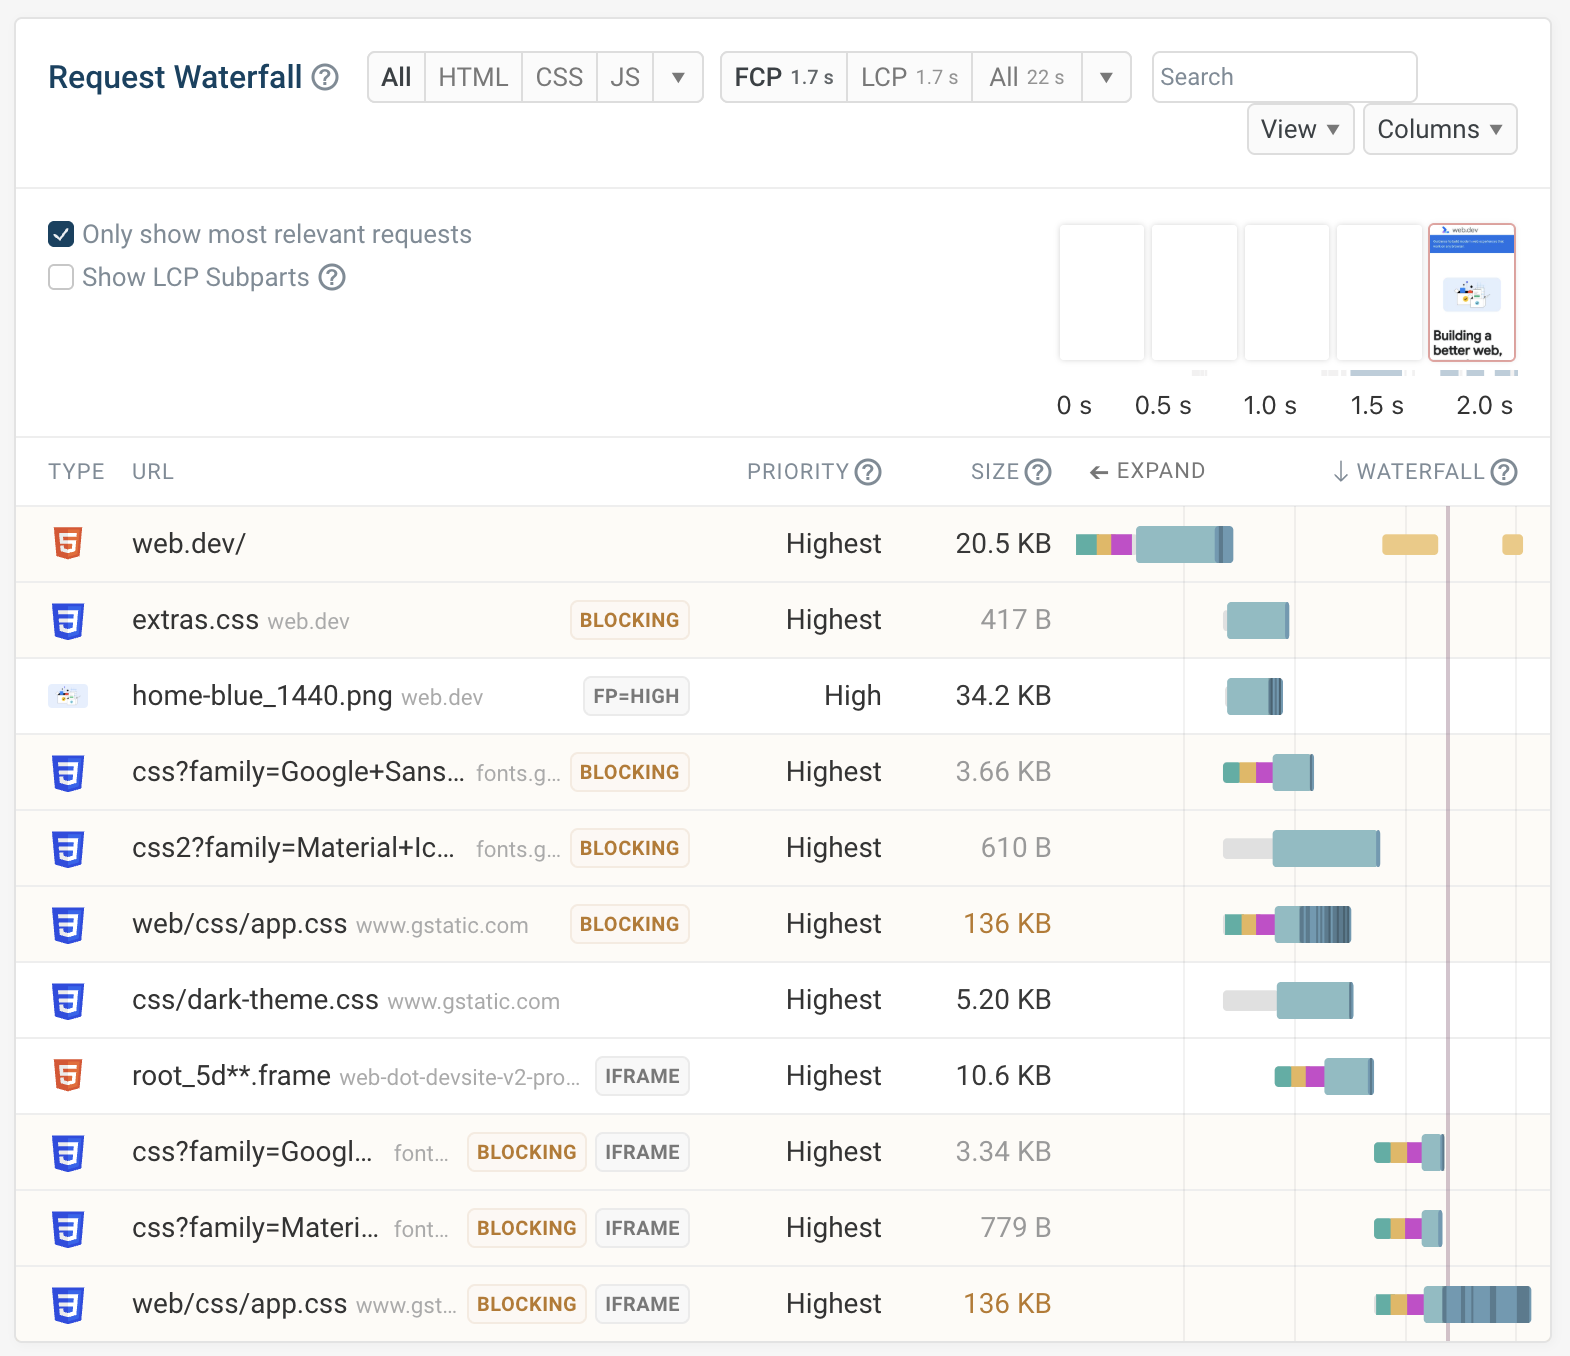
For example, render-blocking requests are a common page speed issues. These are resources that the browser has to download before they can even start displaying website content.
The detailed audit view shows the full URL of each resource, as well as the download size and estimated performance impact.
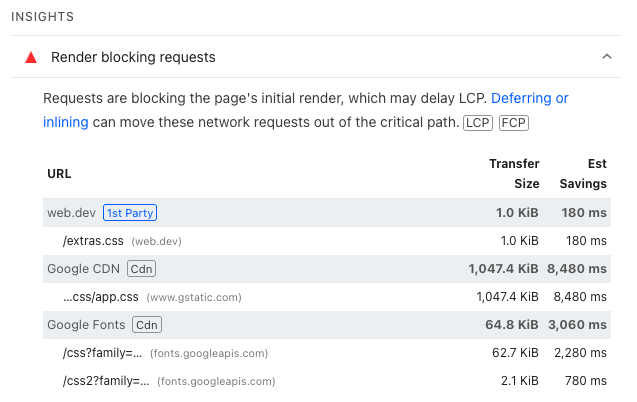
A request waterfall visualization can help you gain additional insights into how render-blocking resources are impacting page load time on your website. Get one for your website with our free website speed test.
Other common page speed insights reported by Lighthouse are:
- Optimize DOM size: complex pages can be slow to load and interact with
- Improve image delivery: reduce image file size so they download faster
- Use efficient cache lifetimes: use caching to speed up navigations beyond the first visit
- LCP request discovery: make sure the browser quickly finds the main image on your site
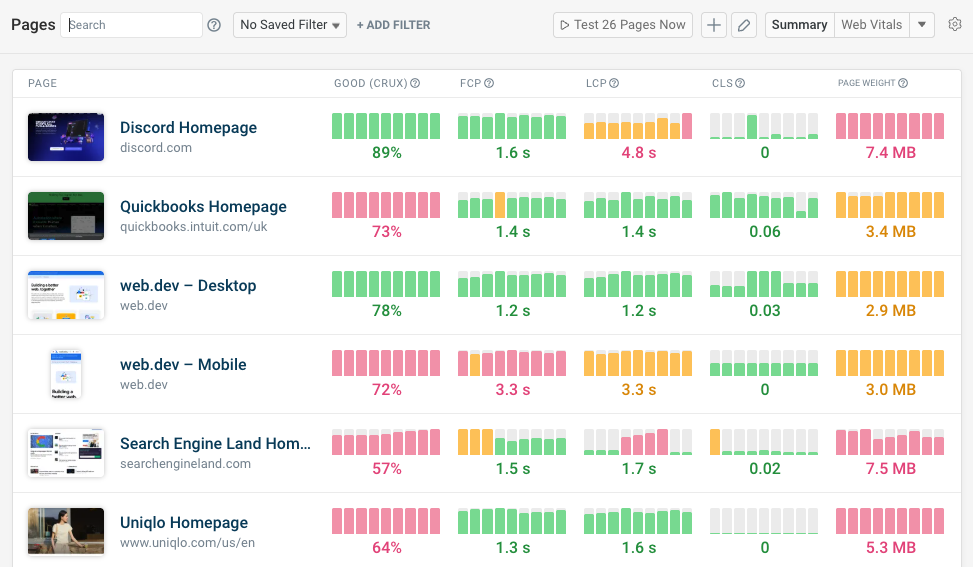
Monitor your Lighthouse scores over time
Depending on how you run your Lighthouse test you have different configuration options and get data of different quality. DebugBear can monitor your Lighthouse scores over time and provide high-quality page speed metrics.
You'll get alerts when there's a performance regression, telling you exactly what audit is causing an issue.
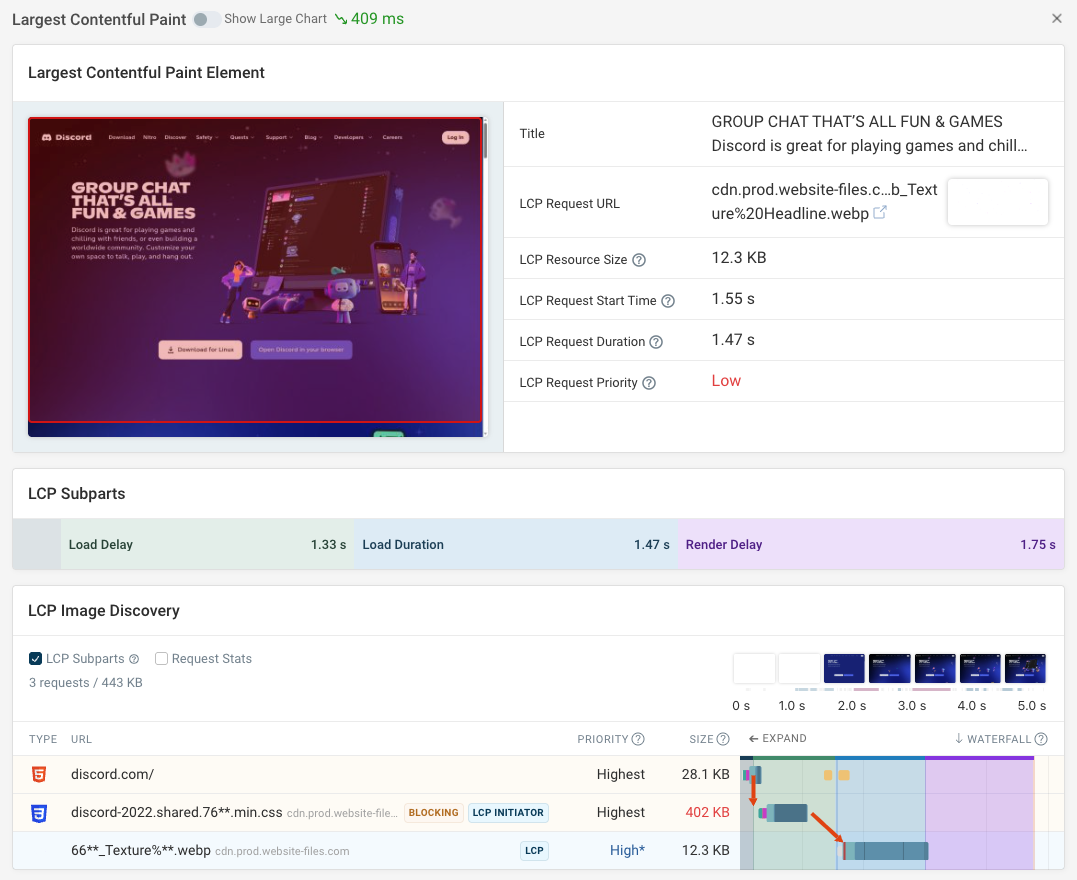
DebugBear synthetic monitoring provides reporting that goes beyond Lighthouse audits, for example a detailed Largest Contentful Paint image analysis and custom performance recommendations.
Google's Core Web Vitals metrics impact user experience and SEO. To get a complete view of your web vitals data, DebugBear also offers real user monitoring and the ability to benchmark your website speed against other sites in your industry.


Monitor Page Speed & Core Web Vitals
DebugBear monitoring includes:
- In-depth Page Speed Reports
- Automated Recommendations
- Real User Analytics Data