The Core Web Vitals are a set of user experience metrics that Google uses as part of its search result rankings. But how easy is it to game them?
Setting up a test page
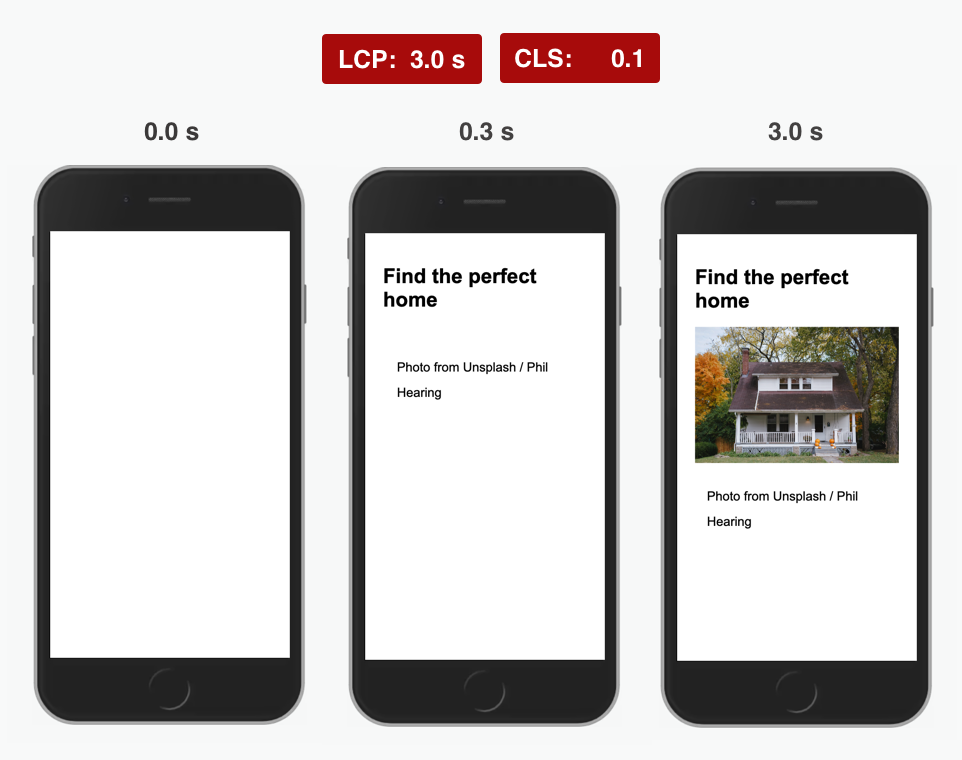
I created a test page where the largest element is a 5 MB image. We get a high Largest Contentful Paint (LCP) value, as the image takes a while to download and render.
When the image appears it pushes down the image attribution below it. This layout shift increases the Cumulative Layout Shift (CLS) metric.
Let's see how we can solve these issues.
Largest Contentful Paint
Let's review what LCP measures:
The Largest Contentful Paint (LCP) metric reports the render time of the largest image or text block visible within the viewport, relative to when the page first started loading.
The LCP element on the test page is the img tag with the 5 MB picture. Can we convince the browser the element isn't actually visible?
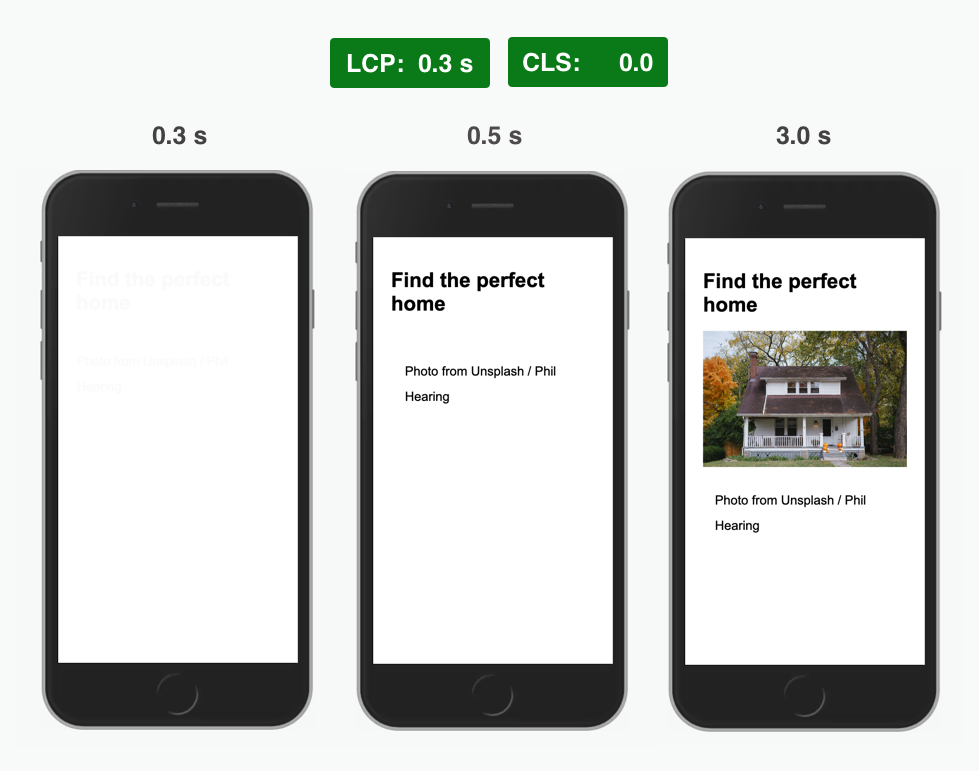
If we set the image opacity to 0 and only fade the image in once it's been downloaded then the LCP will only update when the animation is complete.
To prevent the LCP from updating we set the animation duration to 1 day, or 86400 seconds.
<img
  src="house.jpg"
  style="width: 100%; opacity: 0;"
  onload="this.style.animation = 'fadein 86400s forwards'"
/>
Our fadein animation then looks like this, instantly showing the image.
<style>
  @keyframes fadein {
    from {
      opacity: 0;
    }
    0.000001% {
      opacity: 1;
    }
    to {
      opacity: 1;
    }
  }
</style>
The slow image is now no longer the LCP element. Instead, the LCP value is determined by the h1 tag that appears as soon as the page starts to render.
An alternative LCP trick
DevisedLabs demonstrates an alternative LCP hack using a very large image.
They insert an image overlay containing a transparent SVG at the top of the body tag. This image renders right away, and is the largest page element.
The pointer-events: none CSS style ensures users can still interact with the underlying page.
Cumulative Layout Shift
The slow LCP metric is fixed now, but we still need to fix the layout shift that occurs when the image pushes down the image attribution.
A layout shift occurs any time a visible element changes its position from one rendered frame to the next.
Again we can use the opacity animation to make the p tag "invisible":
setTimeout(() => {
  const style = document.createElement("style");
  style.innerHTML = `
    *:not(img) {opacity: 0; animation: fadein 86400s forwards}
  `;
  document.documentElement.appendChild(style);
}, 200);
- we exclude the
imgfrom the CSS selector as the element still needs to be invisible when the image download finishes - we use
setTimeoutto delay adding the style tag as otherwise no LCP value would be recorded at all
Unfortunately showing and hiding the content causes a flicker. We can fix this by making the content nearly invisible from the start (but not totally invisible as that would prevent a contentful paint).
<style>
  * {
    opacity: 0.01;
  }
</style>
Problem solved!
Alternative approach
Another way to prevent layout shifts is replacing the DOM element that gets pushed around with a new element containing identical HTML code. For example, you can overwrite the body HTML to regenerate the DOM nodes:
document.body.innerHTML = document.body.innerHTML;
You'd need to do this just before the image renders – running this code in the onload listener is too late. But that can be worked around by cloning the img tag, removing the src attribute from the original, waiting for the cloned tag to download the image, and then restoring the src attribute and regenerating the DOM.
The downside of this approach is that interactive parts of the replaced content can break, as the new DOM nodes won't have the same event listeners as before.
Interaction to Next Paint
Interaction to Next Paint looks at the latency for a given interaction.
A lot of potential "hacks" are just genuinely good for users:
- Breaking CPU activity into several separate chunks means DOM event handlers can run in-between without delay.
- Designing the UI to discourage user interaction before the app is ready also improves user experience.
I also don't think it's possible to create a fake user interaction, for example by calling dispatchEvent.
However, this could work:
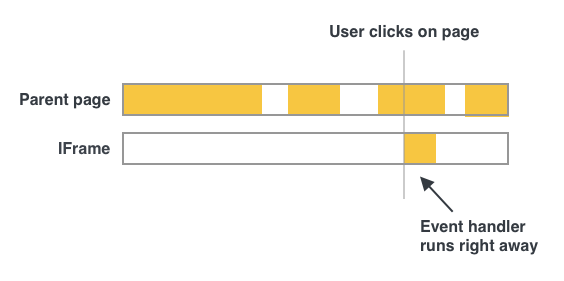
- Cover the page in a transparent full-screen iframe overlay.
- The user tries to interact with the busy page, but actually interacts with the iframe.
- When the app is ready remove the iframe.
The iframe main thread would be idle and user input can be handled without delay.
Google says iframes are considered when scoring Web Vitals, but it's unclear how exactly this works. Either way, there's no long interaction delay in the main frame as the user never interacted with it.
Performance metrics have definitions
Website performance metrics have moved away from purely technical measurements (server response time, page download size) to more user-centric assessments. These metrics provide more insight on end-user experience, but they also have more complex definitions.
This post explained how one could make content "invisible" to improve Web Vitals, but developers also run into the opposite problem. Fast-loading elements that are not counted because they have an opacity animation can lead to a worse LCP metric.
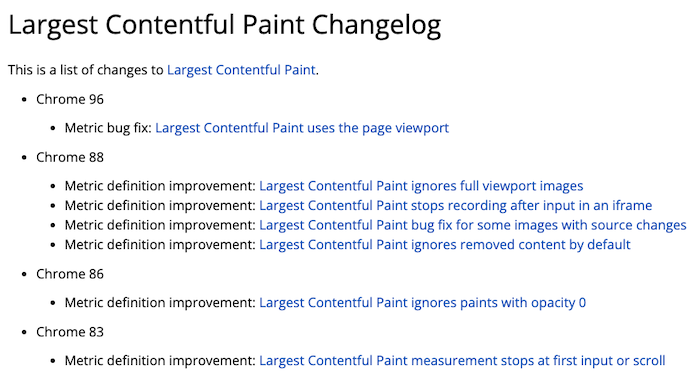
The metric definitions change over time, so a new version of Chrome can introduce shifts in metric values. Google publishes a Web Vitals Changelog detailing the refinements that have been made.
There's also an open Chromium bug on the opacity loophole, and it will likely be fixed eventually.
What does this mean for Core Web Vitals?
Google's adoption of Core Web Vitals as a ranking signal has drawn the attention of website owners towards web performance.
While it's possible to game the metrics, site speed improvements not only improve SEO, but also lead to better user experience and higher conversion rates. So site owners will at least consider finding a proper solution.
Gaming the metrics also requires custom implementation work, and risks accidentally breaking functionality or causing content to flash. There's no simple script that automatically "fixes" measured Web Vitals for all websites. As browsers update their metric definitions workarounds will require ongoing maintenance while real solutions won't need to be updated.
Automatically scoring user experience is hard, some fast sites will be wrongly assessed as slow, and some slow sites will use workarounds to achieve better metrics. Site speed is only a small component of the overall search result rankings, and the new metrics often provide meaningful feedback to website owners.
Caveats
I've assumed that Google Search uses the standard Chrome APIs and metric definitions to assess Web Vitals. This seems like a reasonable assumption, as duplicating this would be a lot of work and show up in the Chrome source code.
While I was able to improve the metrics reported for the test site, I didn't try this out on a production site (you'd need to wait 28 days to see the full results in the Chrome UX report).
Related articles
Hopefully this post helped you develop a deeper understanding of how the Core Web Vitals work and why you might sometimes not see the values you'd expect.
I've also written about why lab and field data are often different on PageSpeed Insights, and why Lighthouse scores differ based on the environment where the test is run.
Can you get perfect Core Web Vitals without making your site any faster?
— DebugBear (@DebugBear) October 21, 2021
This article explores how the metrics are defined and whether there are any loopholes.https://t.co/D5F5Kk0eIR