Measure And Optimize Cumulative Layout Shift (CLS)
Cumulative Layout Shift (CLS) is one of the three Core Web Vitals metrics that impact search result rankings in Google.
CLS is a measure of how user experience is impacted by unexpected layout shift. Ever clicked a button only to have it move at the last second? That's layout shift in action, created when content moves around on the page after the initial load.
This article takes a closer look at what layout shift is, how you can measure it, and how CLS can be optimized.
What is Cumulative Layout Shift?
The Cumulative Layout Shift metric measures visual stability. Your CLS score increases when page content moves around after being rendered.
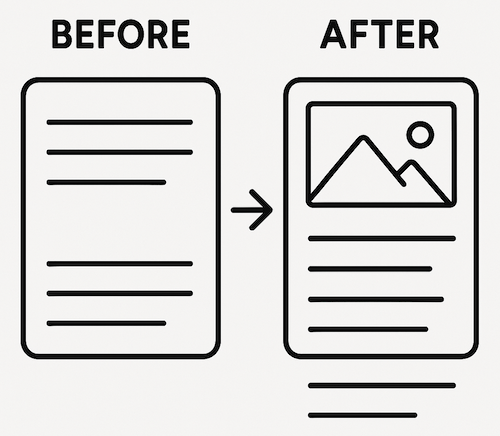
Here's an example where an image appears at the top of the page after the website text has already been rendered. As a result, the text shifts down on the page.
You may have experienced a website where the page loaded initially and then a header or advertisement was injected into the top of the page causing the rest of the page to shift downwards.
CLS is used to measure this kind of visual instability as it may interfere with user actions such as clicking buttons or just reading text. It measures user frustration caused by a jumpy webpage.
While most of the time visual instability is only disorienting, in some cases it can lead to an accidental payment or form submission.
Cumulative Layout Shift Example
This filmstrip demonstrates content shift after initial render. The banner's load pushes the heading and article downward.
For this page the CLS value is 0.13.
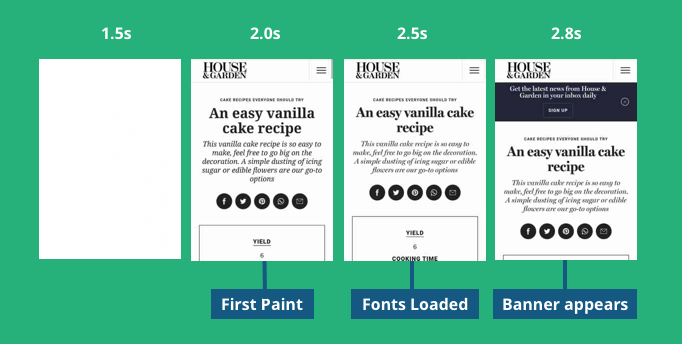
If you look closely there are actually two layout shifts on this page. The first one occurs after 2.5s when the web font loads, causing the title and description to re-render. After this, the description takes up a little less space, and the content below it shifts upward.
How is CLS calculated?
Think of Cumulative Layout Shift as an "unexpected movement score" for your webpage. It's calculated by summing up individual layout shifts in a certain time window, which can cover up to 5 seconds.
Originally CLS measured total layout shift throughout the lifetime of the page. The new windowed definition was introduced in May 2021.
Each individual layout shift is scored based on two components:
- the impact fraction measures how much of the screen area is impacted
- the distance fraction measures how far an element has moved
The final score is calculated by multiplying the two numbers.
Example calculation
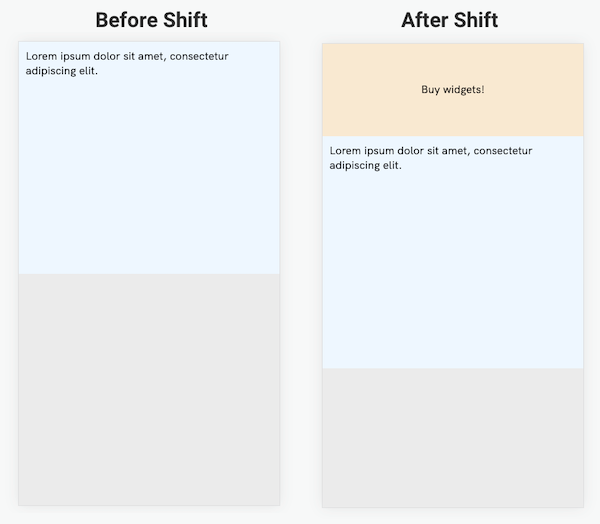
Take the example layout shift below:
- the main text takes up 50% of the screen
- the ad takes up 20% of the screen
So the total impact fraction for the shift is 70%. The main text moves down by 20% of the screen – that's the distance fraction.
The final layout shift score is 70% * 20% = 0.14.
Changes to how Cumulative Layout Shift is defined
CLS measurement varies slightly across Chrome versions. Google documents CLS definition changes here.
Browser optimizations can also improve CLS issues, for example when images that previously caused layout shift load faster and can therefore be rendered the first time page content appears. For example, Google has been working to optimize image priorities for the first five website images.
What is a good Cumulative Layout Shift score?
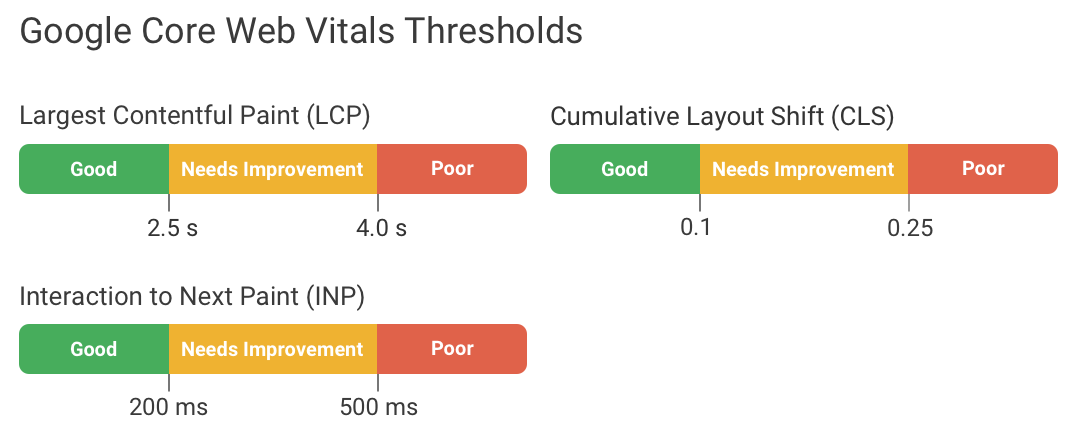
A Cumulative Layout Shift score below 0.1 is considered good for user experience. Scores ranging from 0.1 to 0.25 are considered to need improvement, while scores above 0.25 are considered poor.
Cumulative Layout Shift is one of the Core Web Vitals metrics that Google uses as a search result ranking signal.
The other two web vitals metrics you should optimize are Largest Contentful Paint and Interaction to Next Paint.
CLS and SEO: How does Google use the Cumulative Layout Shift metric?
To optimize your search rankings you need a CLS score below 0.1. But how does Google collect and use this data?
The data Google uses for search rankings comes from the Chrome User Experience Report (CrUX) which collects real user visitor data on your website if they've opted into sharing their analytics.
What that means in practice:
- Data is aggregated over a rolling 28-day period, so regressions and fixes don't show up immediately
- Interactions that happen after the initial page load are also counted, so you may have a good CLS score in lab tests but a poor score in field data
- The metrics reported are the 75th percentile of user experience, so even if the average CLS is good, the assessment will still fail if a significant fraction of visitors have a poor CLS score
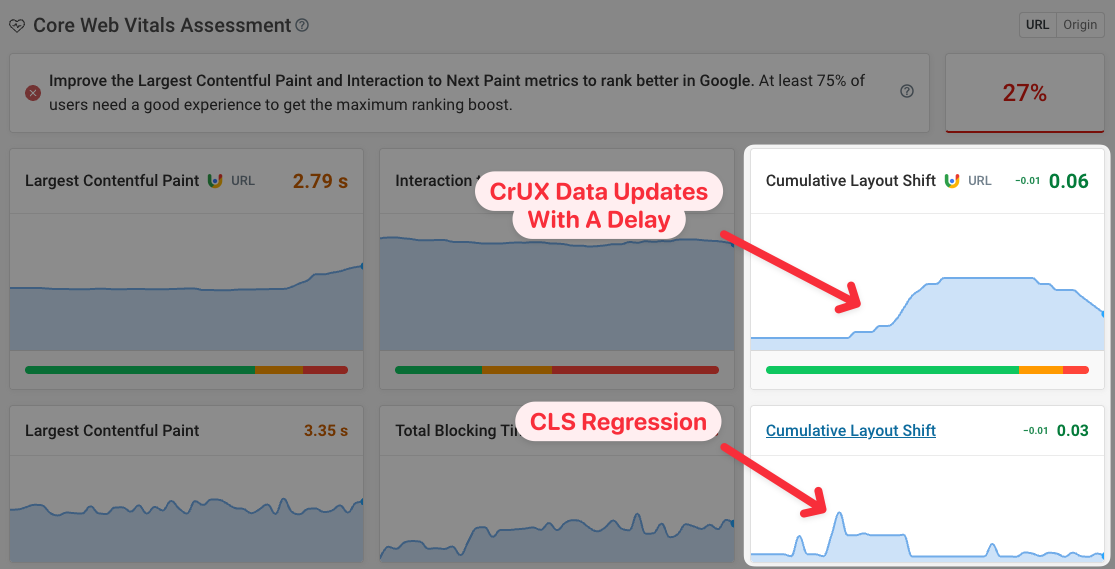
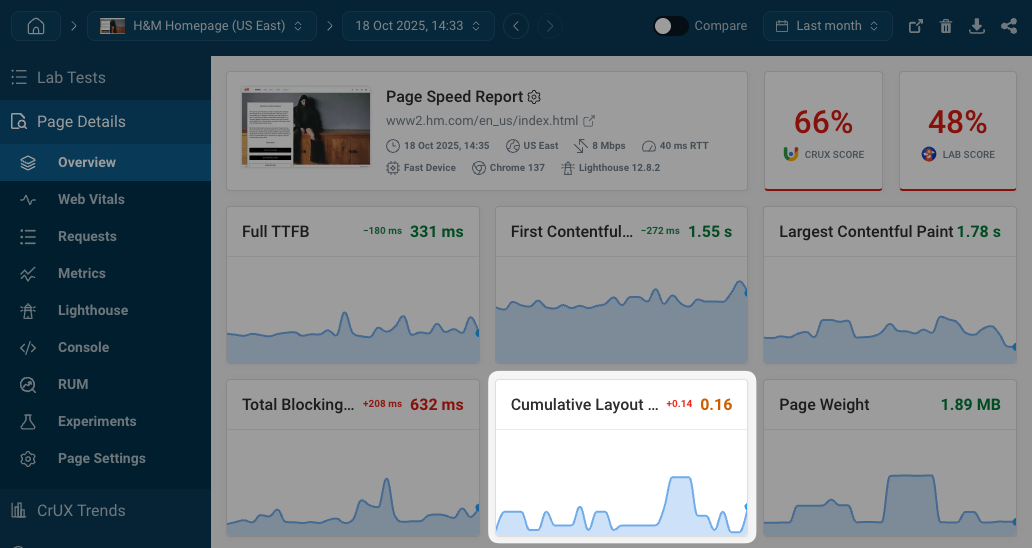
You can see an example of the data delay in this screenshot from the DebugBear monitoring dashboard. There's a regression in the CLS score, which is fixed after about a week. This shows up right away in the lab data at the bottom, but the CrUX scores at the top only start to reflect the change in user experience gradually.
How does Cumulative Layout Shift affect Lighthouse scores?
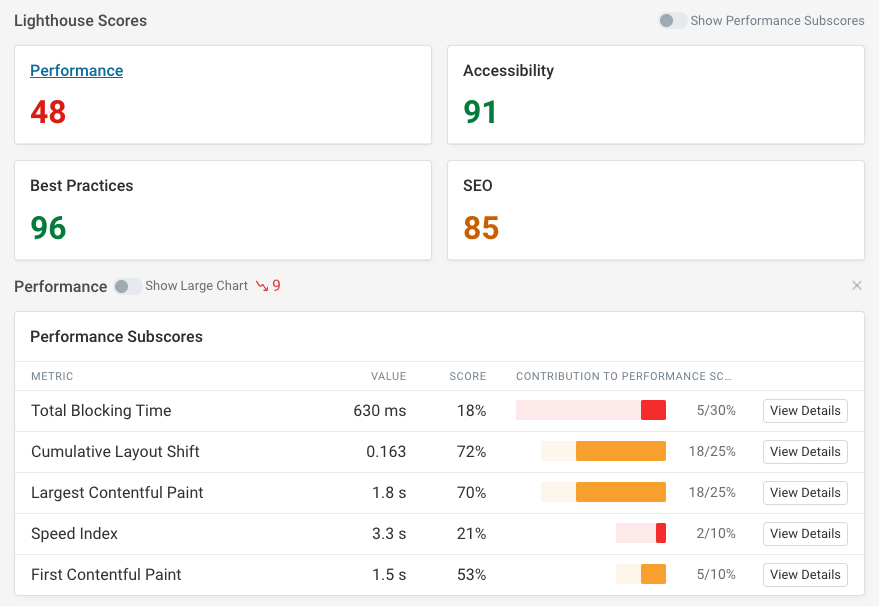
As of Version 12, Cumulative Layout Shift determines 25% of the overall Lighthouse Performance score.
The performance subscore for CLS is visible in a DebugBear page speed test result for example:
What causes unexpected layout shift?
Layout shift happens when some page content renders later than other content. This can happen either during the initial page load, or later on as the visitor interacts with your website.
During the initial load, other resources gradually become available and change the appearance of the website. For example, that can be because a font loaded or because a JavaScript widget renders on the website.
Only unexpected layout shift increases your CLS score. Layout shift that follows within 500 milliseconds of a user interaction does not contribute.
Let's take a look at some common causes of poor CLS scores. You can also check out our detailed guide to fixing CLS issues on your website.
Missing image width and height attributes
You can prevent some layout shifts if you know the size of the element that's being loaded. In that case, you can provide an empty placeholder with the appropriate height, and then fill in the contents later.
Setting an explicit width and height for images ensures that the image renders at the appropriate size right away.
<img src="product.png" width="200" height="150" />
Alternatively, you can also use the CSS aspect-ratio property to set the aspect ratio of the image, which allows the browser to calculate the appropriate height based on the width.
<img src="product.png" width="200" style="aspect-ratio: 4 / 3" />
Missing single-page app container height
Single Page Applications often load content dynamically after initial render. This can cause layout shift when inserted elements have variable heights, leading to visual instability.
You can prevent this particular kind of layout shift by setting a min-height to a particular height on the application container, for example 900px, on the root element of your application to prevent CLS of this kind for viewports up to that size.
<div id="app" style="min-height: 900px" />
Consider showing a spinner or skeleton loader to show visitors that content is loading.
Web fonts
Web fonts may trigger layout shifts when the size of the loaded web font is different from that of the fallback font that's used for the initial render.
You can reduce these layout shifts by setting the font-display CSS property to either optional or fallback. Both will hide the text for up to 100ms, completely preventing layout shifts if the web font loads quickly. If the font loads slowly the browser will use a system font initially.
font-display: fallback switches to the web font if it loads within 3s. font-display: optional never shows the web font if it takes more than 100ms to load.
Simon Hearne has written an article all about preventing layout shifts caused by web fonts.
Ads and third-party embeds
Third-party content often loads after most of the page has already rendered. For example, a banner ad may be injected at the top of the page, causing the rest of the content to shift downwards.
The solution here is to make sure that your ad slots and other embeds have a predefined size, even when the code that's required to fill them hasn't loaded yet.
<div id="banner-ad" style="min-height: 200px; min-width: 800px;" />
Google has a more detailed guide on how to minimize layout shift for Google Publisher Tags specifically.
Lazy loaded content
Content that loads as the user scrolls down the page can cause layout shift when it appears. To avoid that:
- Make sure the lazy loaded content container has a predefined size
- If you use a lazy loading library, make sure it starts loading content slightly before it enters the viewport
Slow UI updates after user interactions
The page layout is expected to change after a user interaction, for example when the user opens a different tab on your website. That's why layout shifts that happen within 500 milliseconds of a user interaction don't count towards your CLS score.
However, if your website doesn't update quickly after the interaction, then any layout shift that follows does increase your website CLS. That means you should ensure that:
- Running the code handling the interaction is fast
- Network requests required to render new content finish quickly


Monitor Page Speed & Core Web Vitals
DebugBear monitoring includes:
- In-depth Page Speed Reports
- Automated Recommendations
- Real User Analytics Data
Why is Cumulative Layout Shift different in field and lab data?
Lab data is in an isolated test environment while field data is collected from real users.
Lighthouse lab data only tests layout shifts during the initial page load, while field data also counts layout shifts that users experience when scrolling down the page or interacting with menus or other UI components. This can lead to discrepancies and sometimes make Cumulative Layout Shift difficult to debug.
Our article on CLS score differences between lab and field data explains common causes of discrepancies and what you can do to identify and replicate CLS issues.
Setting up real user monitoring gives you detailed insight on what's causing layout shift for your visitors, including when scrolling or navigating through different sections of the page.
For example, you can see:
- How users interacted with the page before the layout shift
- What scroll position the layout shift occurred at
- How the largest layout shift element differs between users
- Whether specific device sizes have worse layout shift scores
How to measure Cumulative Layout Shift
There are several tools which can help measure and diagnose Cumulative Layout Shift issues:
- Chrome DevTools has a layout shift highlight feature
- Lighthouse performance tests measure CLS
- DebugBear contains Cumulative Layout Shift measurements in the Overview tab
- The Layout Instability API programmatically detects layout shift with JavaScript
Continue reading to learn how to run a CLS test on your website.
Layout Shifts in Chrome DevTools
Chrome DevTools can highlight layout shifts as part of its Animation tooling. First, click the three dots in the top right corner, then select More tools, and finally click Animations.
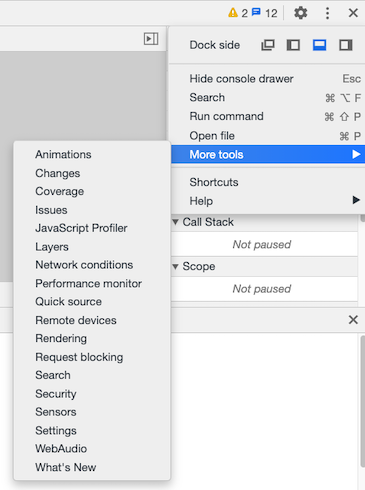
You can then enable highlighting for Layout Shift Regions.
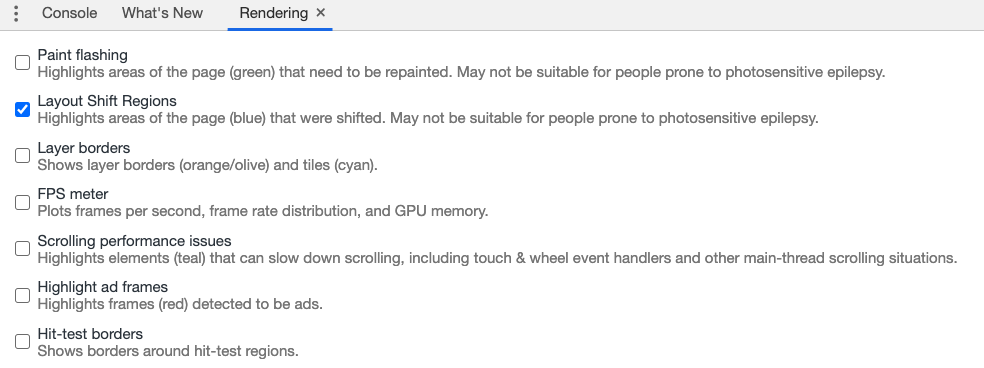
Now, when content moves on the page, Chrome will show a blue highlight rectangle for the affected DOM nodes.

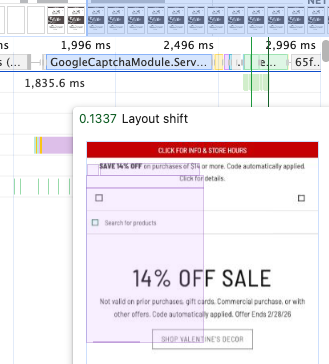
DevTools recently added a new Cumulative Layout Shift culprits insight to the Performance tab.
The DevTools performance trace can also help you identify layout shifts and what might have caused them.
Cumulative Layout Shift in Lighthouse
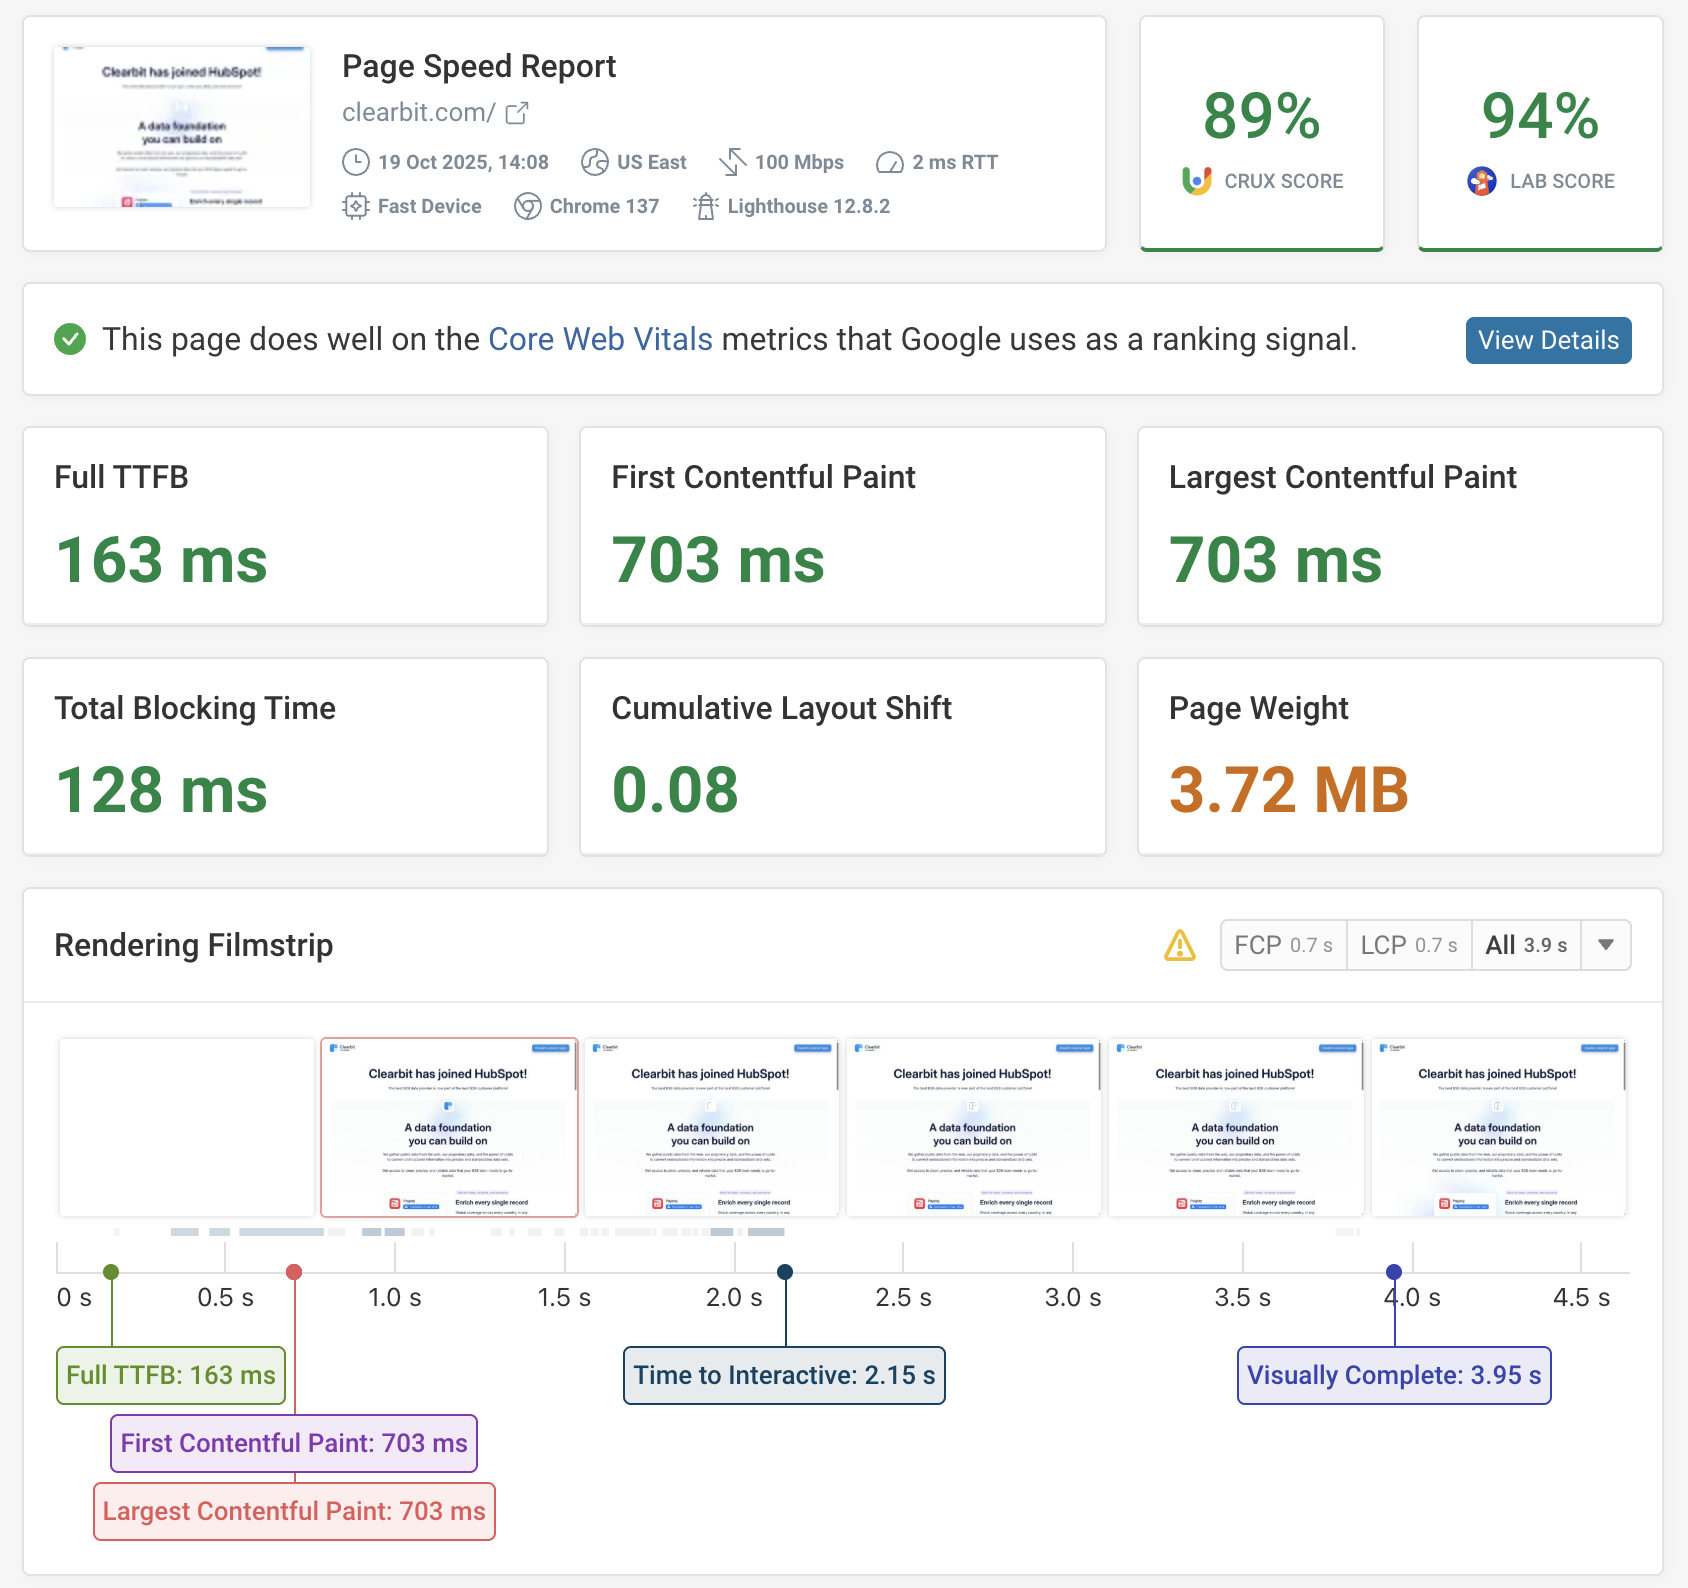
You can find the CLS metric as one of the 5 key metrics at the top of each Lighthouse report. PageSpeed Insights is built on top of Lighthouse, so you'll find this data in the report there too.
The filmstrip below can help identify what's causing the layout shift.
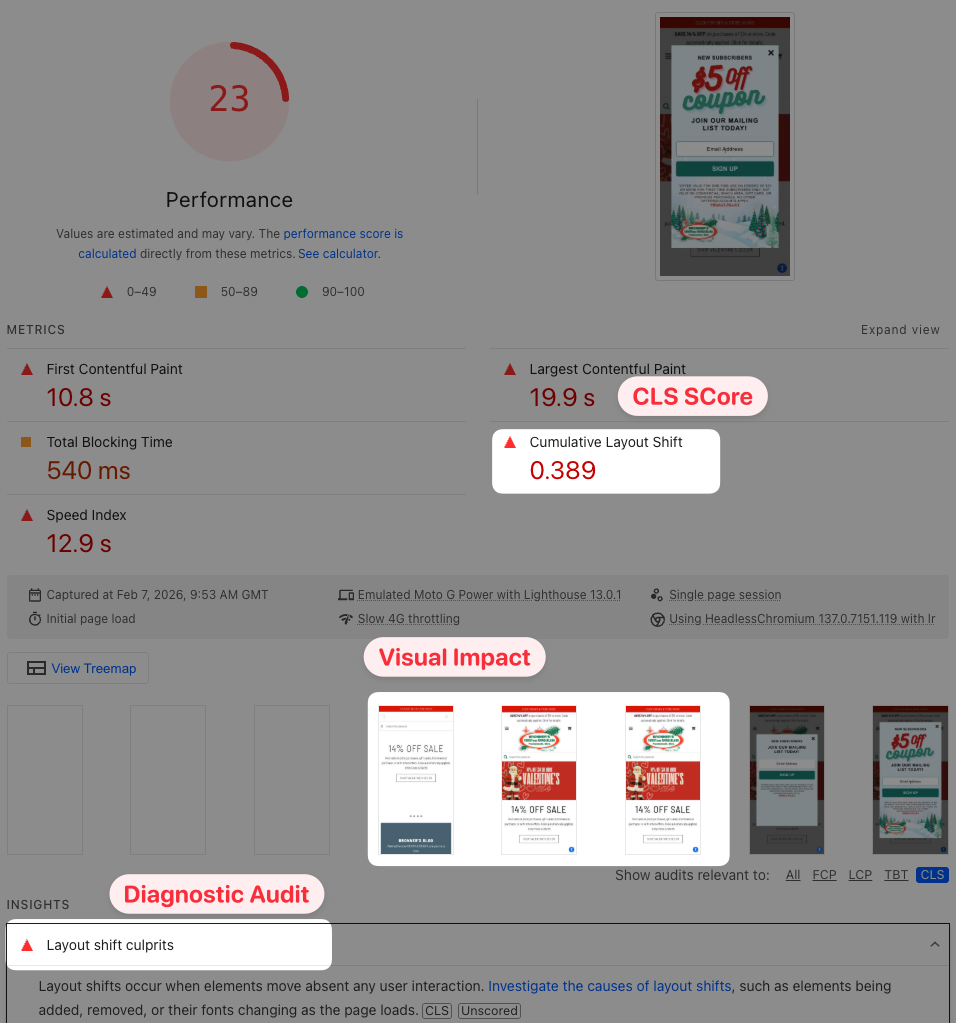
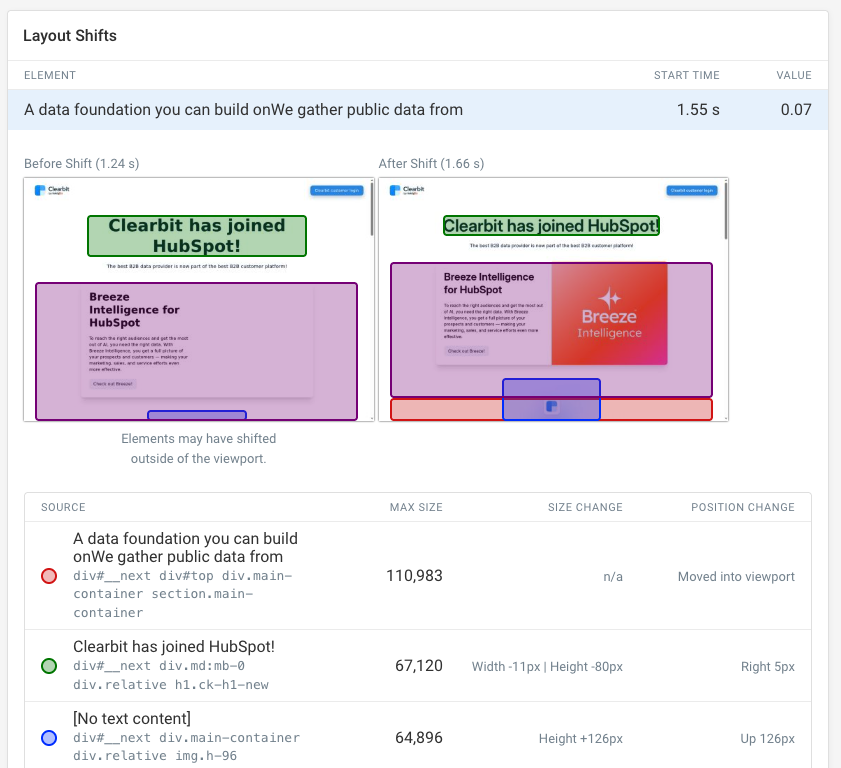
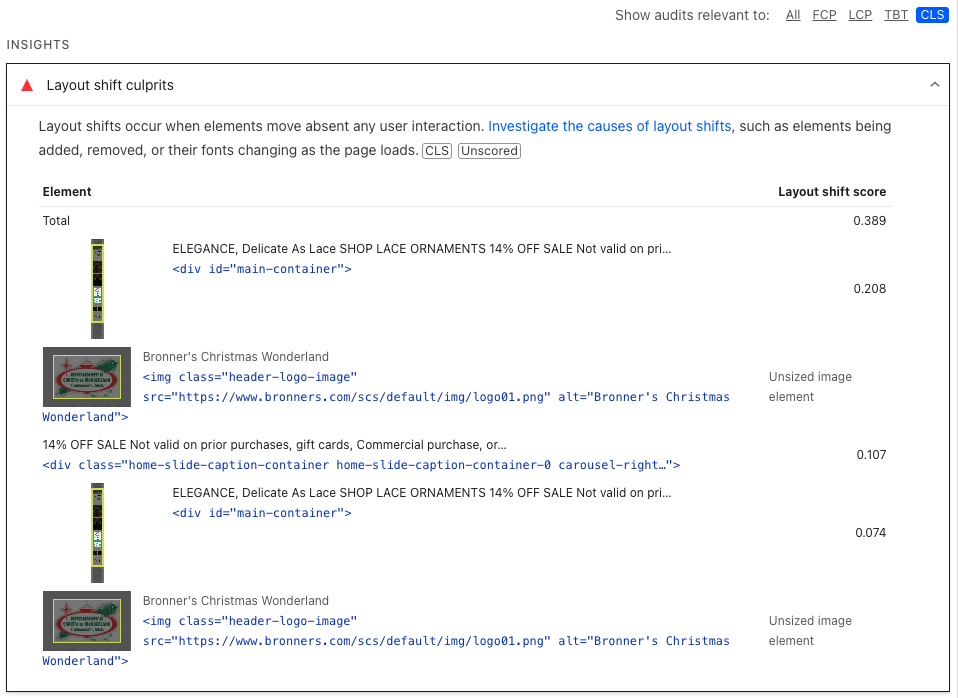
The Layout Shift Culprits diagnostic shows you specific elements that have shifted on the page and how much they contributed to the overall CLS score.
In some cases, Lighthouse also suggests potential root causes here, like an unsized image element or a web font causing a change in text size.
Use the DebugBear CLS Checker
Running a website speed test with DebugBear gives you access to a CLS analysis.
You can find the Cumulative Layout Shift metric in the page Overview tab of the DebugBear application, just above the filmstrip.
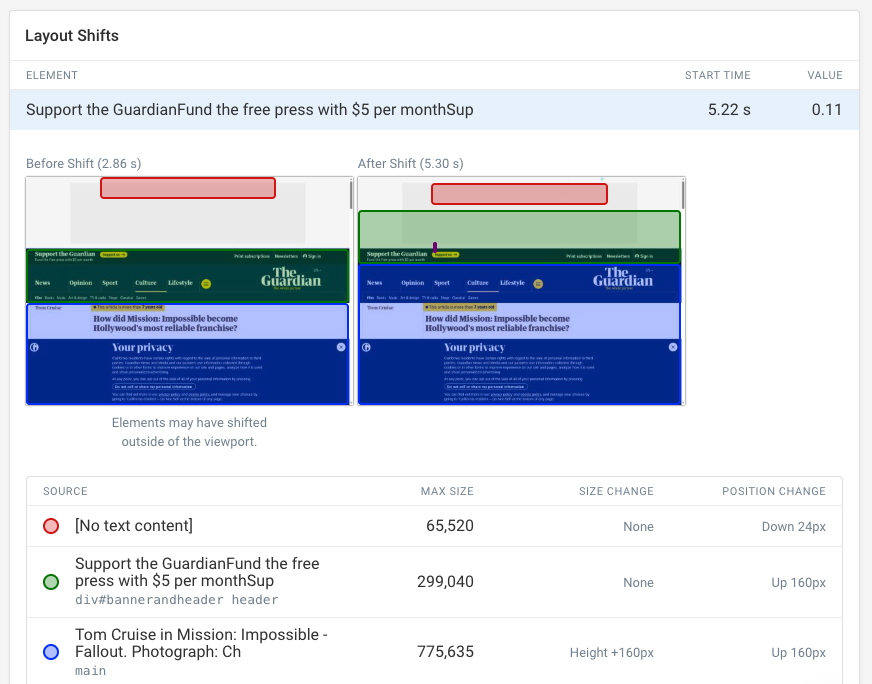
The Web Vitals tab includes a CLS debugger that shows all layout shifts on the page and provides in-depth diagnostics to help you check and improve your Cumulative Layout Shift score.
The listing also shows each individual source element and how far it moved around on the page.
Layout Instability API
The Layout Instability API detects layout shifts and calculates CLS in real-time within your web application.
Here's how to use a PerformanceObserver to retrieve and monitor layout-shift entries:
var cumulativeLayoutShift = 0;

const observer = new PerformanceObserver((list) => {
  list.getEntries().forEach((entry) => {
    // Don't count if the layout shift is a result of user interaction
    if (!entry.hadRecentInput) {
      cumulativeLayoutShift += entry.value;
    }
    console.log({ entry, cumulativeLayoutShift });
  });
});

// `buffered: true` to report layout shifts that have already happened on the page
observer.observe({ type: "layout-shift", buffered: true });
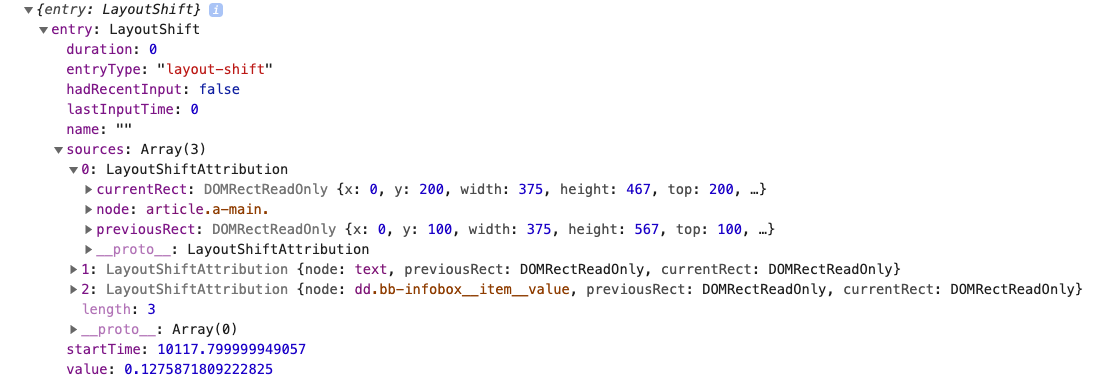
A layout-shift entry looks like this – each event is attributed to a set of DOM nodes.
You can also use the web-vitals.js library to measure real-user CLS and other Core Web Vitals on your website.
Monitoring Cumulative Layout Shift over time
You can use DebugBear to measure Cumulative Layout Shift over time and optimize your CLS scores.
The Web Vitals tab shows both real-user data and the result of the lab-based performance test. The real user data comes from the Chrome User Experience Report (CrUX), which Google uses as a ranking signal.
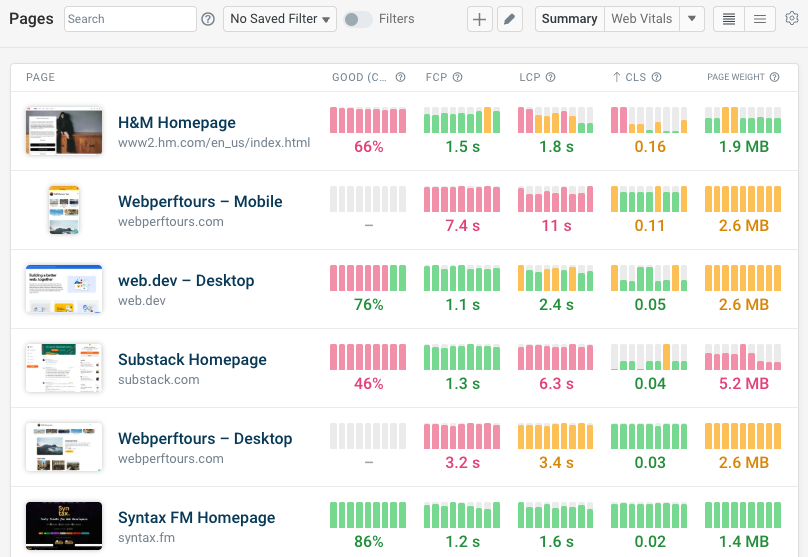
You can also get a high-level view of page speed and Core Web Vitals on your website and those of your competitors.
This also makes it easy to identify pages with poor CLS on your website.
Track real-user CLS scores
Real user monitoring data can give you a more nuanced view of what the distribution of experiences looks like for all visitors on your website.
The Cumulative Layout Shift metric dashboard lets you see how CLS scores vary between different visitors, highlights CLS scores on your most-visited pages, and identifies pages with poor visual stability.
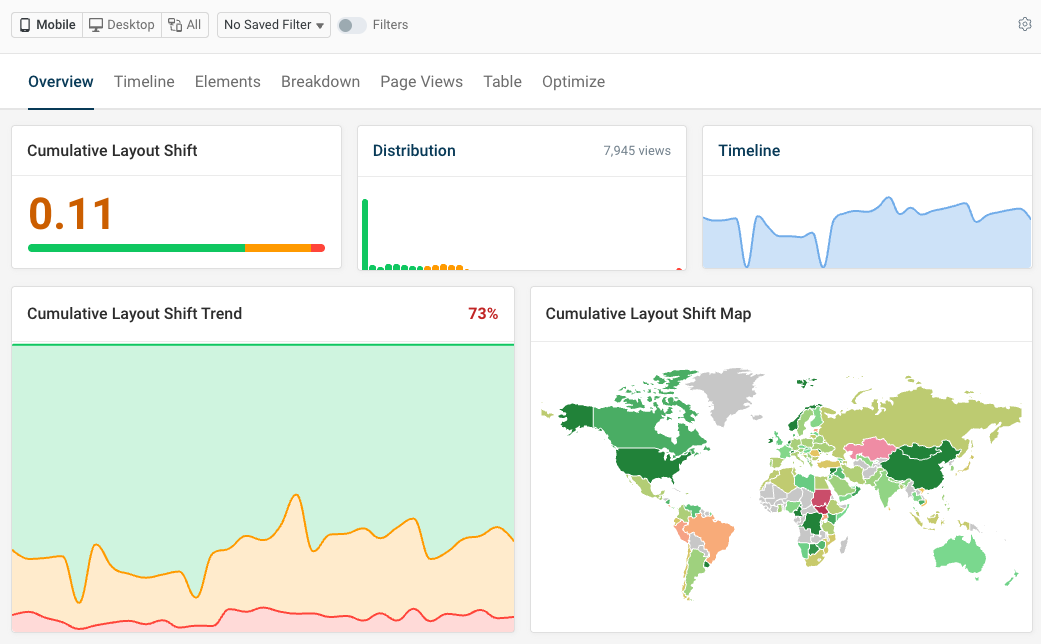
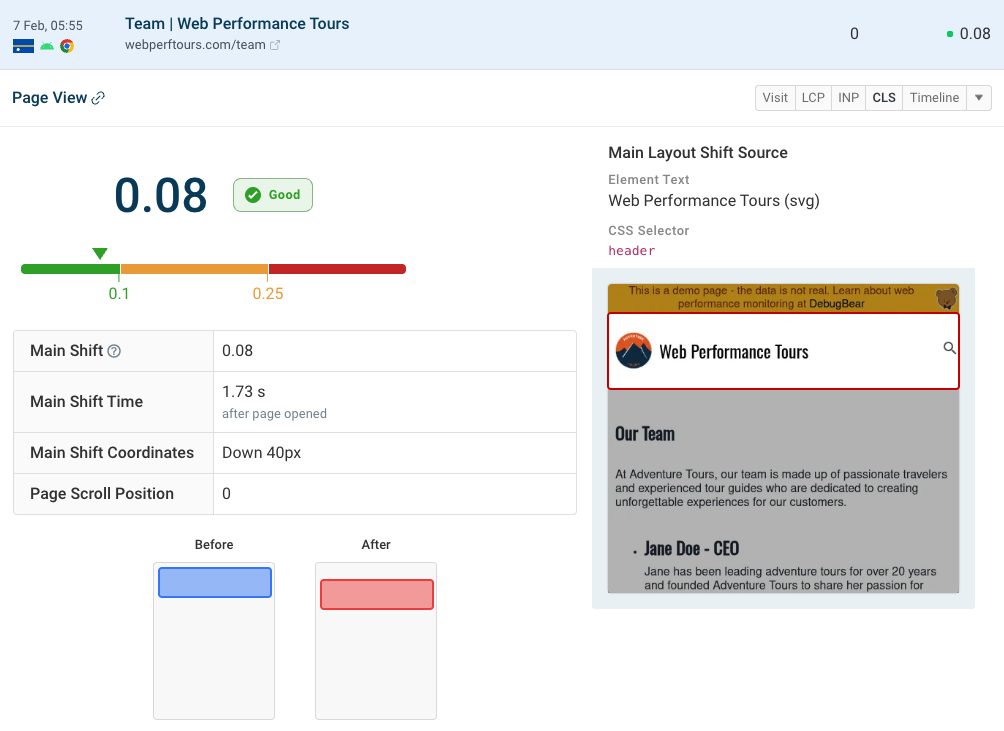
You can also review a specific visitor experience, checking things like the main CLS element, device size, and user interactions that led up to the layout shift.
DebugBear provides comprehensive web performance and Core Web Vitals insights. Sign up for a free trial.
Monitor Page Speed & Core Web Vitals
DebugBear monitoring includes:
- In-depth Page Speed Reports
- Automated Recommendations
- Real User Analytics Data