Test the performance of warm loads, view request headers and response bodies, and collapse the sidebar to focus on metric data.
Testing warm load performance
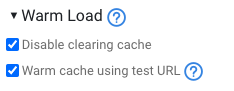
By default, DebugBear tests how fast a website loads the first time someone visits it. But for regular users performance will be better, as some page resources can be loaded from the browser cache.
You can now track the performance of these warm loads. Just check Disable clearing cache in the advanced page settings.
Better request diffs
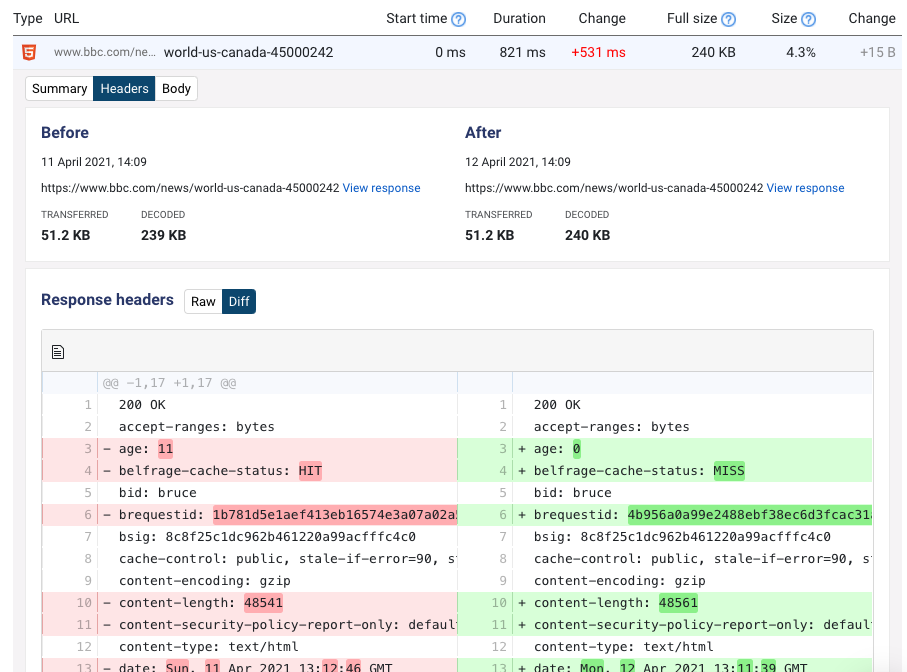
DebugBear now shows request headers and response bodies directly in the requests table.
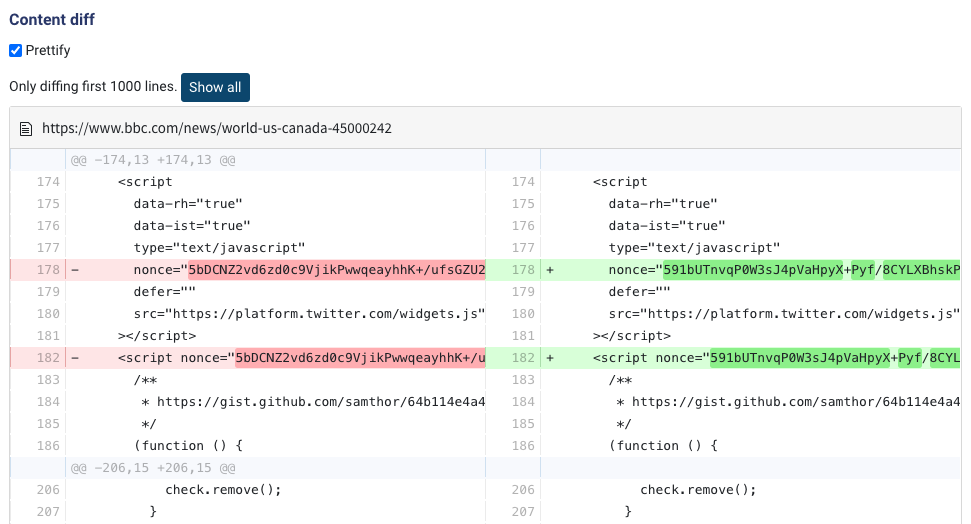
You can also prettify JavaScript, JSON, CSS, and HTML responses to see exactly what changed.
Collapsible sidebar
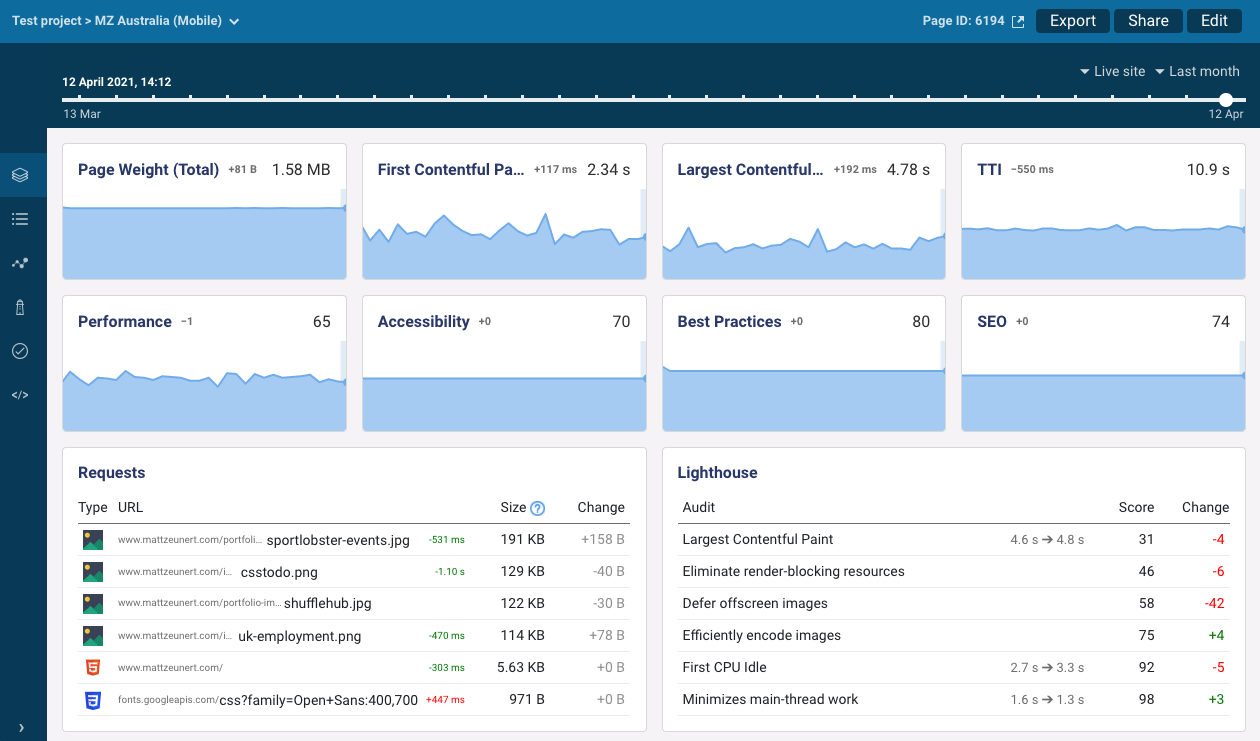
Collapse the sidebar to leave more space for charts and performance analysis. This also hides the chat widget, so it doesn't overlap content you want to see.
New blog posts
Web Vitals FAQ – learn what Google has to say about the metrics that will impact search rankings from May 2021.
Common problems with rel="preload" – preload link tags can tell the browser what files it should prioritize, but sometimes they make the browser prioritize the wrong things, slowing down page performance
New performance docs
Time to Interactive – when do CPU and network become idle?
First Input Delay – how quickly does your page start processing user input?