We've improved our real user monitoring dashboards, improved the request waterfalls in our lab tests, and published loads of new content.
Better early hints and connection data in the request waterfall
Our request waterfall now highlights requests that were triggered via 103 Early Hints.
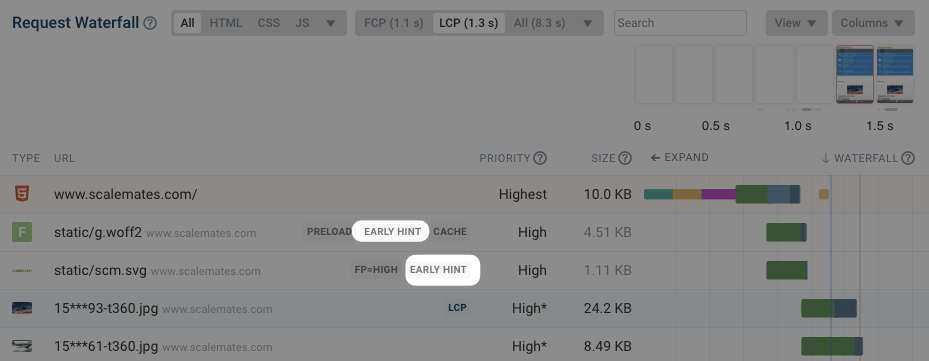
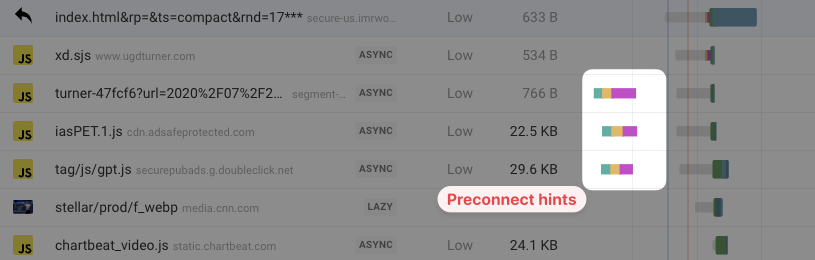
If a page uses preconnect hints, where the server connection is created separate from the resource request, we now show when the connection is created.
Updated real user monitoring dashboards
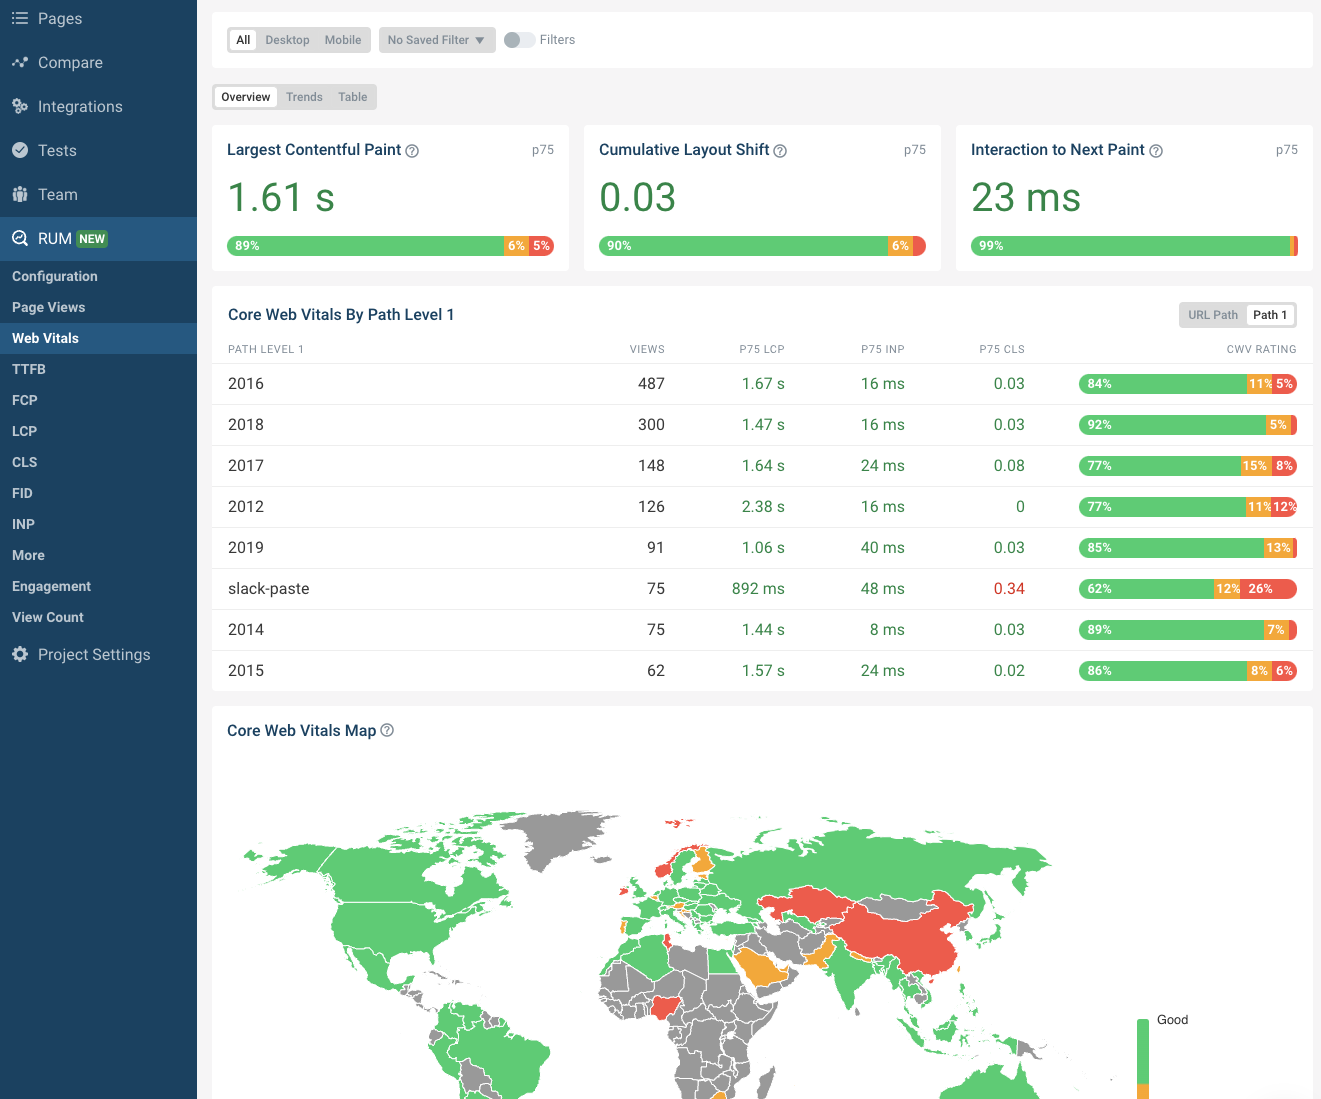
Our updated RUM dashboards now show more clearly how well you website is doing on the Core Web Vitals.
RUM breakdown by technology
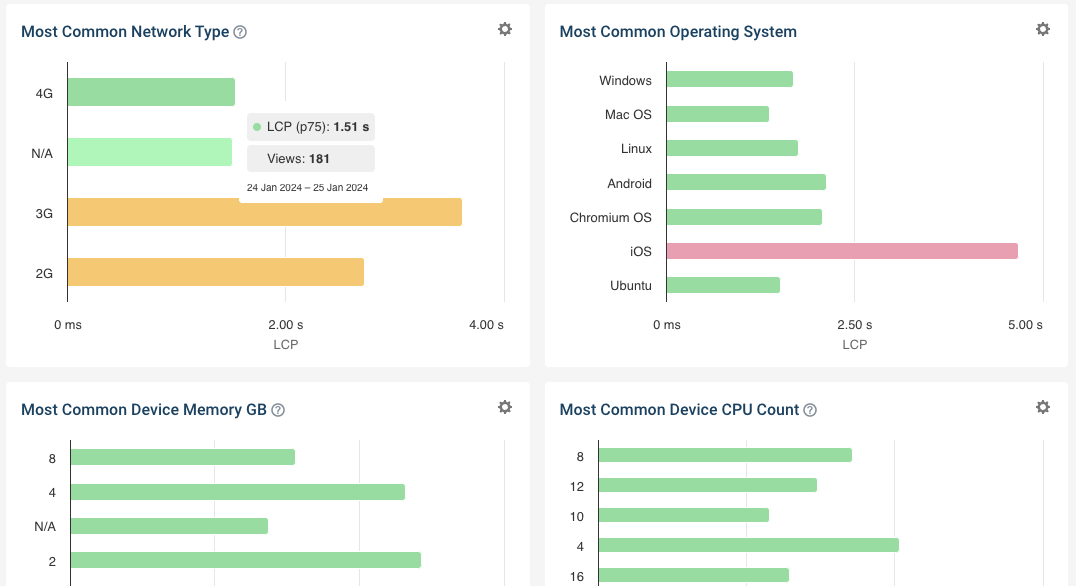
The "Tech" tab for the differnt page speed metrics lets you see how user experiences differ by the software, hardware, and network connection they use.
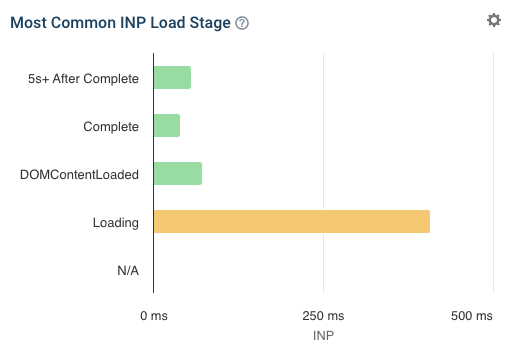
RUM INP load stage breakdown
The initial page load process often involves loading multiple scripts and rendering different page components. The INP stage breakdown lets you see whether INP is higher during the early stages of the page load process.
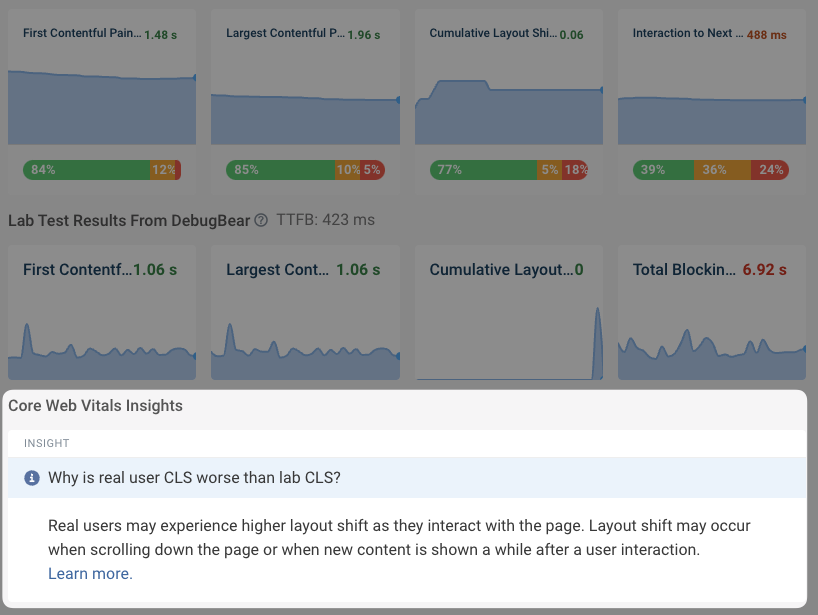
Core Web Vitals insights
You may often see Core Web Vitals differences between real user data and lab test results. The Core Web Vitals insights section identifies these differences and provides possible explanations.
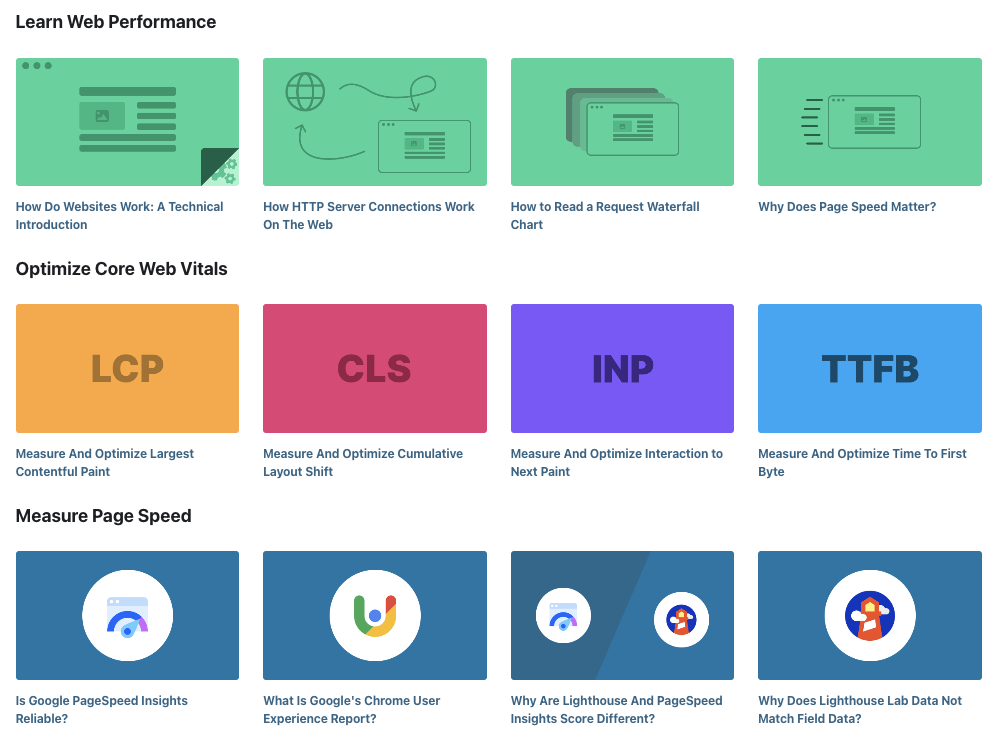
New articles
We've published a lot of new articles over the last two months, but here are some highlights:
- 2023 In Review: What’s New In Web Performance?
- How To Improve INP With Chrome DevTools
- A Guide To Soft Navigations And Core Web Vitals Reporting
- Measure LCP Sub-Parts To Improve Largest Contentful Paint
- How To Fix A Failed Core Web Vitals Assessment
- How To Improve Page Speed With 103 Early Hints
And check out our beautiful new blog homepage!
Watch a video about the Largest Contentful Paint
Watch our video on the LCP metric to learn how to improve your page load time.
Or check out this video if you're looking for an introduction to page speed and where it's going.