
A lot has been going on in the web performance space, especially since the introduction of Google's Core Web Vitals.
This article looks at changes to how we measure page speed and how new web platform features can help you keep your website fast.
You can share this article on Twitter or LinkedIn.
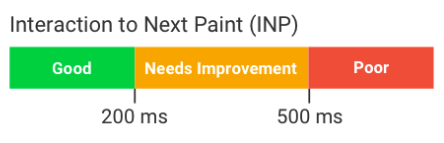
Interaction to Next Paint is replacing First Input Delay
2024 Update: Interaction to Next Paint (INP) has now replaced First Input Delay (FID) as a Core Web Vital.
In 2022 Google introduced the new experimental Interaction to Next Paint (INP) metric to measure how quickly websites respond to user interactions.
In May 2023, Google announced that INP will replace the older First Input Delay metric as a Core Web Vitals metric in 2023. The Core Web Vitals are a set of user experience metrics Google uses as an SEO ranking signal.
Interaction to Next Paint improves on First Input Delay in two ways:
- INP looks at all on-page interactions instead of just the first one
- INP measures the whole interaction duration instead of just the processing delay
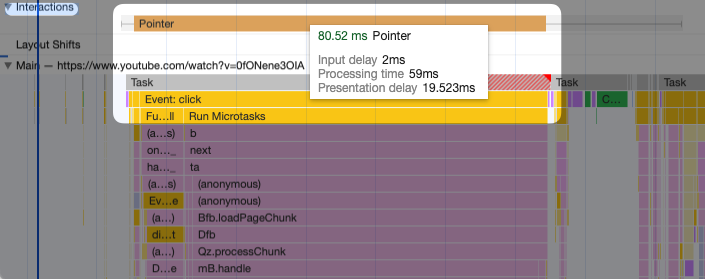
Chrome DevTools has also introduced some helpful changes to better debug slow interactions by adding more information on the INP breakdown:
Better cross-browser support for page speed features
New web platform features to help optimize and measure page speed are usually first implemented in Chrome. Often it takes a long time for new features to become widely available.
However, a few notable features were introduced in non-Chrome browsers in 2023:
- The Largest Contentful Paint metric can now be measured in Firefox
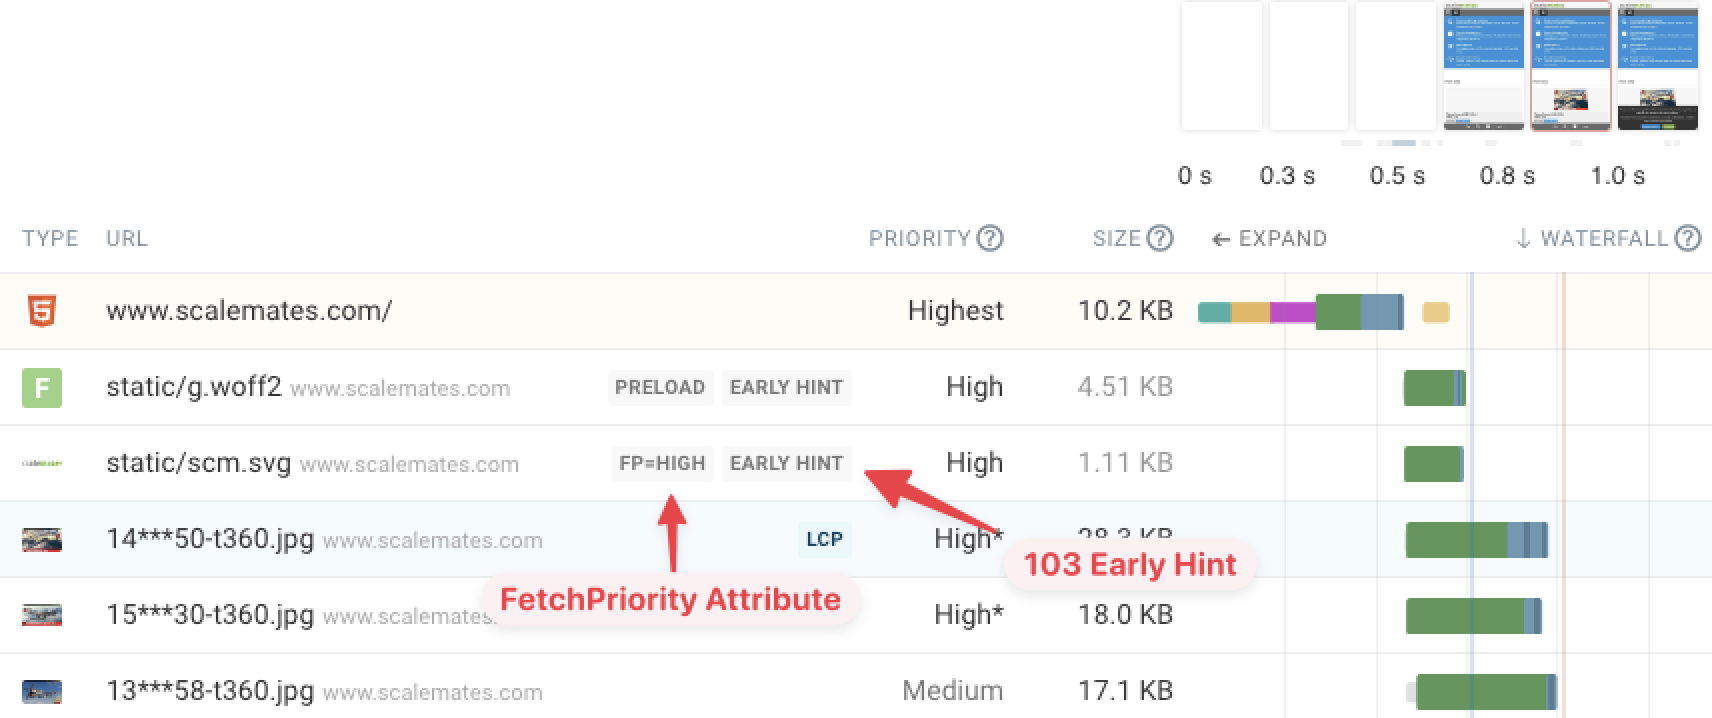
- Safari now supports 103 Early Hints which let developers tell the browser to load necessary resources before sending the HTML response
- Safari has added support for the
fetchpriorityattribute which lets developers mark high-priority images in the HTML
Real user page speed monitoring with DebugBear
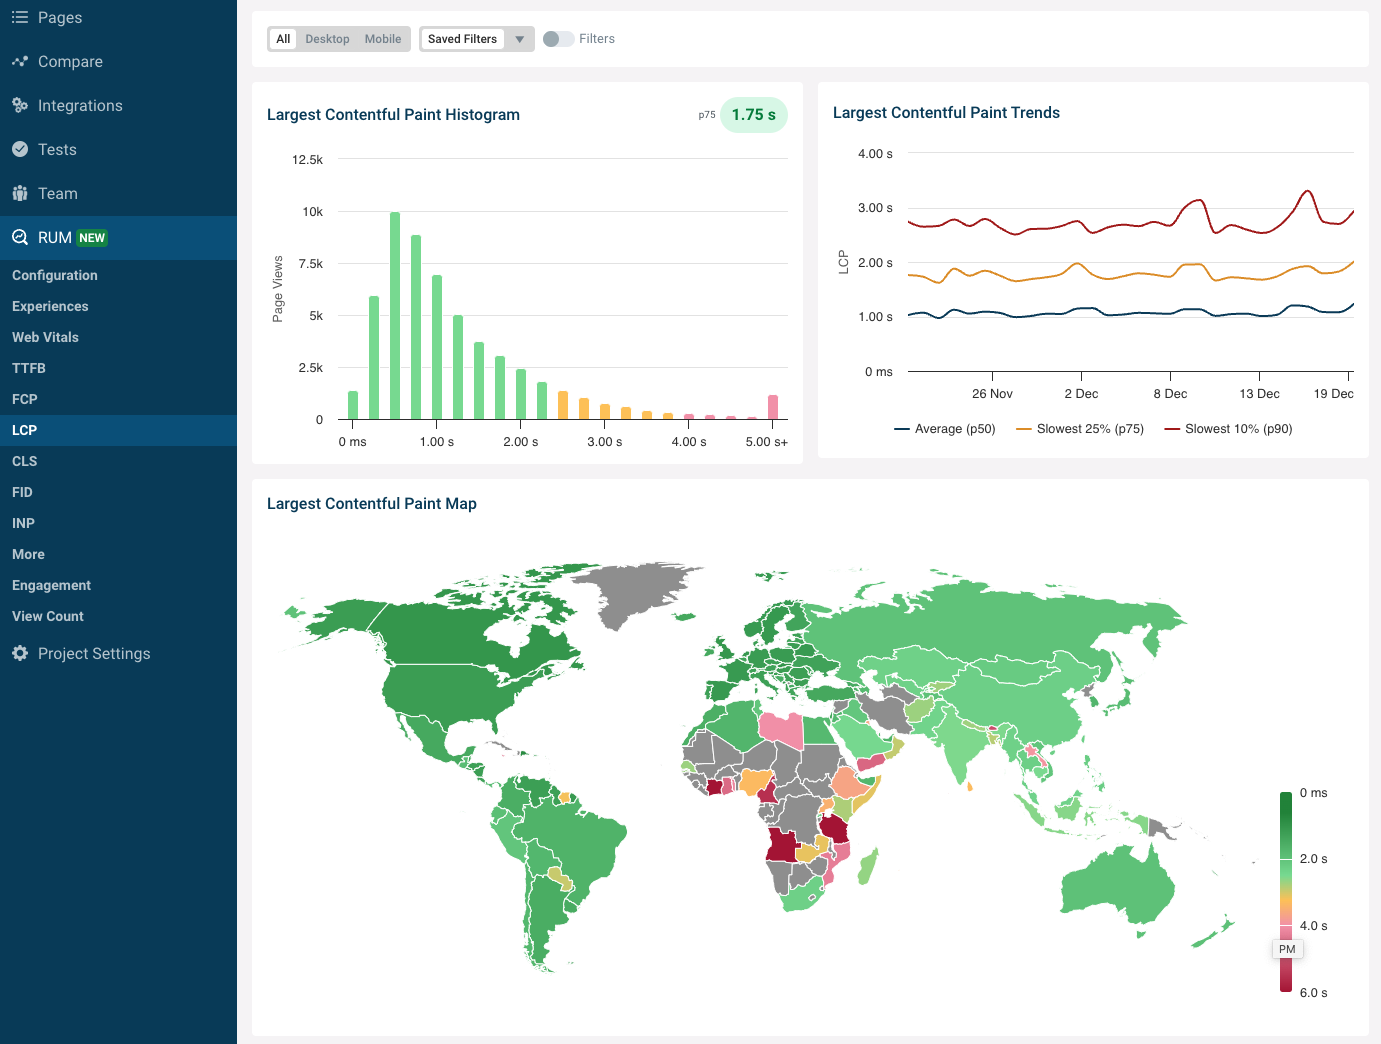
At DebugBear we've released our new real user monitoring (RUM) feature to help you measure Core Web Vitals for visitors on your website.
RUM makes it easy to:
- Compare page speed across pages and visitor locations
- Identify slow pages across your whole site
- See how often different page components act as the LCP element
- Break down your INP score by what UI element users interacted with
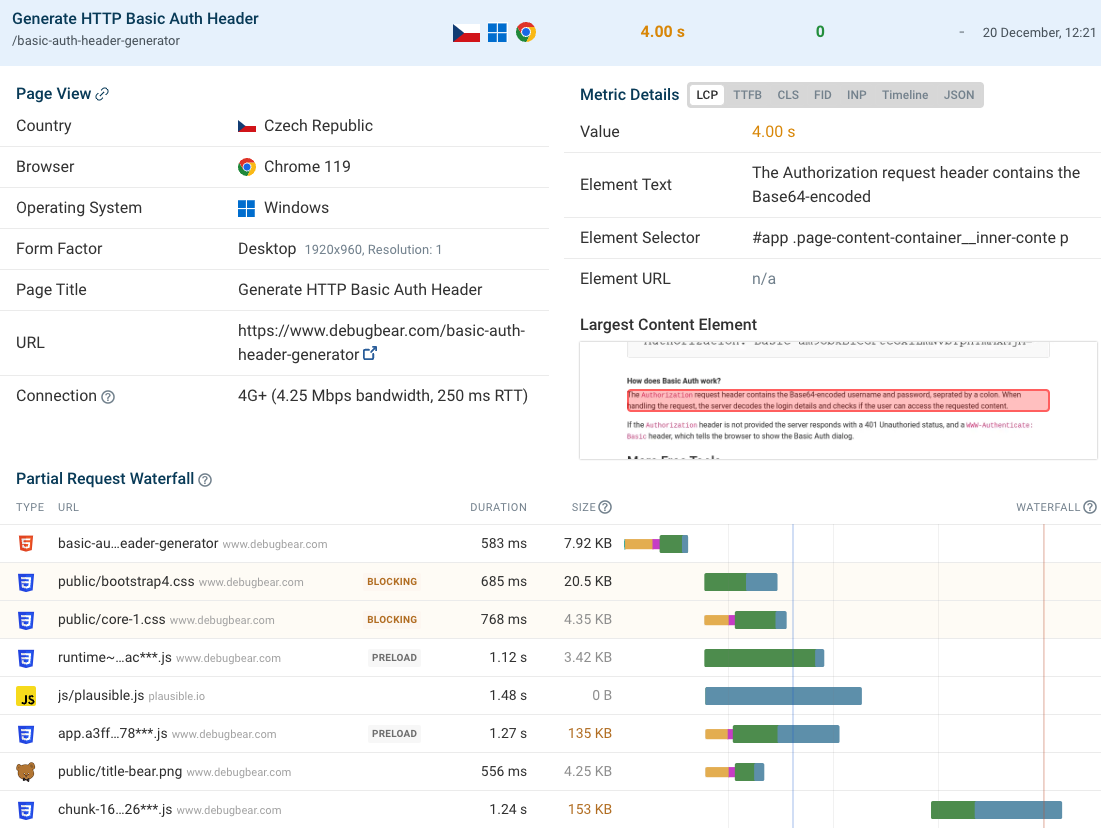
To make optimizing your website easier we also show in-depth reports for individual user experiences, including a partial request waterfall that can help you debug rendering speed.
Changes to image priorities in Chrome
When a website loads the HTML document is downloaded and then the browser looks at the HTML code and identifies other necessary resources like stylesheets, scripts, and images.
However, the page HTML may well contain over a hundred image references. Some may be important content, others maybe be positioned way down in the footer, and some may be behind an invisible menu. But the browser can't tell which images are important just by looking at the HTML.
Because of that the default priority for image requests is low. Then, when the page is rendered and the browser knows which images are in the viewport, then the priority of the visible images is increased.
The fetchpriority attribute exists to allow developers to tell the browser about important images directly in the HTML. But not every site will implement this.
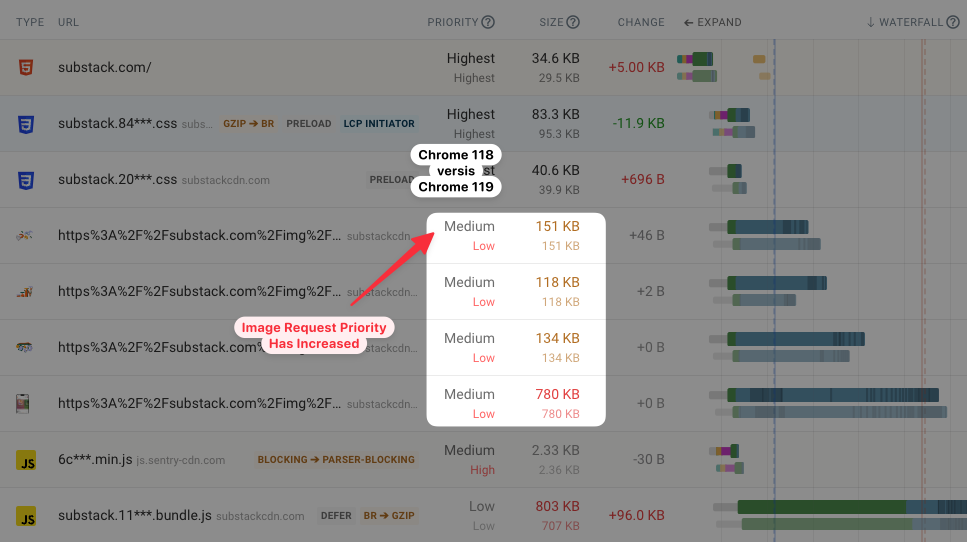
Therefore, Chrome changed how images are prioritized in October 2023. The priority of the first 5 images in the document is now "Medium" instead of "Low". This heuristic tries to identify important images early and helps reduce the Largest Contentful Paint metrics without website owners having to change anything.
You can see an example comparison of a test using Chrome 117 vs Chrome 118 here:
See Initial and later priorities in Chrome DevTools
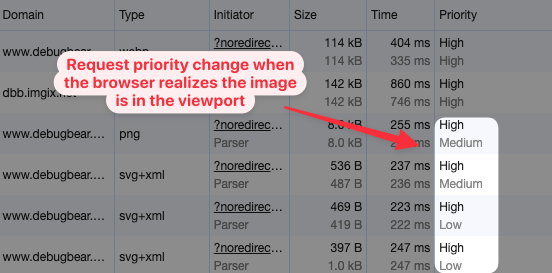
In the previous section I mentioned that the priority of an image request changes when the page renders and the browser realizes the image is in the viewport. You might not have known that before, because Chrome didn't have a way to show the initial priority in the past.
However, since September 2023 you can enable Large Request Rows and the bottom value in the Priority column will show the initial request priority.
Video frames in Chrome now count as content for the LCP metric
To measure the Largest Contentful Paint metric browsers need to decide what counts as content and then detect when that content appears. Usually content means text or images.
However, videos are a special case. Before Chrome 116 videos only impacted LCP if a poster image was provided.
Since August 2023 Chrome instead looks at the time when the first frame of a video appears. This also applies to animated GIFs and PNGs, which previously counted as contentful but where the LCP milestone was only registered when the image had been fully downloaded.
Google released the CrUX history API
First of all, what is the Chrome User Experience Report (CrUX)? It contains Core Web Vitals data from real Chrome users that Google has collected. This is the web vitals data that impacts search rankings.
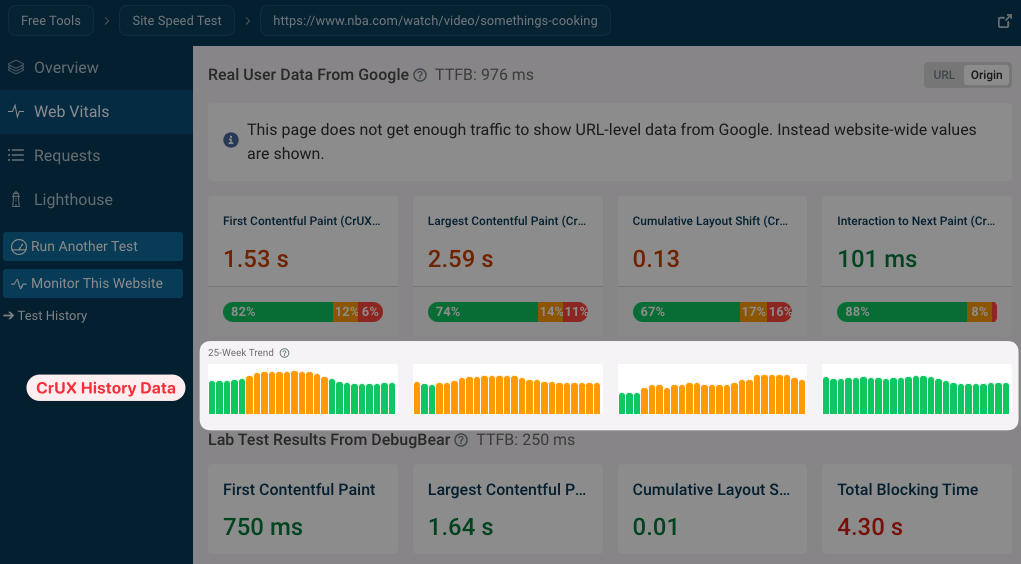
Tools like PageSpeed Insights will show an average of your real user Core Web Vitals over the last 28 days. But unless you have continuous website monitoring in place you can't tell you whether your website has been getting better or worse.
Luckily Google has released the CrUX History API, giving you data for your website covering the last 40 weeks.
Run a Core Web Vitals test to see how your website is performing.
Check out some of our best articles from 2023
Every month we're publishing new articles for our blog. Subscribe to our newsletter to stay up to date.
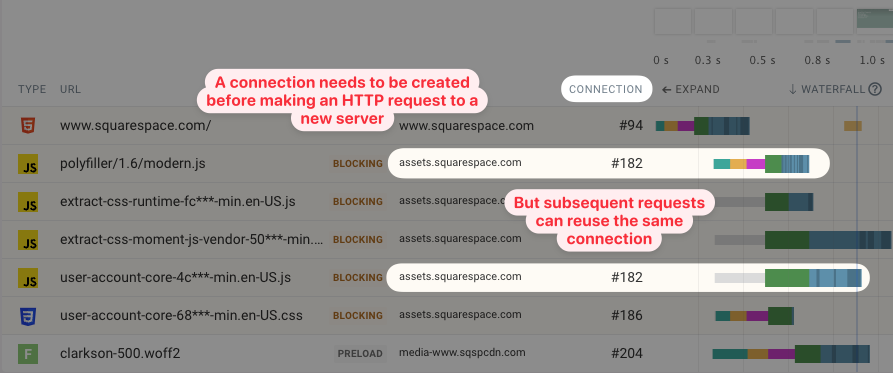
How HTTP server connections impact page speed
When talking about web performance we often talk about bandwidth and resource download sizes. But to load resources we first need to connect to a server, and here network latency plays a big role on how long that takes.
Learn more about HTTP server connections as well as the different components that trigger a round trip on the network.
https://www.debugbear.com/blog/website-carbon-emissions
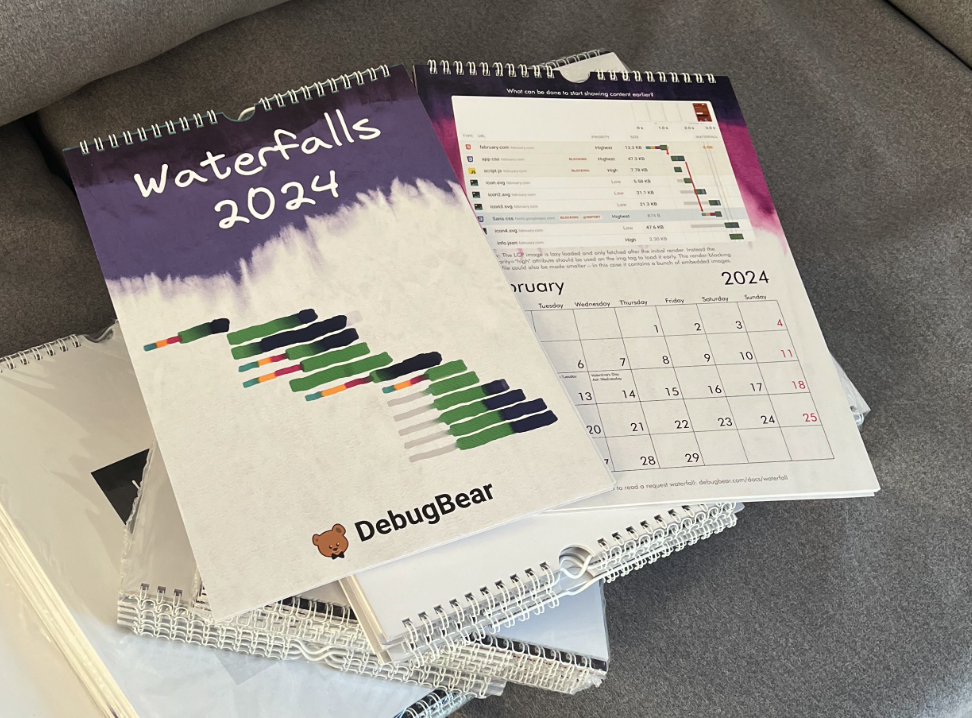
A wall calendar with network request waterfalls
Request waterfalls are an essential tool in page speed analysis. This year we made a wall calendar showcasing a different web performance problem each month.
We don't have many physical copies left, but you can check out the waterfalls and explanations here.
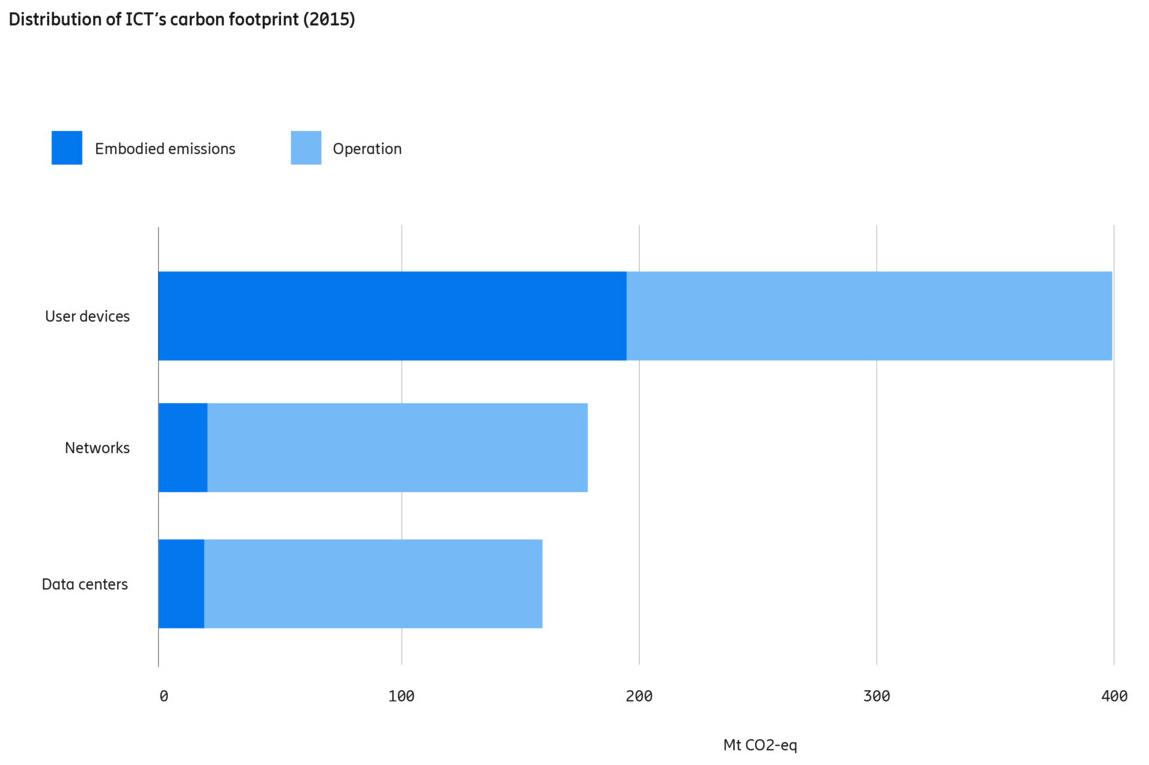
Website carbon emissions
How big are the CO2 emissions of the internet? Are website carbon calculators reliable? Our blog posts takes a look and explains why DebugBear doesn't report carbon emissions.
Page prerendering
We touched on this in last year's blog post but there are still new changes being rolled out here.
As a website operator you often know what other pages your users will want to visit next. Similarly, the browser can detect when the user is about to visit a website. Prerendering means loading the resources for the next page before that navigation happens.
Prerender APIs have been around for a while but had poor browser support and performance issues, which led to them being deprecated.
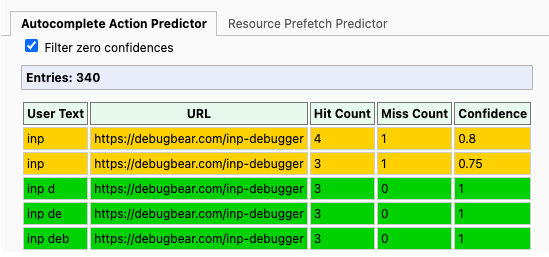
The Speculation Rules API lets website owners tell the browser about a likely future navigation. When that navigation happens the transition is instant.
Chrome also keeps track of how a user navigates to a website and either preloads the entire website or prepares for the navigation by establishing server connections that will be needed on the next page. For example, if I type in "inp d" it's likely that I'm about to open the INP Debugger (screenshot from the chrome://predictors/ page).
A look ahead to 2024
What are some upcoming changes or experimental APIs that might become more important in 2024?
INP as a Core Web Vitals metric + the Long Animation Frames API
The introduction of Interaction to Next Paint as a Core Web Vitals metric will be a big topic in 2024, as currently only 65% of mobile website provide a good experience.
As part of the effort to make websites more responsive Google has been working on the new Long Animation Frames API (LoAF). This API can measure frozen UIs, whether that's because of JavaScript that's running during the initial load of the page or in response to a user interaction. Crucially, the LoAF API can attribute tasks to specific URLs and provide context on the kind of work being done. This helps developers understand what's slowing down interactions for real users.
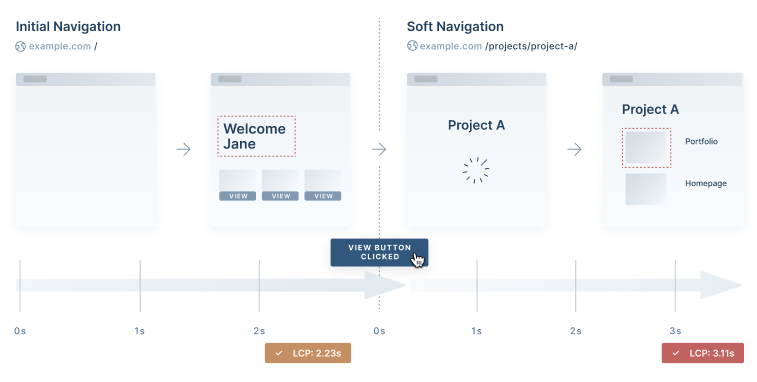
Soft Navigations
Another area of API experimentation are soft navigations: URL changes inside a single-page app that don't require a full page reload. These transitions are important to visitors, but right now metrics like the Largest Contentful Paint only look at the initial render. These API changes would help better detect and measure navigations within the same page context.
Compression Dictionaries
Compression using algorithms like Brotli or GZIP work by creating dictionaries with phrases that can be referenced instead of sending the same content in the same file several times.
Normally these dictionaries are only used once to transfer a file. If the file changes all of it needs to be loaded again. Often web development code like JavaScript or CSS only changes by a small amount with each new deployment, so there's room for optimization here.
The Compression Dictionaries feature aims to reuse these dictionaries for future file downloads. When a similar file is then loaded later on the actual amount of data transferred will be much lower.
You can try it out for your own files with the Shared Brotli Static Dictionary Tester. When we tried it for one of our application files the new version with a shared dictionary was 96% smaller than the full transfer with Brotli compression.
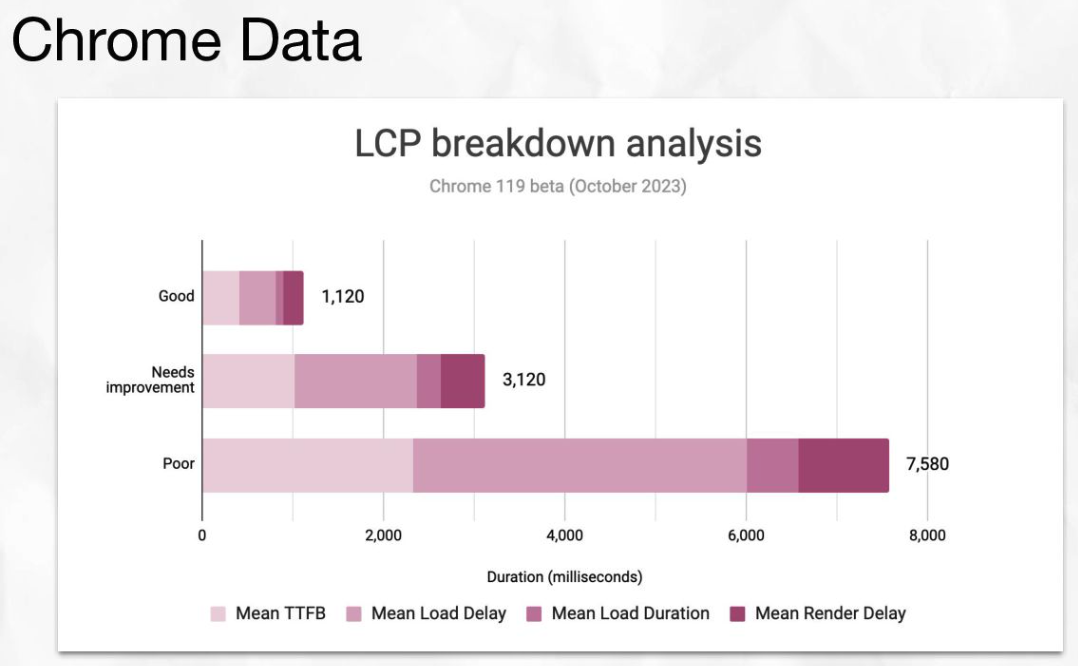
CrUX data on LCP sub-parts
LCP sub-parts break down the LCP metric into different components. If you know which component is slow this can point you into the right direction when optimizing your website.
This data is easy to gather in lab-based tools, but so far Google has not published the breakdown as part of the CrUX data. However, this might change next year, giving you more data to target your page speed improvements.
Conclusion
There continues to be a lot of work done in the web performance ecosystem. Google's Core Web Vitals drive a lot of interest as data is available for almost every website and is very visible in Google Search Console and PageSpeed Insights.
If you enjoyed this blog post you might also like this article by the Chrome team explaining the changes they've made in the browser following the introduction of the Core Web Vitals, as well as some of the changes made by other players in the web ecosystem.


Monitor Page Speed & Core Web Vitals
DebugBear monitoring includes:
- In-depth Page Speed Reports
- Automated Recommendations
- Real User Analytics Data