Better INP debug data, site-wide lab data averages, and real user Core Web Vitals alerts.
Interaction to Next Paint updates
Interaction to Next Paint (INP) became a Core Web Vitals metric in March! We've been updating our real user INP dashboard to better surface what you can do to optimize the metric.
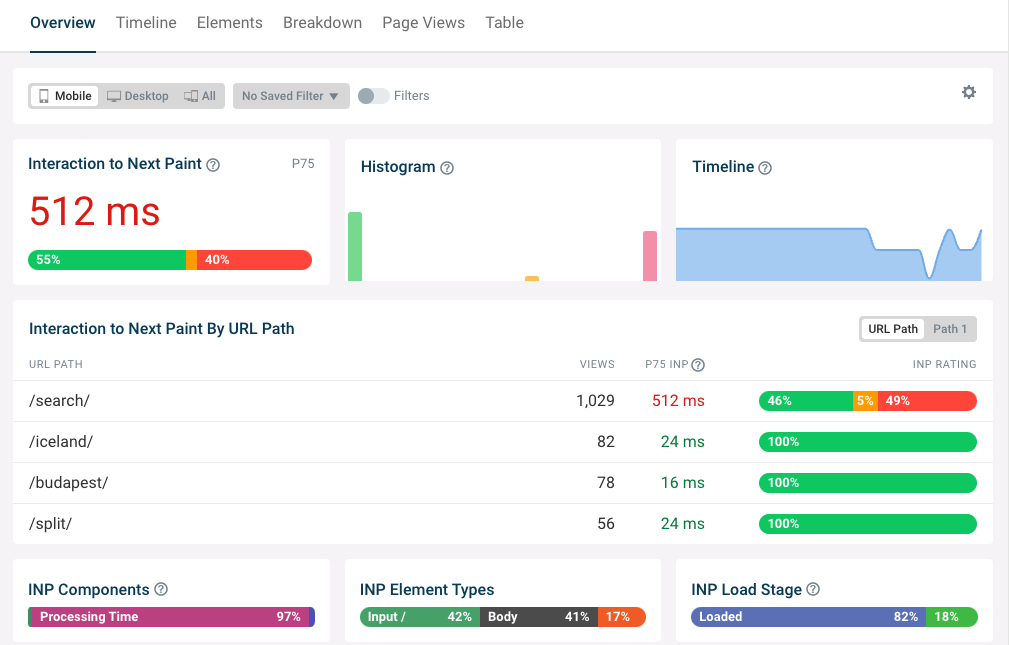
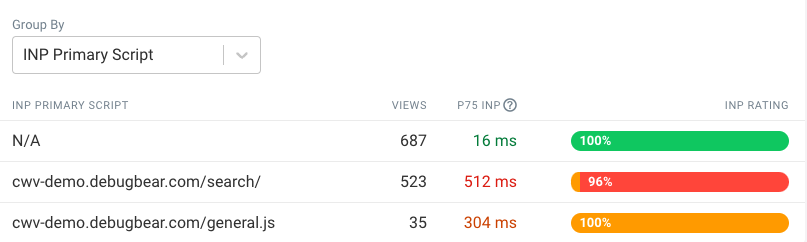
DebugBear also supports the Long Animation Frames (LoAF) API that's now available in Chrome. This data can tell you what script files are responsible for slow INP interactions.
Site-wide lab data averages
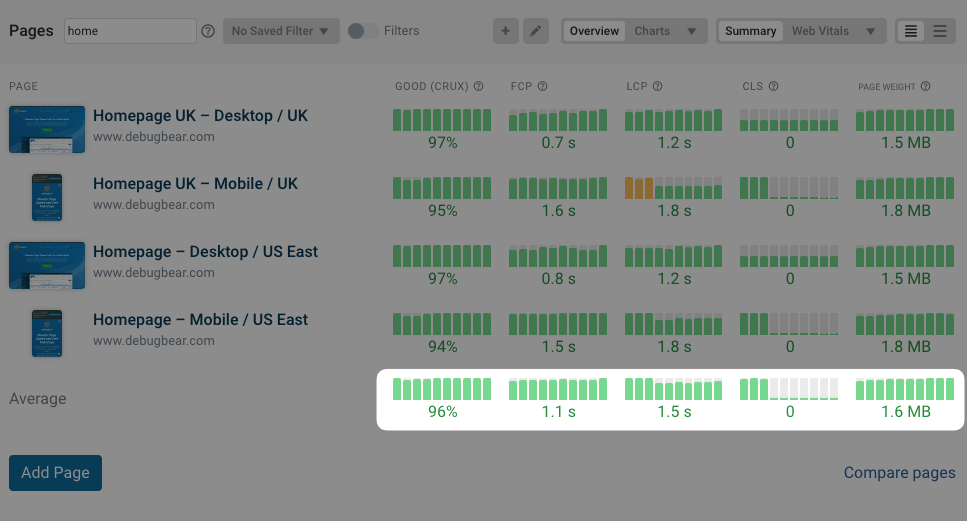
Wondering if your website as a whole is getting faster? Our lab test dashboards now include an extra row showing the average across all selected pages.
RUM TTFB Breakdown
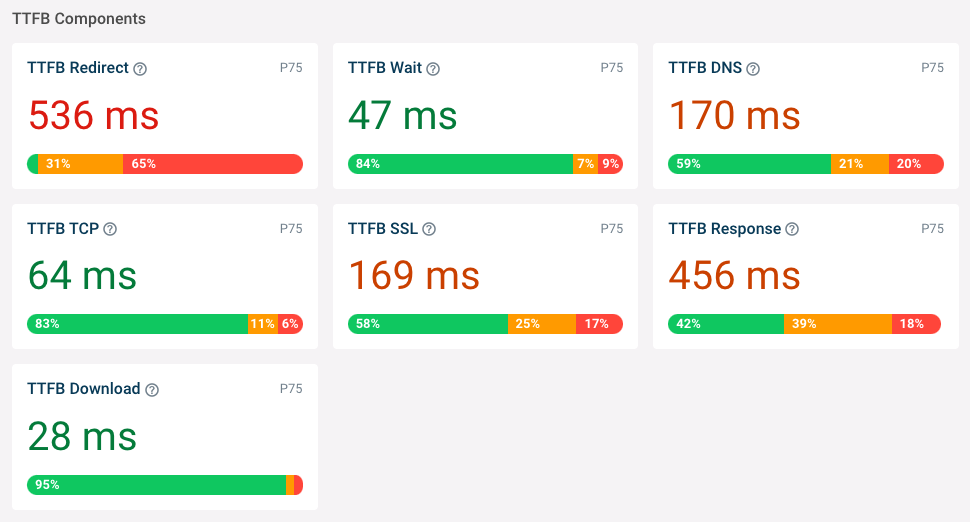
Trying to analyze TTFB and figure out what's delaying the initial document load? The More Metrics tab in our real user monitoring feature now reports the TTFB breakdown data.
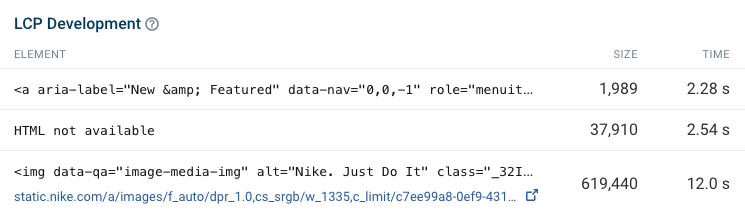
LCP Development
As your website loads new largest elements are rendered, each bumping up the LCP score when it appears. Sometimes it's tricky to understand why a new LCP value is recorded, for example when a video poster disappears and is replaced with the first video frame, or when a slider is slightly resized. We now list each of these event in the lab test results:
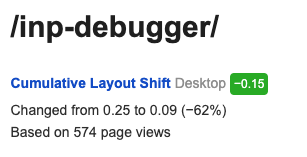
RUM alerting
DebugBear RUM now sends out alerts when there are Core Web Vitals changes on your website, whether that's improvements or regressions.
New articles
- How Fast Do Websites Load In 2024?: we take a look at the CrUX dataset to see how fast the web is today
- How Does The Loading Stage Of A Website Impact INP?: why do INP scores vary depending on when during the page load process the user interaction occurs?