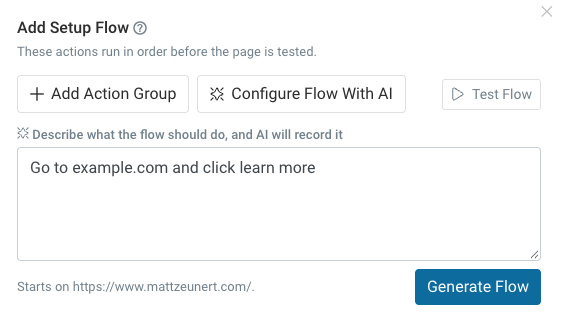
We now provide more in-depth debug data for CPU tasks and uptime checks. We've also improved our reporting UI and made it easier to set up user journeys as part of your synthetic tests.
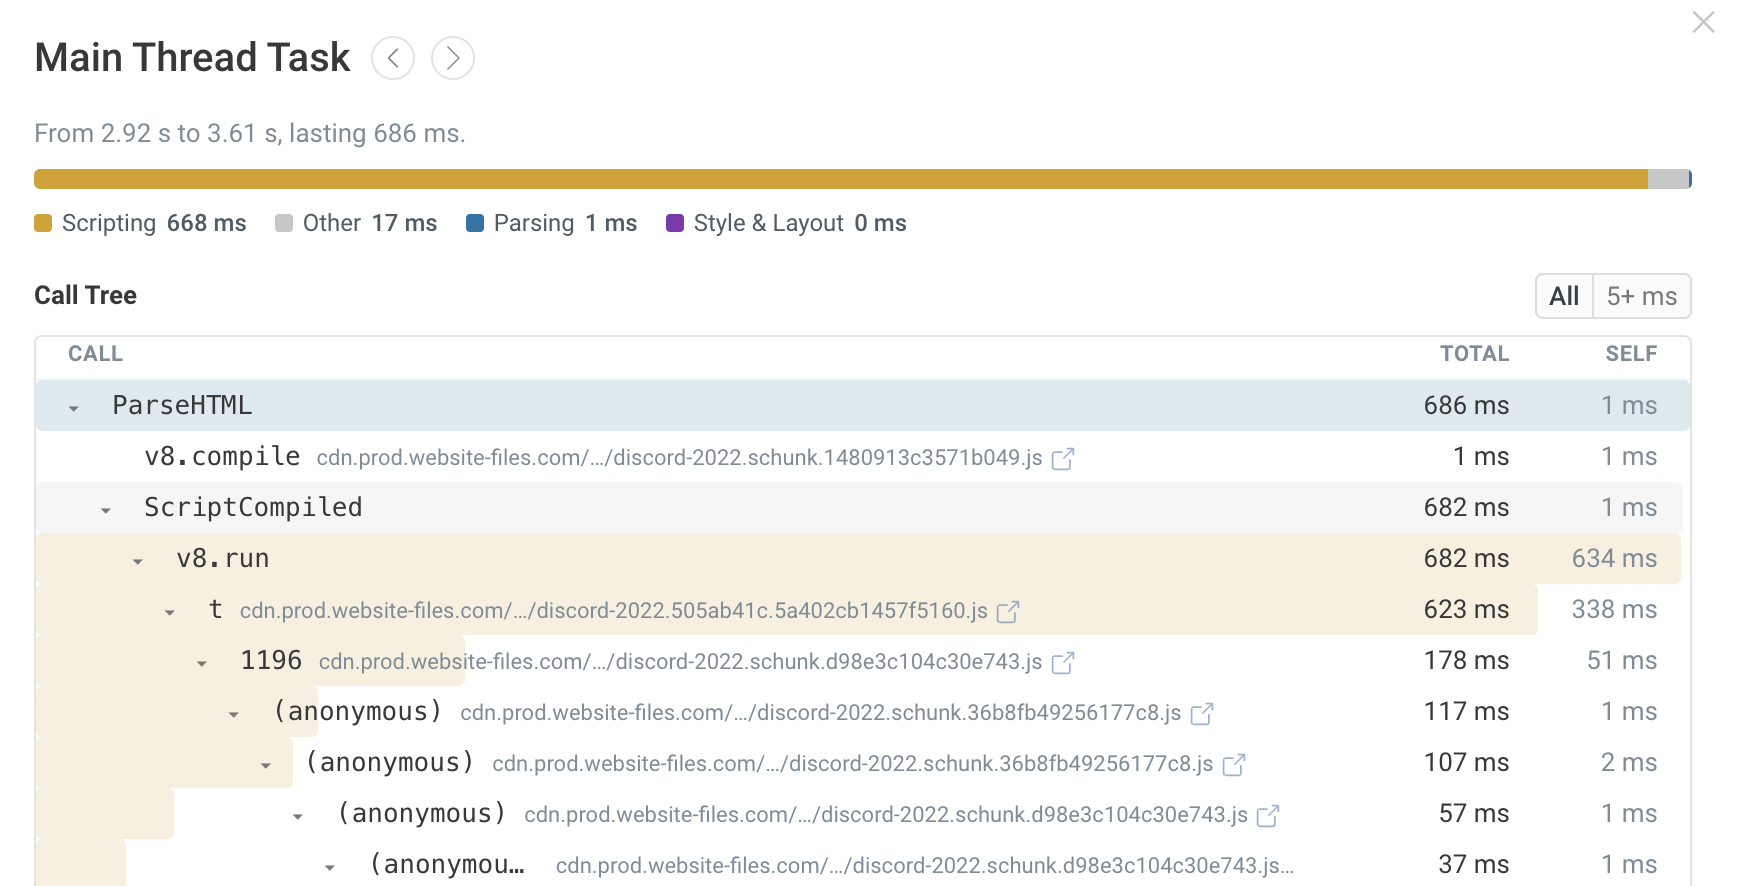
More detailed CPU processing insights
Our lab test CPU timeline now shows more information on the type of CPU task.
In your project or page settings you can also enable detailed CPU task data collection. In this case, full call stacks will be reported, but collecting this additional data will result in worse CPU Time and Total Blocking Time metrics.
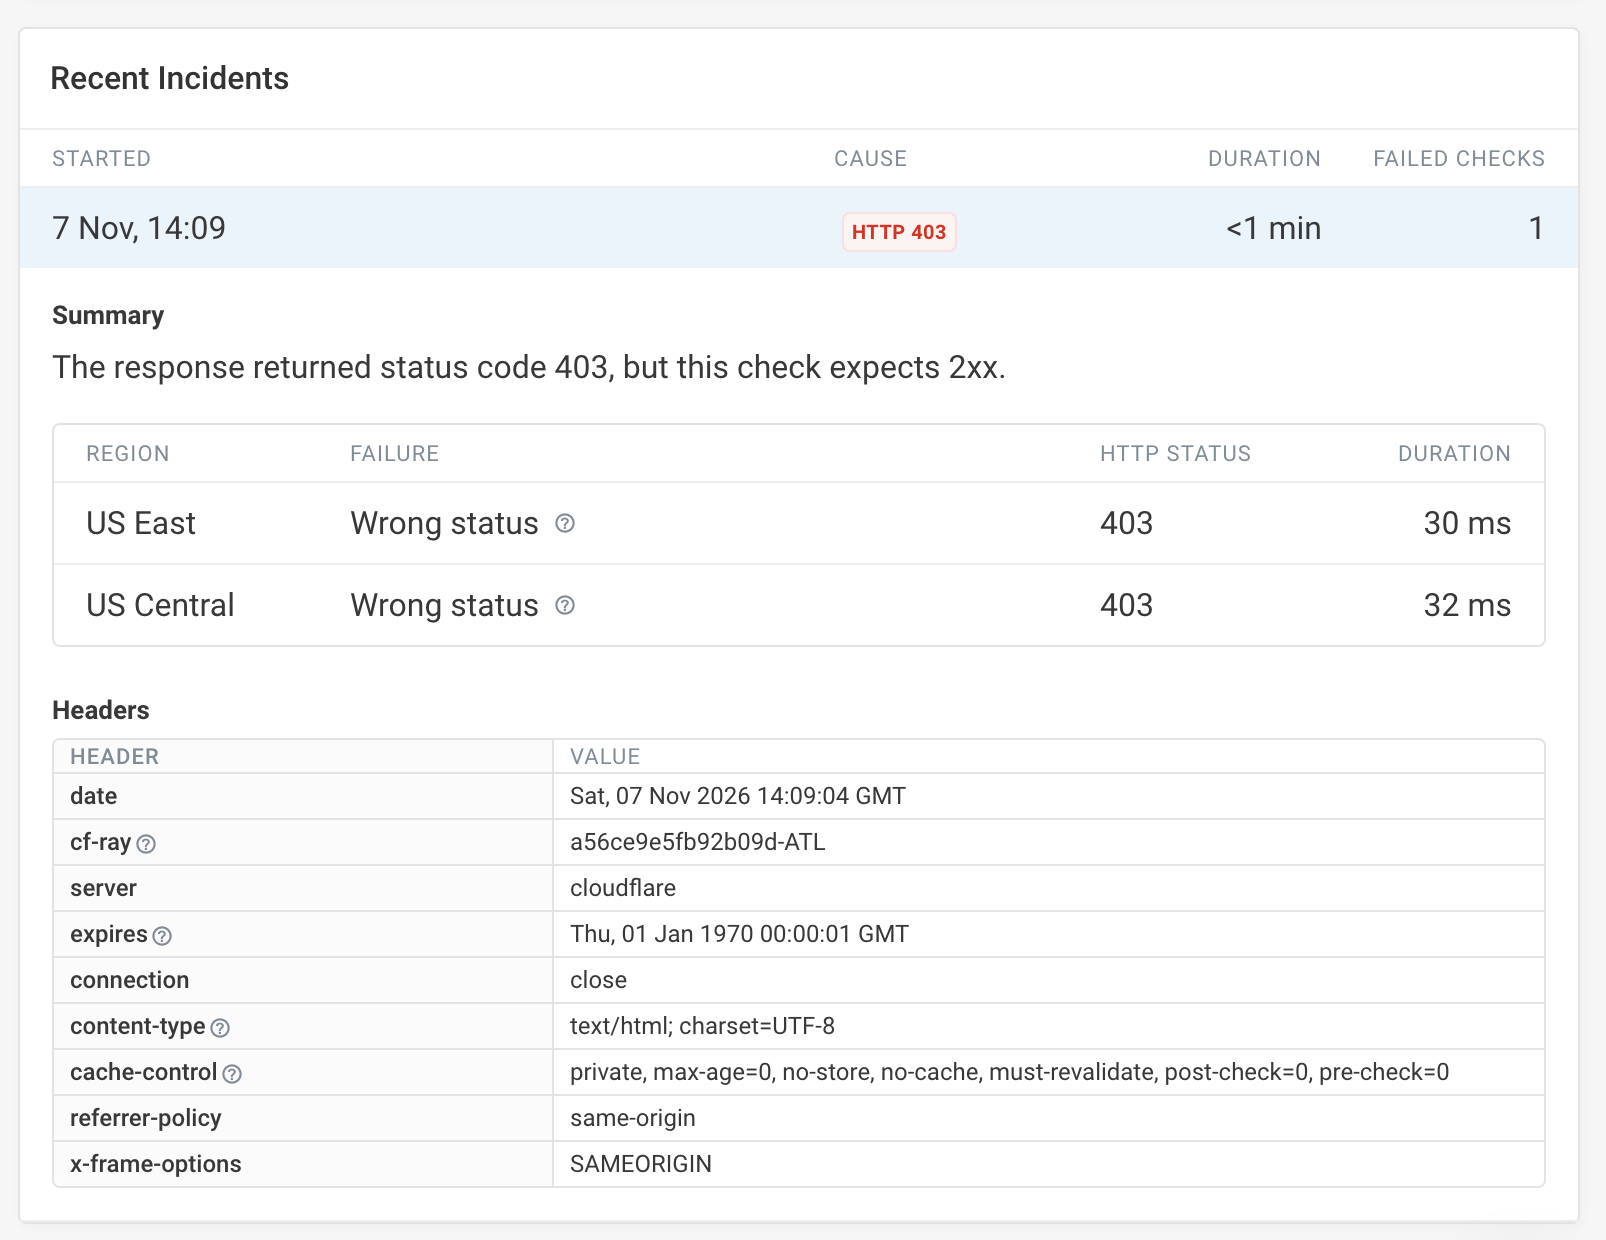
Debug data for uptime checks
When an uptime check fails we now show debug data like the result of each regional check and the response headers we received.
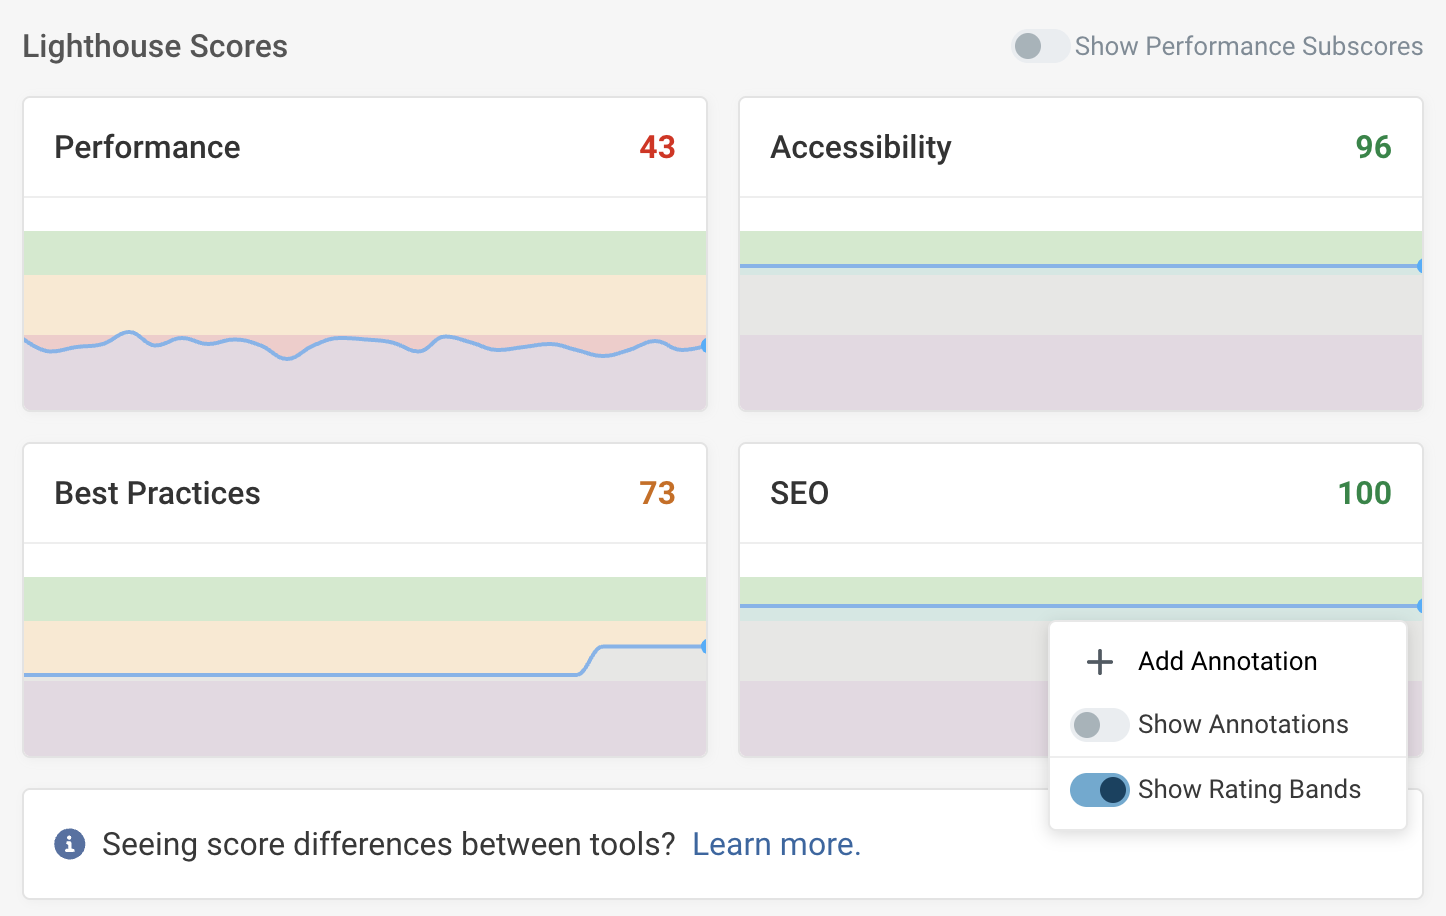
Metric rating bands
If you want to know how well you're doing on each metric, you can now right-click on your charts and select Show Rating Bands to view a good, needs improvement, or poor rating.
Generate user flows with AI
It's often tricky to find the right CSS selectors to interact with content on a page. Our new AI user flow generation feature automates this for you.