Uptime Debug Data
When an uptime monitor goes down it's not always clear what started failing. DebugBear's uptime debug data provides a detailed snapshot into failed checks.
Where to find it
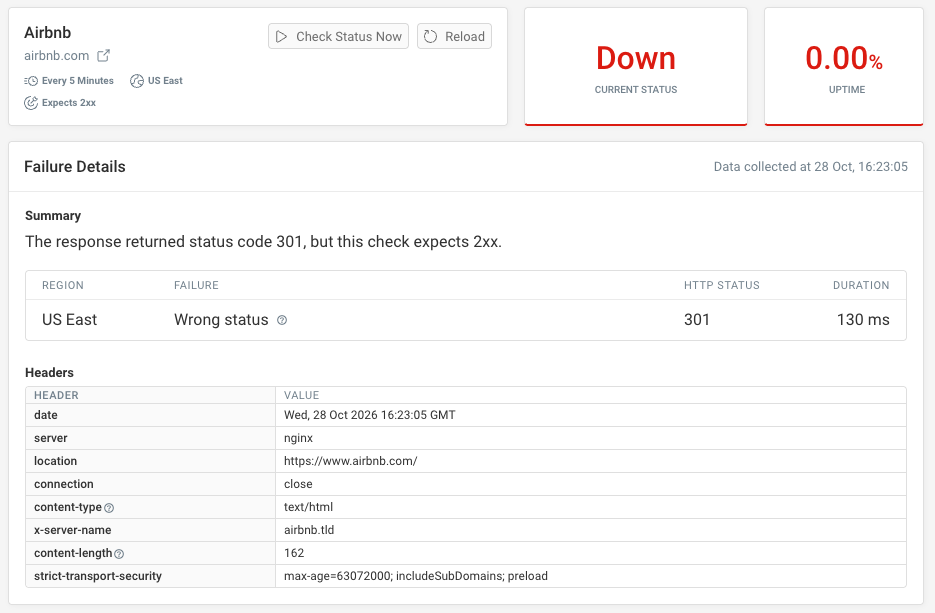
While a monitor is down, a Failure Details box appears on the monitor page.
You can also expand an item under Recent Incidents to see what debug data was collected.
What's collected
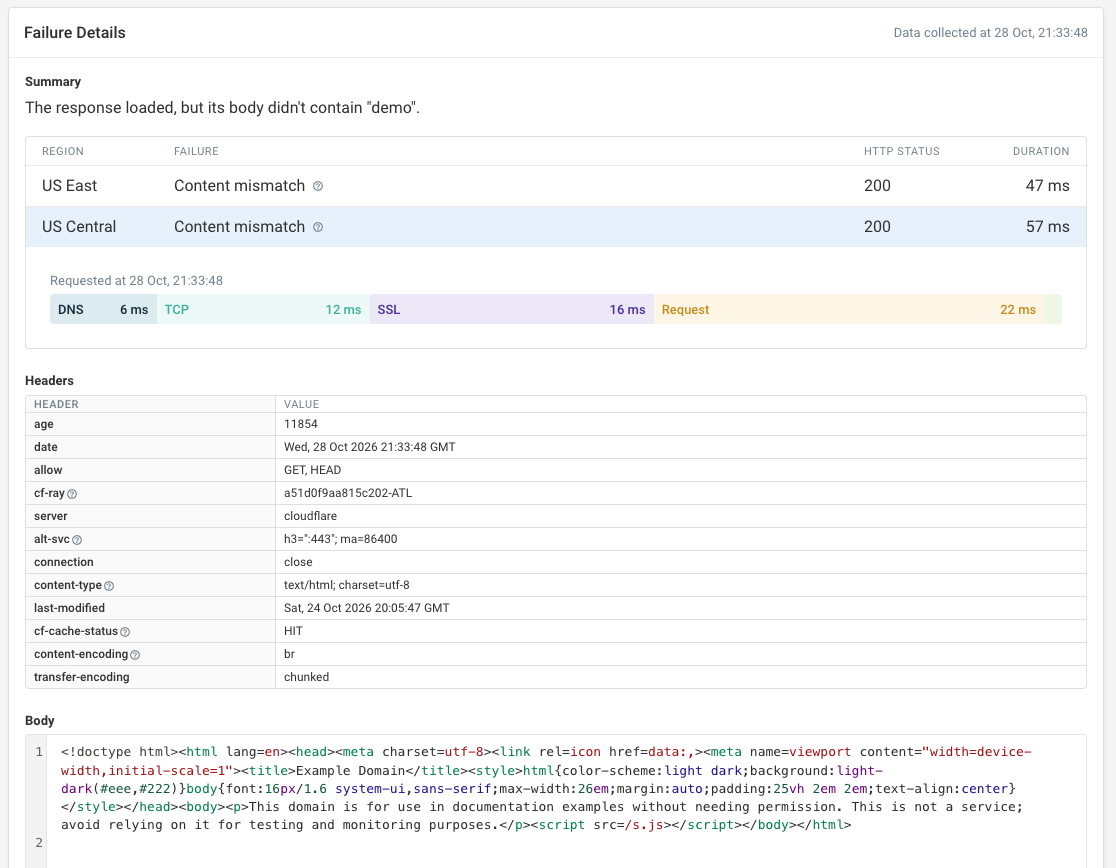
The uptime debug data includes the following information:
- Why the check failed
- What the result of the intial and verification check were
- What response headers the server provided
- The response body if your uptime check is configured to look for a particular string in the response
When debug data is collected
Debug data is kept when a monitor goes from passing to failing, not for every failed check.
A fresh snapshot is also collected every 12 hours for ongoing outages. When an uptime monitor is flaky up to 4 debug snapshots are collected per 4-hour window.