This month we've added a new Browsers tab with Baseline feature support, CrUX Ad Insights metrics, and new options for Custom Dashboards.
New browsers tab
The View Count dashboard in Real User Monitoring (RUM) has a new Browsers tab containing information on which browsers your visitors are using. There is a chart highlighting the percentage breakdown of visits between browsers such as Chrome, Safari and Firefox.
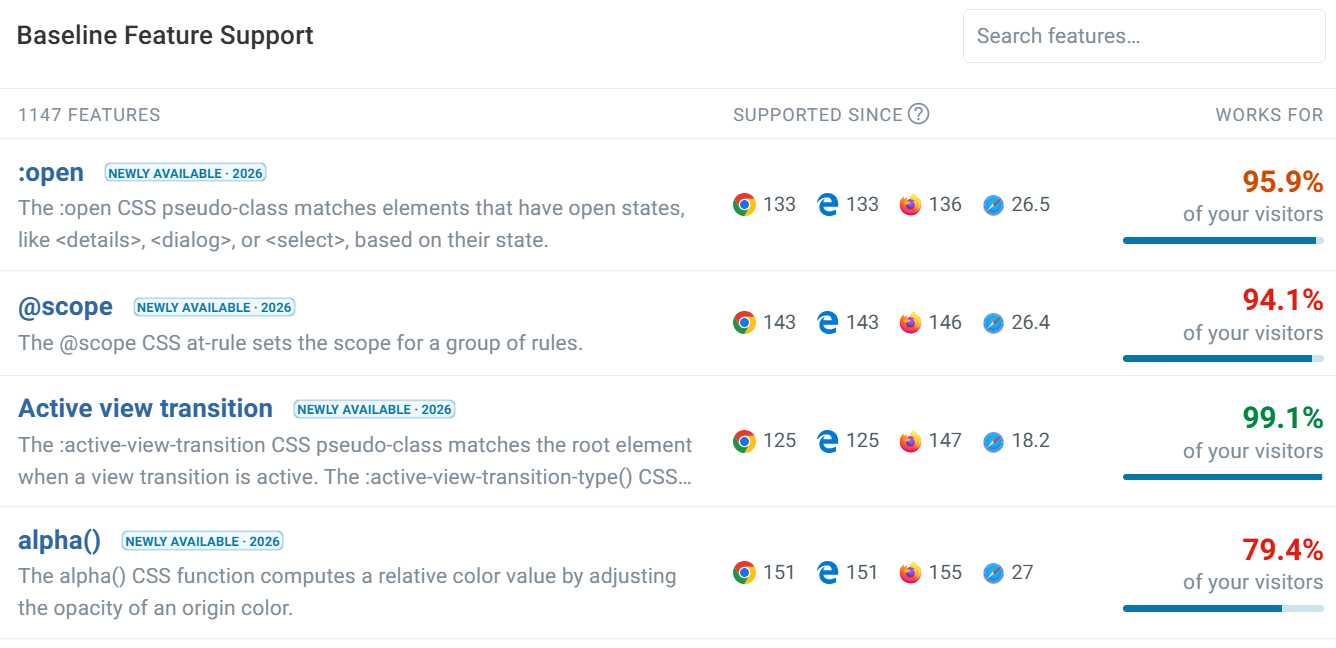
Below the browser chart, we have the Baseline Feature Support table. This table identifies features which are supported across Chrome, Edge, Firefox and Safari as well as the version in which each feature was first supported. You can also see the percentage of visitors whose browsers support each feature, helping you make informed decisions about which features are safe to use.
CrUX Ad Insights metrics
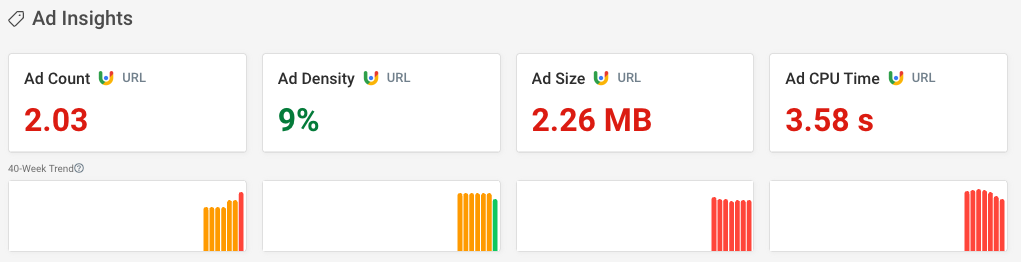
Google recently released new ad metrics, giving you insight into how ads can impact performance on your page. We have added the new CrUX data to the Web Vitals tab. If you have the data available, you can find the Ad Insights metric group at the bottom of the page.
For more information, read our blog post.
Rating thresholds in custom dashboards
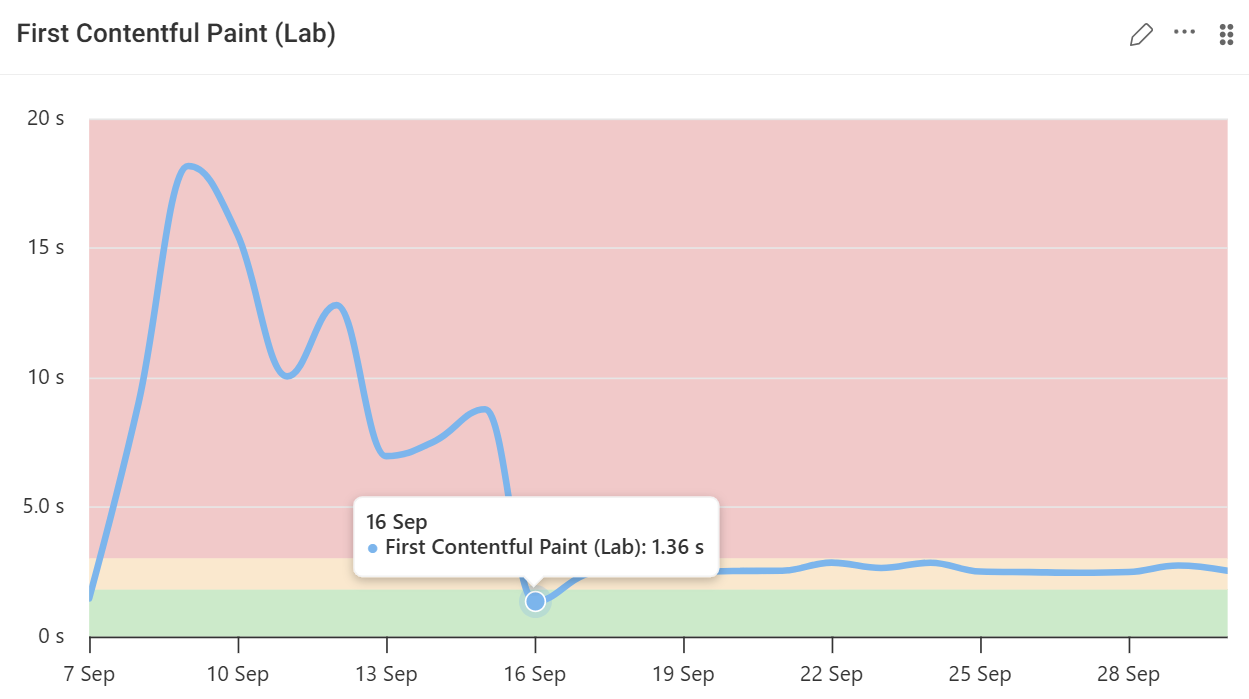
Based on customer feedback, we have updated the UI to include the standard rating thresholds for metrics across Custom Dashboards.
Now you can visually see how thresholds have been breached over time, such as in the First Contentful Paint (FCP) example below.
Custom aggregation intervals
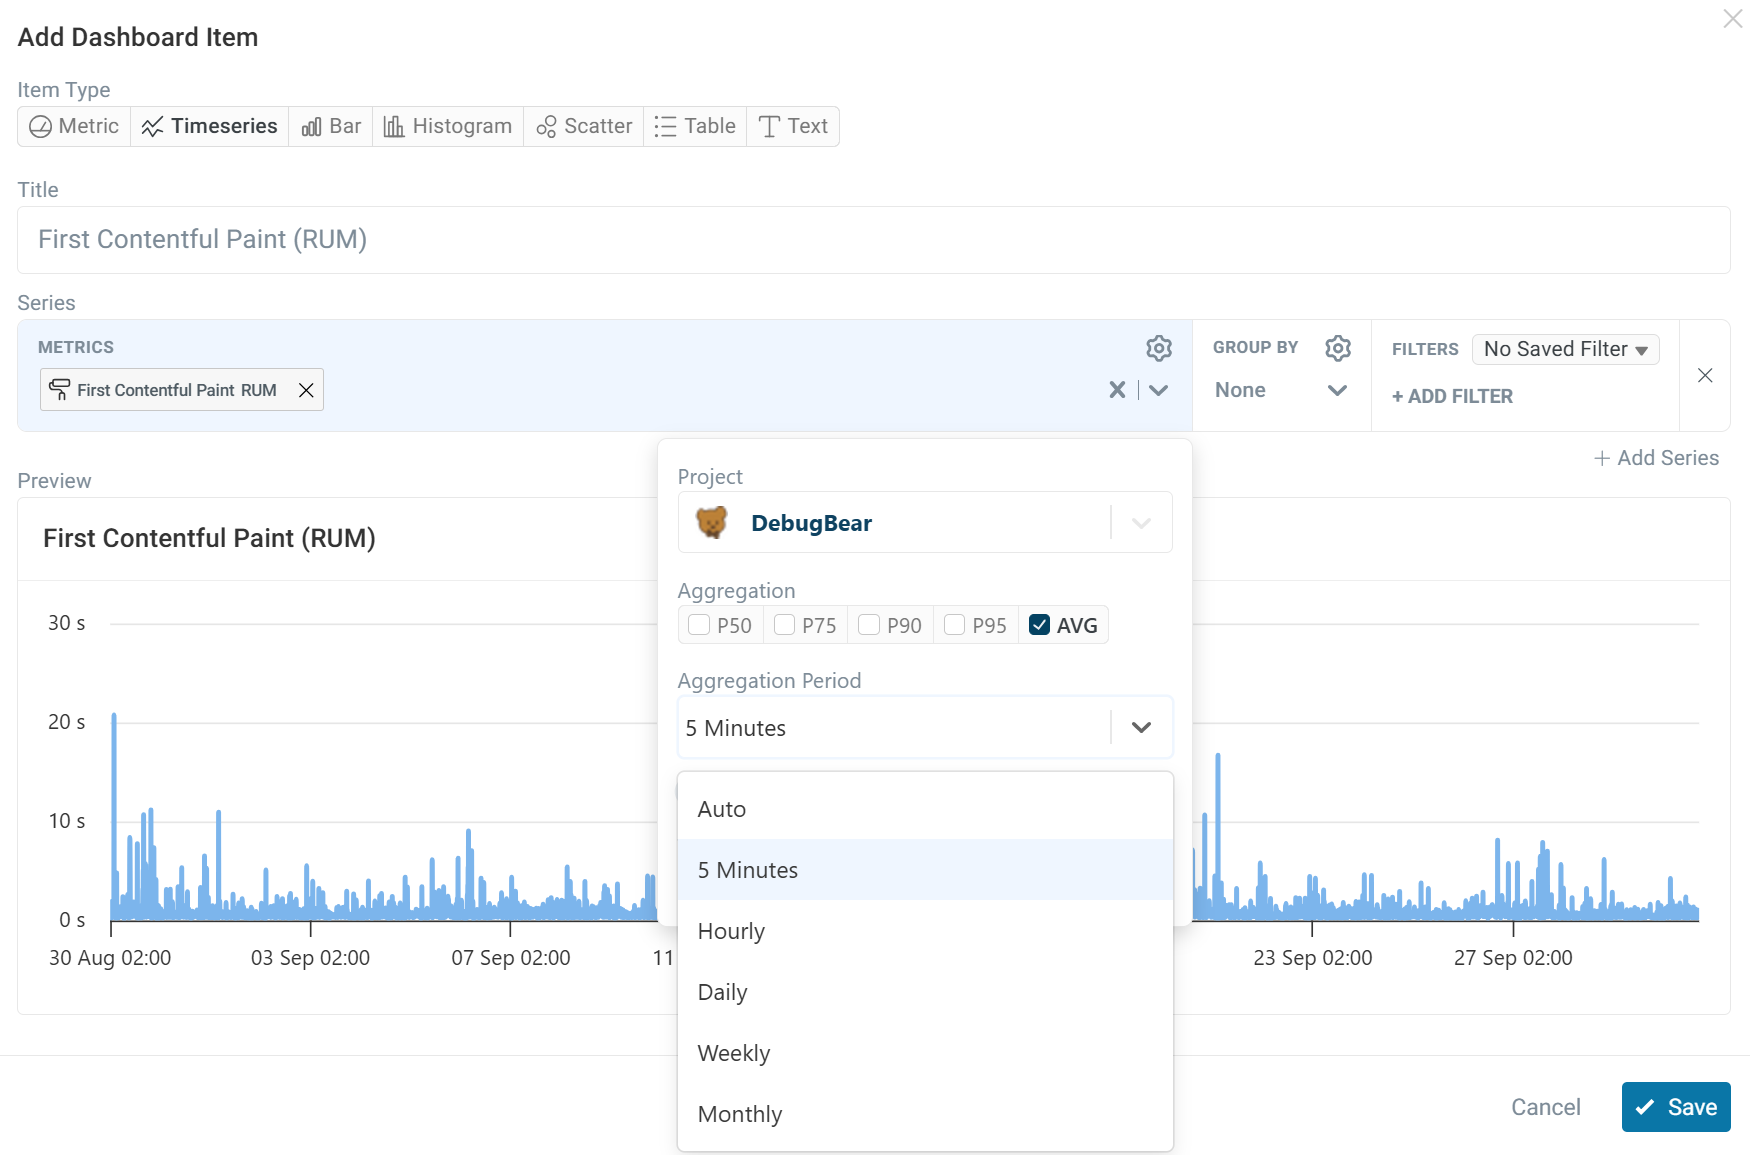
We have also added custom aggregation intervals for both lab and RUM data in Custom Dashboards. When adding a new dashboard item, you can select the aggregation period for the metric data, giving you greater flexibility when creating custom reports.
New articles
- How Marketing And Development Teams Can Collaborate On Page Speed: How marketing and development teams can effectively collaborate and resolve web performance issues.
- New Data From Google: See How Ads Impact Web Performance: A look at Google's new ad performance metrics.
- Example.com Just Launched The Biggest Redesign In Decades: An analysis of 20+ years of changes to example.com.
Web performance videos
- How to monitor backend performance with Server Timings: How to find and monitor Server Timings.