Raygun Alternative: Monitor Core Web Vitals

Track page speed in the lab and for real users.

Deliver a great user experience and rank higher in Google.

Raygun alternative page speed dashboard
”We've updated around 15,000 pages and saw some nice gains from it. "Good URLs" and their impressions have increased 3x since implementation.“
Web performance monitoring user profile picture
Rafayel Begoyan
Senior SEO Specialist
CoinStats logo
”DebugBear has been an eye opener for us and has really shown what's causing the Core Web Vitals issues on our website.
Web peformance monitoring user profile picture
Mandip Ahdan
Head of Engineering
The Independent logo
Trusted By Hundreds Of Happy Customers
DebugBear Customers DebugBear Customers

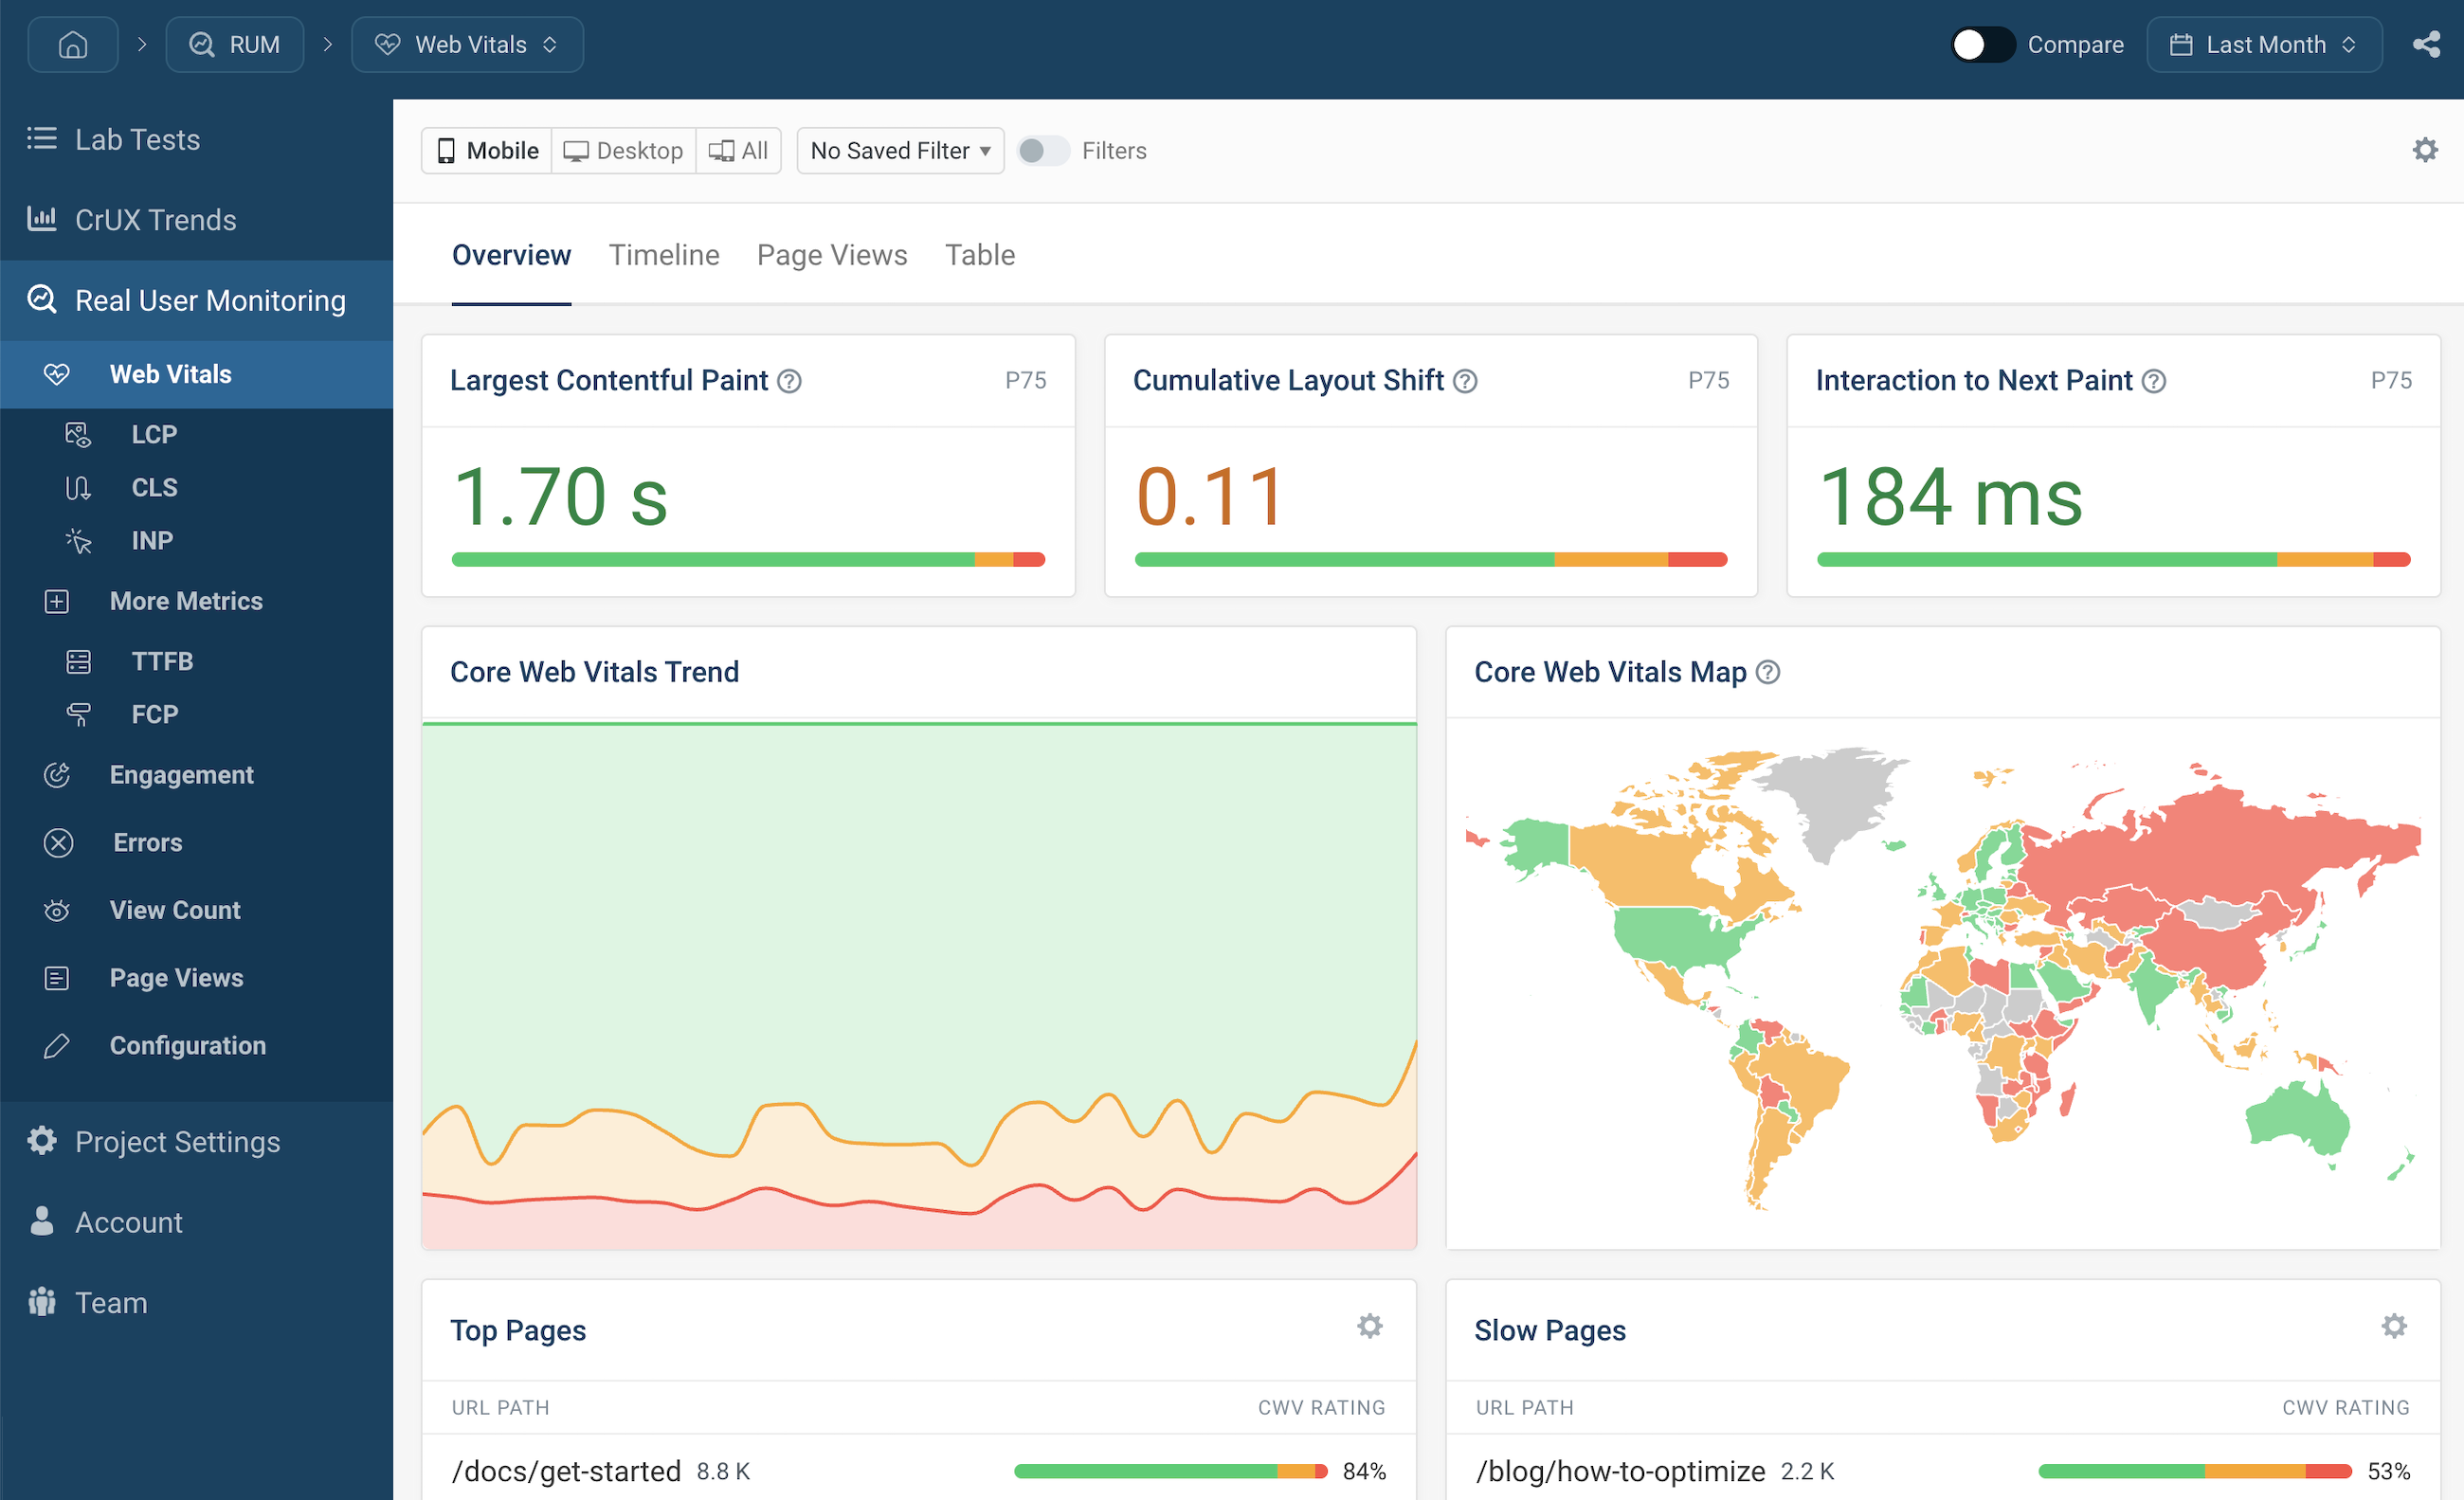
Built for Core Web Vitals

A dedicated website performance solution

DebugBear is built for page speed monitoring and optimization. Unlike Raygun, we don't offer in-depth error monitoring.

Fix Interaction to Next Paint

Improve Google's INP metric by tracking what elements users interact with and what scripts are slowing them down.

Advanced real user monitoring

Get real user data, including detailed metric breakdowns and a request waterfall.

DebugBear RUM dashboard

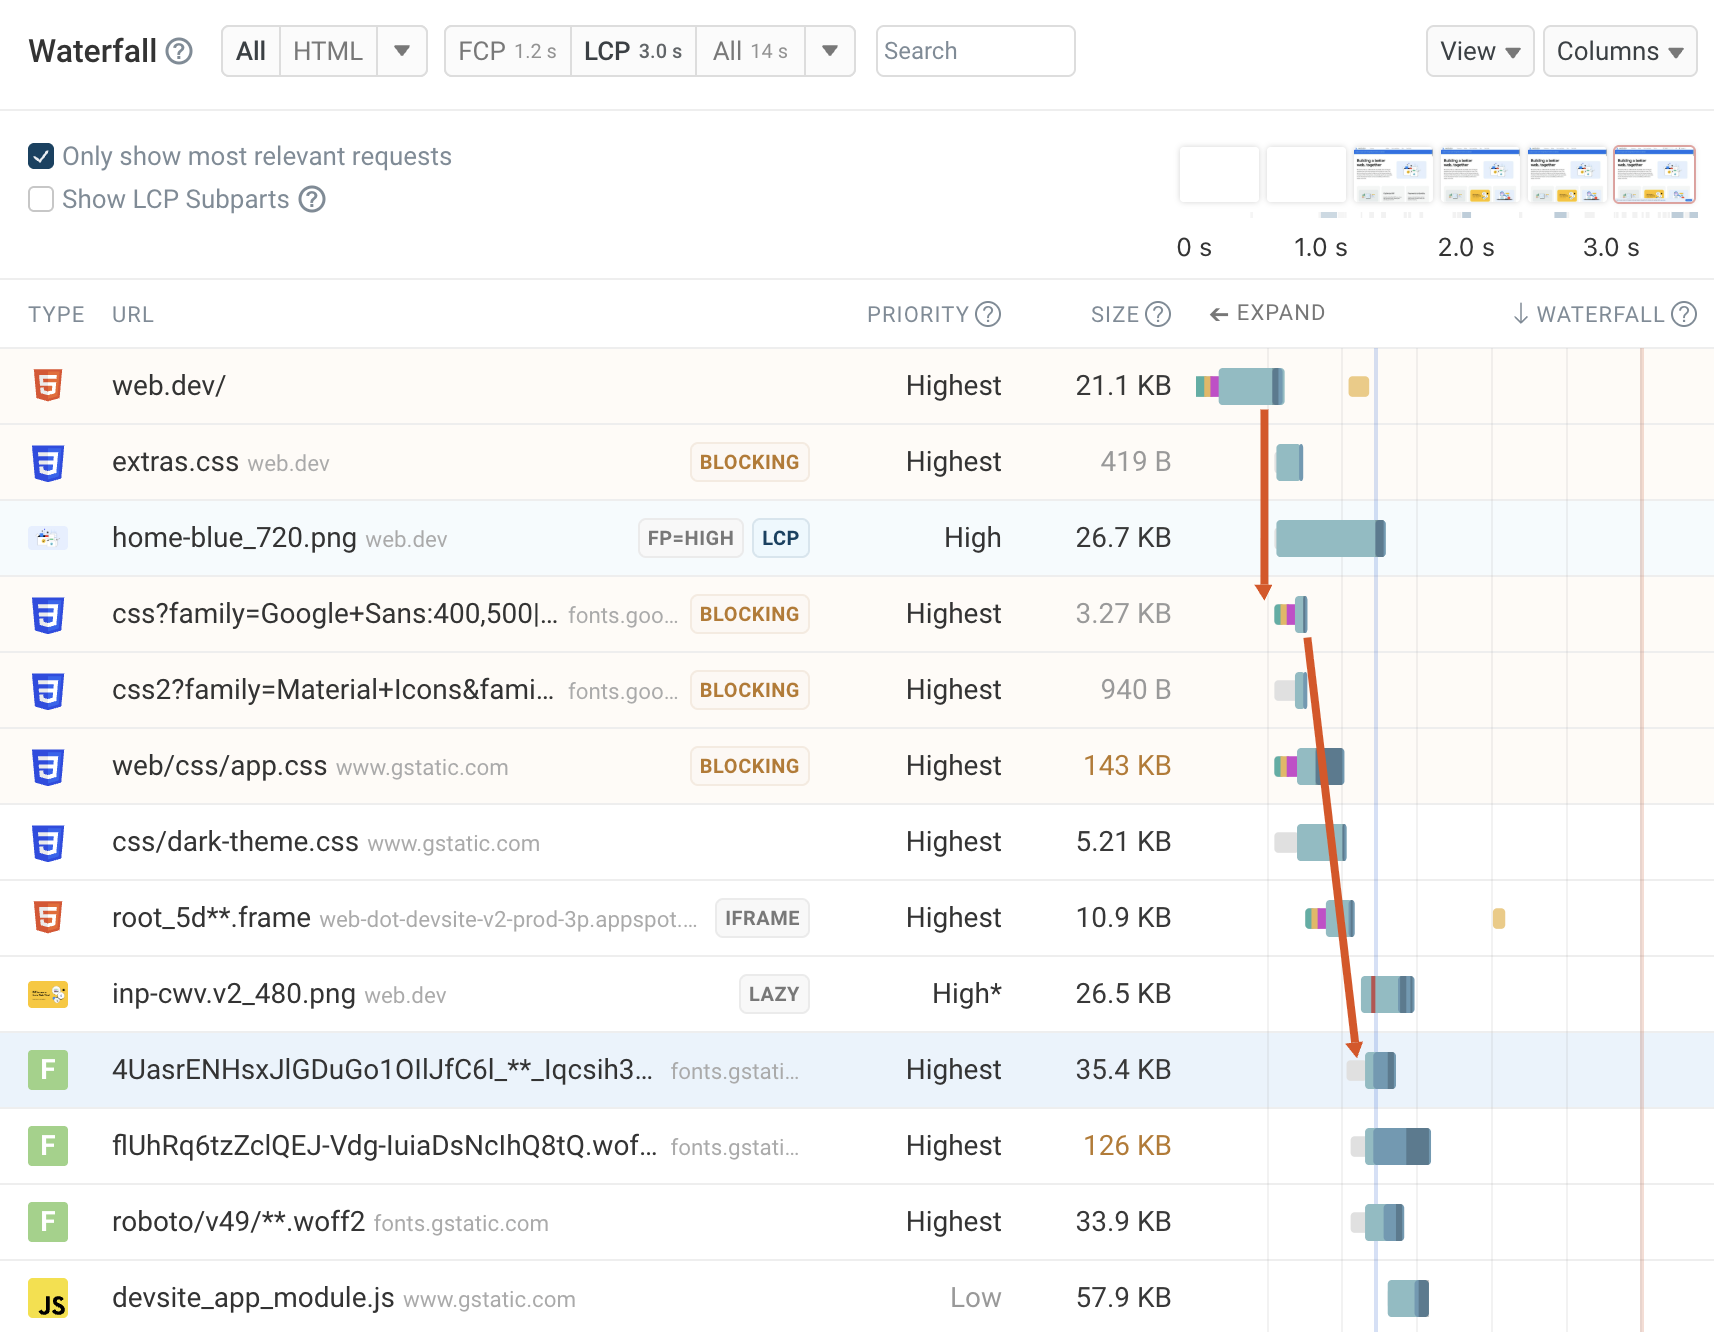
Synthetic page speed tests

Run detailed tests on a schedule

DebugBear's lab-based tests provide detailed analysis and recommendations to help you improve your website.

Track Google Lighthouse scores

As part of every test we also run Google's Lighthouse tool to measure Performance, SEO, Best Practices, and Accessibility.

Get alerted when there's a problem

If your website speed gets worse we'll notify you by email, Slack, or Microsoft Teams.

Lab test waterfall chart

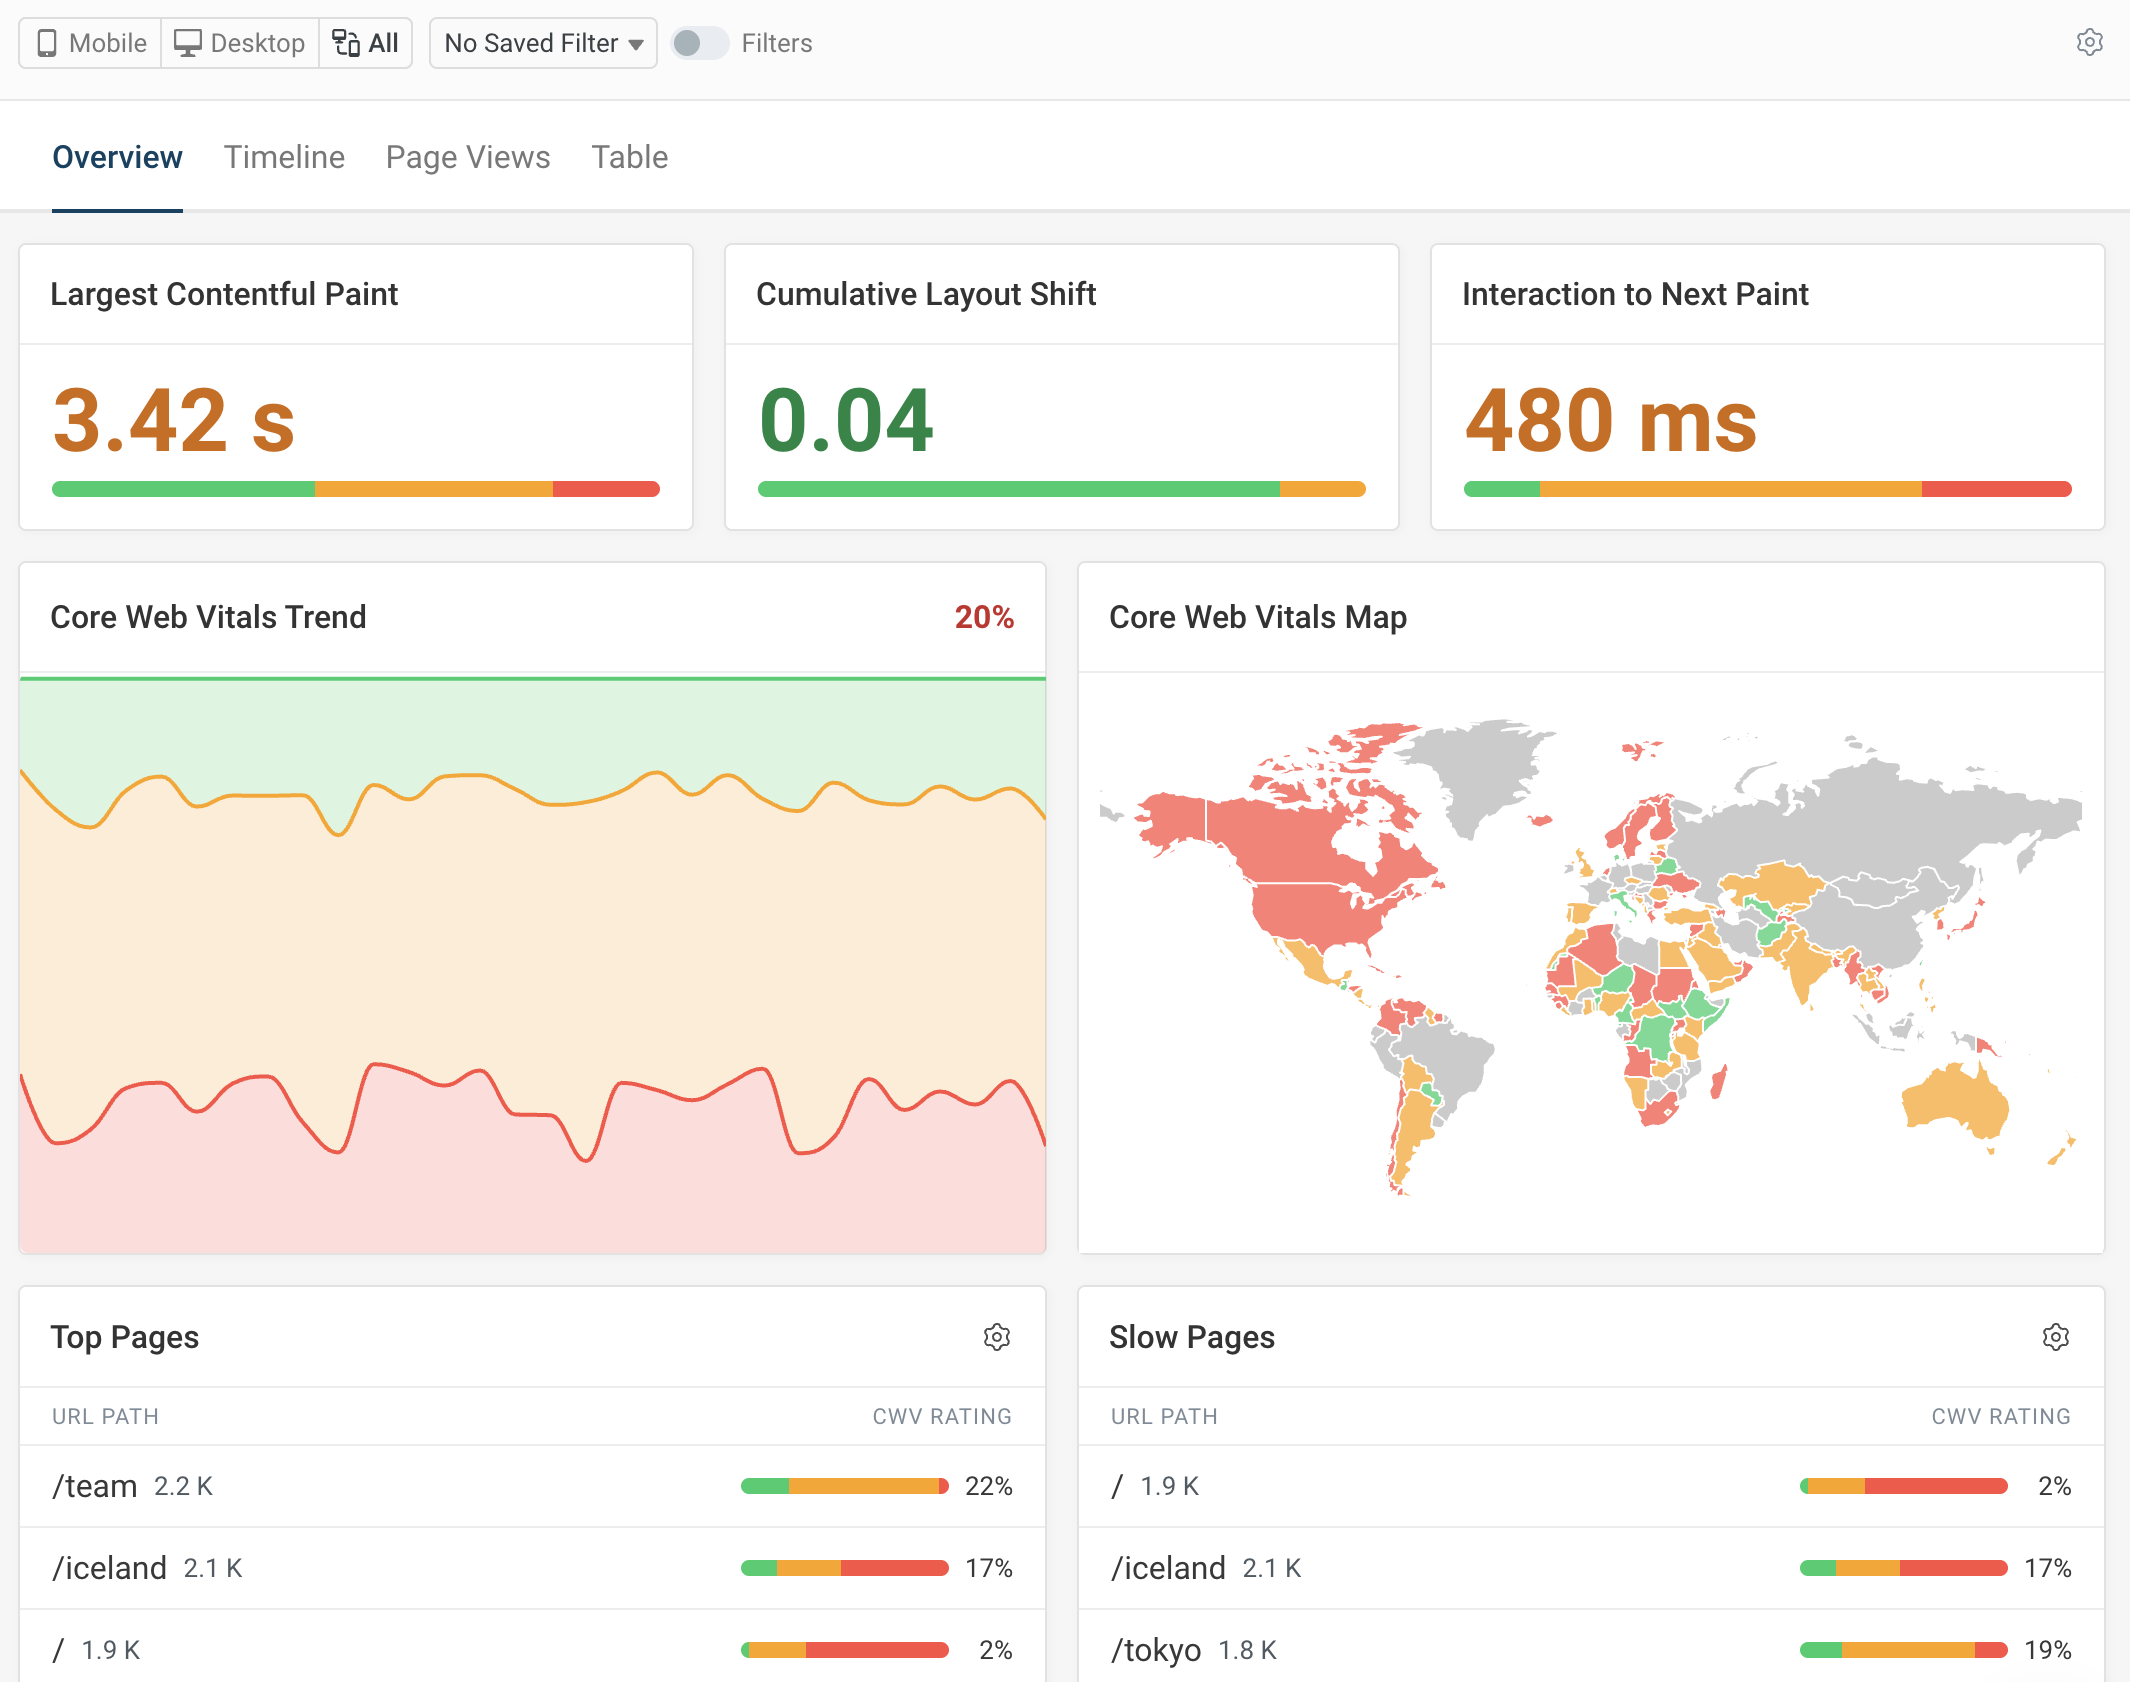
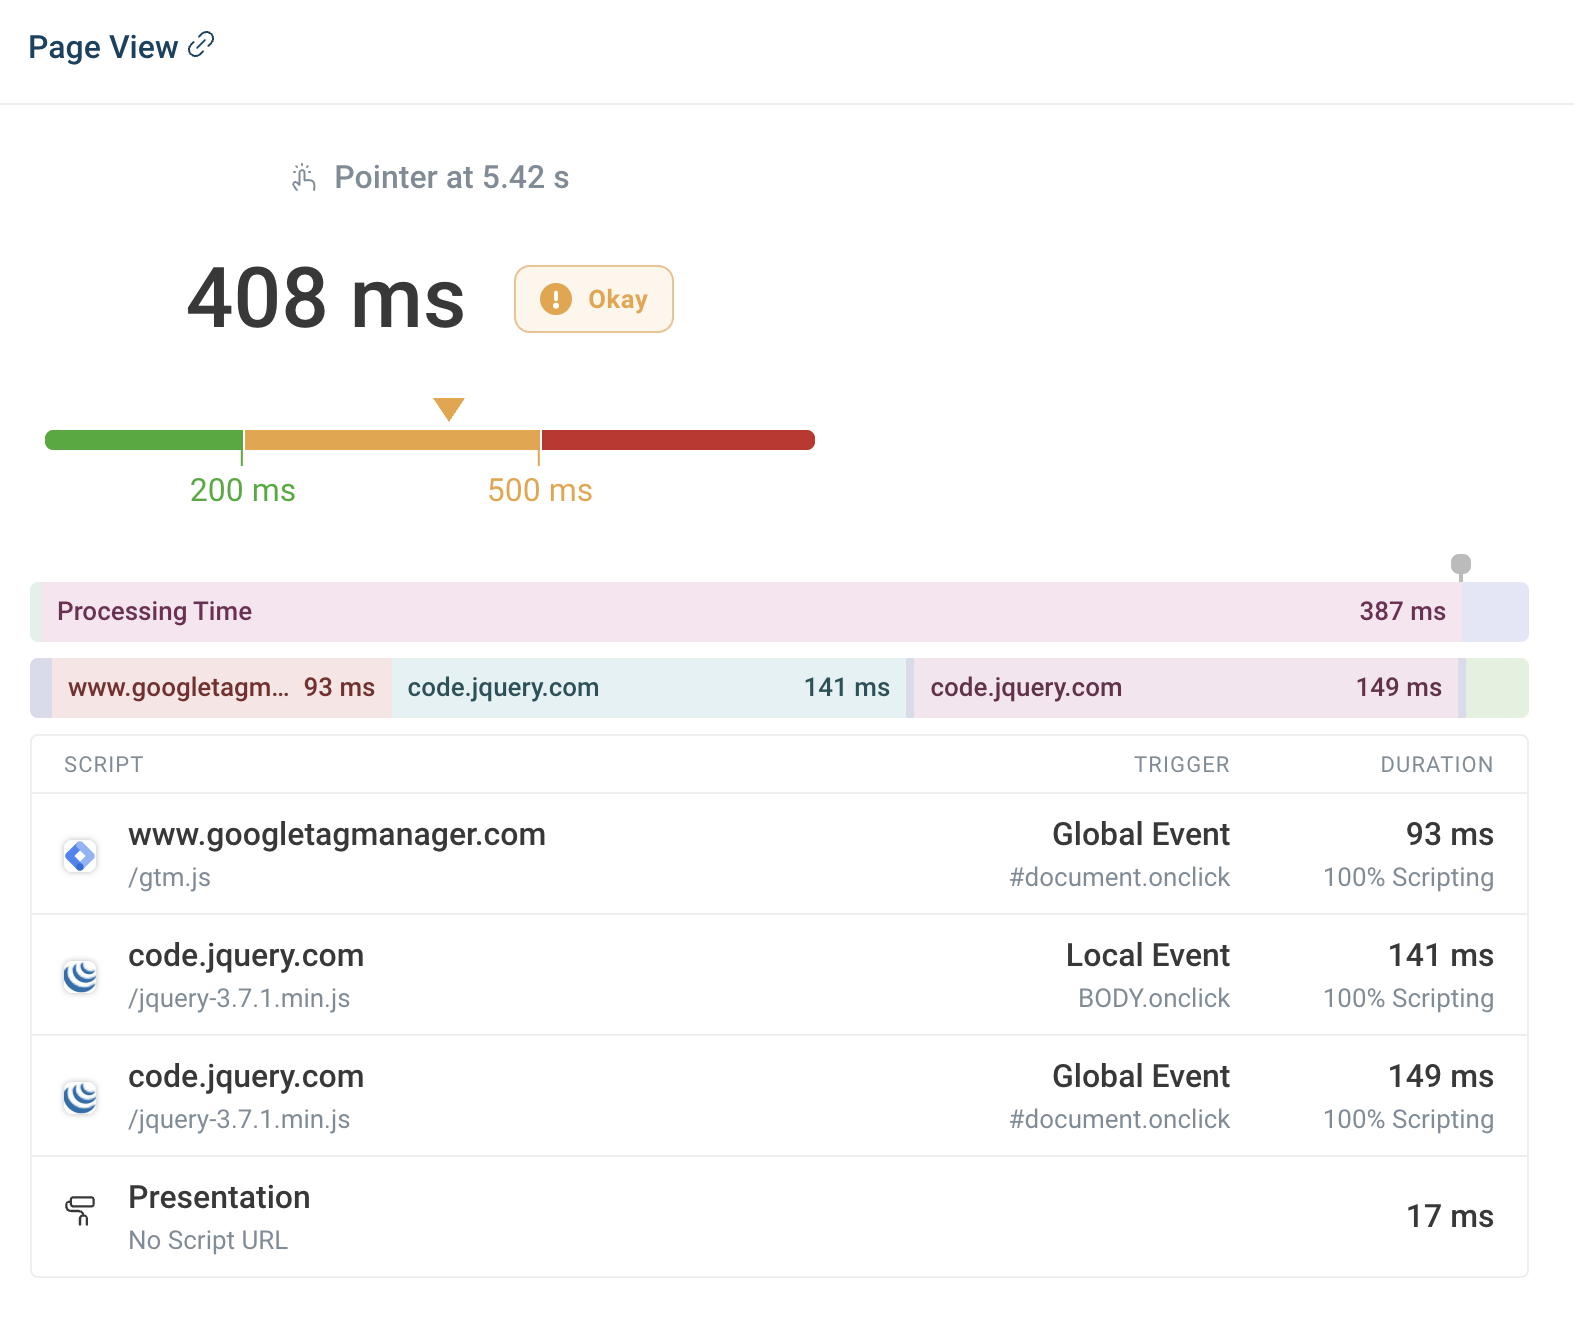
Detailed real user reporting

In-depth RUM insights

View breakdown data for Time to First Byte, Largest Contentful Paint, and Interaction to Next Paint. See how these metrics vary by page, device, and location.

Identify slow scripts and requests

Find out which specific scripts and network requests are causing poor user experience.

Review individual page views

View a request waterfall, JavaScript errors, and soft navigations for specific visits.

RUM Interaction to Next Paint breakdown

Google CrUX metrics

Improve SEO and user experience

Google's Chrome User Experience Report (CrUX) measures how fast your website is for real users. This data is then used as a ranking factor.

Track CrUX data over time

DebugBear monitors CrUX metrics including the Core Web Vitals, network round trip time, and a breakdown of navigation types.

Google Crux metrics in DebugBear

Get set up in minutes.

No credit card required.
Start Free 14-Day Trial

You are using an old browser that is not supported anymore. You can continue using the site, but some things might not work as expected.