
You probably know that running Google Lighthouse audits manually on individual pages can offer helpful insights. But if you want to monitor performance across an entire website, or track changes over time, then you'll need a robust way to automate the process.
Lighthouse automation allows you to run performance, accessibility, SEO, and best practices audits in bulk, on a schedule, and integrate these tests into your development workflow. That means you needn't worry about unnoticed performance regressions, where your website is getting slower or less accessible without you noticing.
Let's take a look at how to automate your Lighthouse tests quickly and easily.
What is Google Lighthouse?
Lighthouse is an open-source, automated tool to help you improve the quality of web pages.
You can run it on any web page, public or requiring authentication. It scans the page to see how quickly it loads, if it's accessible, and complies with best practices – it's like a health check, offering clear results including scores and recommendations for improvement.
What is Lighthouse automation?
Lighthouse automation refers to systematically running Google Lighthouse audits without manual intervention. This could mean...
- Bulk testing: Running audits across hundreds or thousands of pages
- Scheduled monitoring: Automatically testing your site daily, weekly, or hourly
- CI/CD integration: Running tests whenever code changes are deployed
- Continuous monitoring: Tracking performance trends over time
- Automated alerting: Getting notified when results change
While a tool like PageSpeed Insights offers Lighthouse scores for one page at a time, there are solutions that can provide constant, ongoing performance metrics for established websites with thousands of critical URLs.
Benefits of Lighthouse automation
There are a whole host of reasons that automating your Lighthouse tests can make your life easier:
- Detect performance regressions: Automated testing catches performance issues before they impact users.
- Analyse historical trends: track how your site's performance evolves over time. This helps identify whether optimizations are working and spot gradual degradation.
- Capture stats for your whole site: Instead of testing individual pages manually, automation can audit your entire site systematically, ensuring no important pages are overlooked.
- Keep teams accountable: Automated reports and alerts keep performance visible to the entire team, making it part of the development process rather than an afterthought.
- Stay competitive: Many automation platforms allow you to monitor competitor sites alongside your own, providing benchmarking data.
How to set up automated Lighthouse testing
Let's take a look at a couple of tools for running regular Lighthouse tests:
- DebugBear
- Lighthouse CI
- DIY automation
- Sitespeed.io
Lighthouse automation with DebugBear
DebugBear is the leading platform for automated Lighthouse testing, offering scheduled tests with automatic regression detection and full report storage. Here's what makes DebugBear stand out for Lighthouse automation:
Key DebugBear features
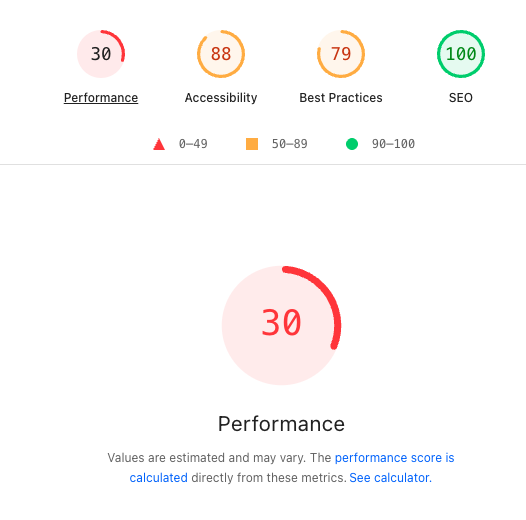
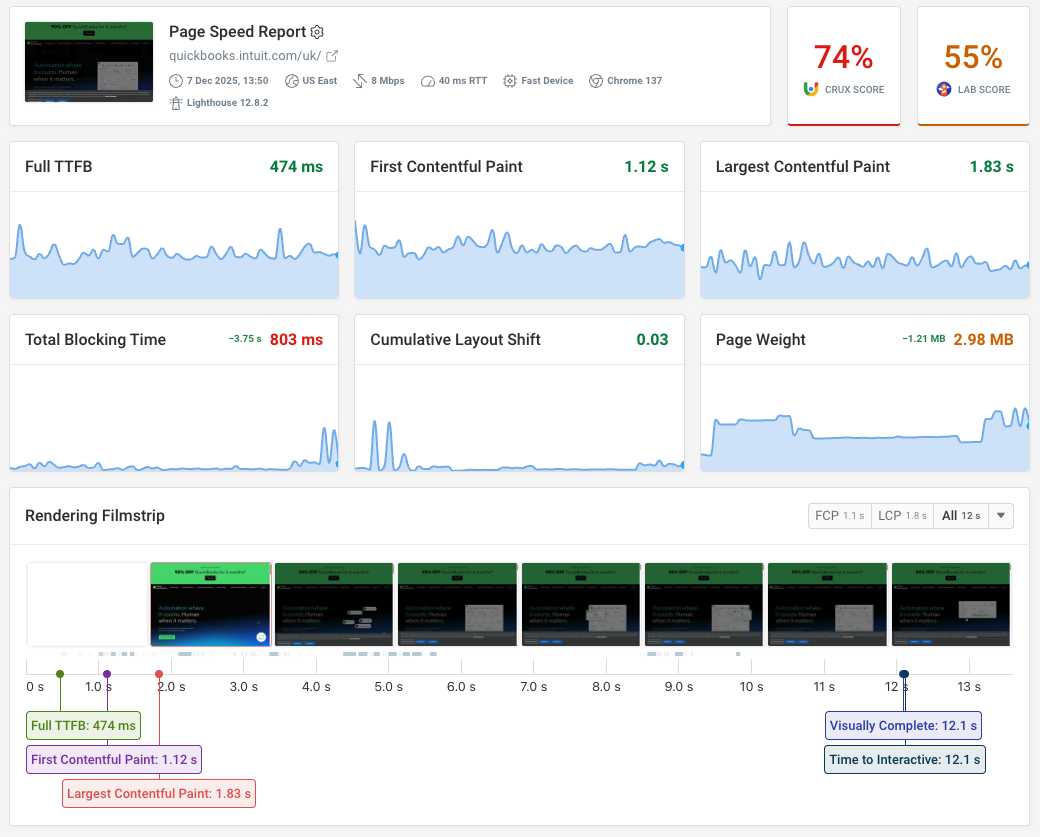
In-depth results: Each test includes full Lighthouse performance scores, along with Core Web Vitals metrics, and full waterfall reports. You can break out the results that contribute to a page's Lighthouse performance score:
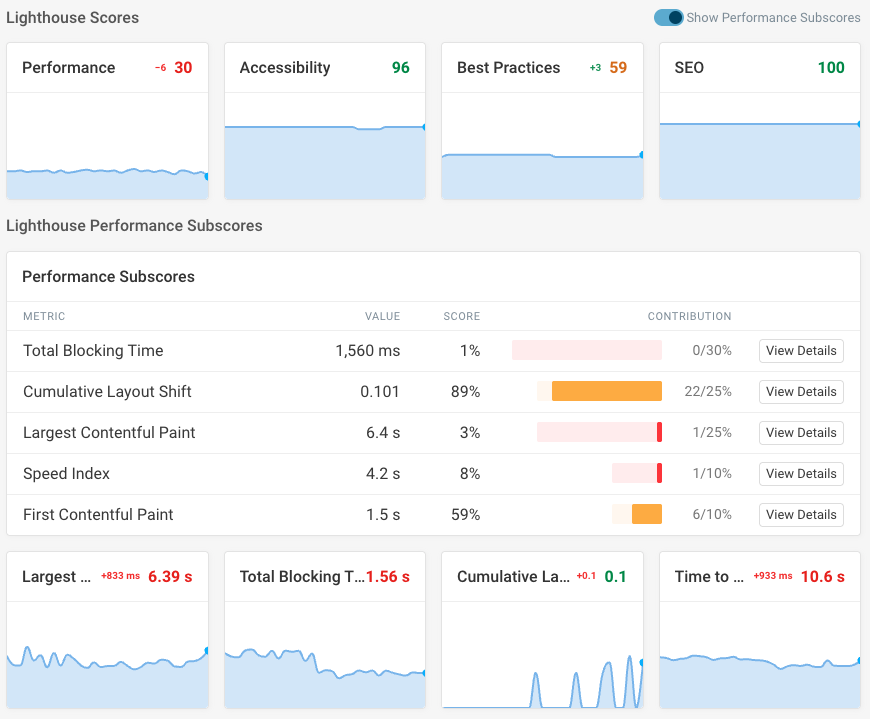
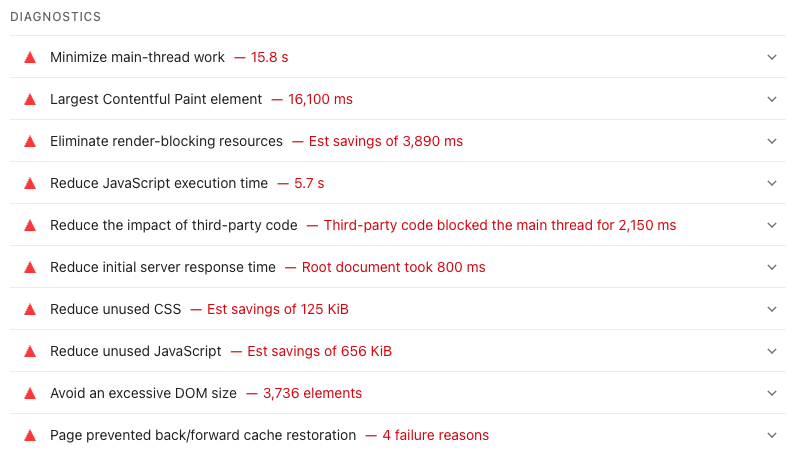
All the audits you'd expect are also available, so you can see what needs improving:
Automated scheduling: DebugBear can run scheduled synthetic tests on all your URLs, from monthly checkups to hourly tests for mission-critical pages. Each test captures not just Lighthouse data, but a whole host of metrics to diagnose and fix site speed problems.
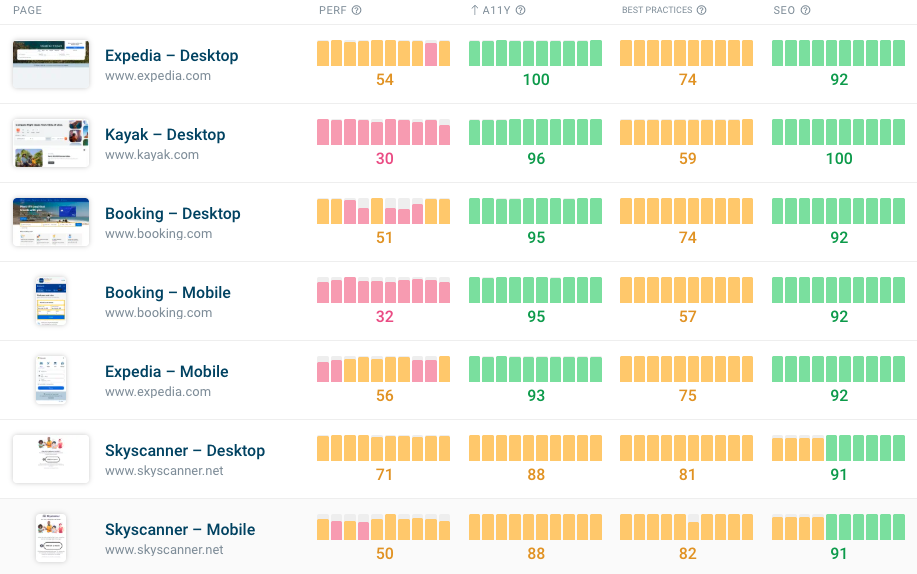
Dashboard views: Get an at-a-glance view of your pages' Lighthouse performance, and quickly sort your pages by their Lighthouse subscore so you can identify those most in need of improvement. Or, as pictured below, you can use this view to monitor competitors for benchmarking purposes.
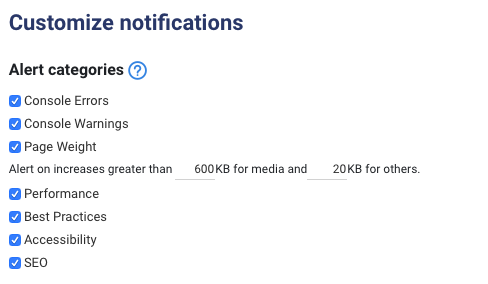
Lighthouse regression alerts: Using DebugBear's alert feature, you can receive updates in Slack, Teams or via email if your Lighthouse performance score suddenly changes. Alerts for changes to page weight, or console errors, are also available.
Bulk URL testing: With DebugBear's bulk URL upload, you can submit hundreds or even thousands of URLs to monitor. You can also submit a sitemap, and DebugBear will crawl your site automatically.
Automatically review performance impact of code changes: You can also automate Lighthouse tests when new code is deployed to your website. For example, you can monitor your Lighthouse scores through DebugBear's integration with CircleCI and GitHub, every time there's a new commit to your React app.
Packet-level throttling: Many other Lighthouse solutions (including Google's own implementation) use 'simulated' throttling to measure how your website performs on slow devices or connections, which can lead to unhelpful inaccuracies. In contrast, DebugBear slows down data one packet at a time, giving more accurate results.
On top of Lighthouse audits, DebugBear also offers Google CrUX data, real user monitoring, and a host of other features. Our free 14-day trial should help you get to grips with the powerful automation features.
Lighthouse CI
This is Google's official solution for Lighthouse tests automation as part of your continuous integration pipeline. Check the performance impact of every pull request before merging it.
Benefits:
- It's free and open source
- Get a Lighthouse report alongside every PR. Prevent regressions in accessibility, SEO, offline support, and performance best practices
- It integrates with CI/CD pipelines
- You have complete control, because it's self-hosted
Best for: Development teams comfortable with setting up their own infrastructure and focused on CI/CD integration.
Getting started with Lighthouse CI
Lighthouse CI provides a step-by-step walkthrough on how to setup Lighthouse CI on your repository. After this guide, your build system will be running Lighthouse on your project's URLs on every commit, automatically asserting that important Lighthouse audits pass, and uploading the reports for manual inspection.
The main steps to set up Lighthouse CI are:
- Prerequisites: Source code is managed with git (GitHub, GitLab, Bitbucket, etc) and you have a project that can be built and served.
- Install Lighthouse CI: Install the CLI tool globally with
npm install -g @lhci/cli@0.15.x - Create configuration: A config file called
lighthouserc.jsat the root of your repo controls the options for Lighthouse CI. The configuration defines which URLs to test, how to serve your site, and where to upload results. - Configure CI provider: Configure the CI provider to run Lighthouse using the
lhci autoruncommand. - Add assertions (optional): Set up performance thresholds and assertions to fail builds when performance degrades.
- Set up server (optional): Deploy a Lighthouse CI server for long-term storage and comparison of historical results, rather than using temporary public storage.
The Lighthouse team recommends starting slowly based on your team's familiarity with performance measurement, beginning with basic report collection before adding assertions and custom server setups.
DIY Automation with the Lighthouse CLI
For custom solutions, you can use Lighthouse from the command line to automate your Lighthouse runs with shell scripts, or integrate Lighthouse into your continuous integration systems as a Node module.
You can also use the PageSpeed Insights API to run tests using Google's infrastructure and then keep track of the result data using your own systems.
Sitespeed.io
Sitespeed.io offers open source tools, compatible with Grafana and Graphite, to monitor the performance of your website, including Lighthouse automation. You can simply run it as a Docker container.
Putting Lighthouse automation into practice
The fastest way to get started with Lighthouse automation is to start a DebugBear trial and set up monitoring for your key pages. This gives you immediate insights into your site's performance trends, and helps establish baselines.
Lighthouse automation can improve your web performance efforts from reactively firefighting slowdowns into an ongoing part of your development process.
Whether you're monitoring a small business site or managing performance across enterprise applications, automated Lighthouse testing ensures your users consistently get the fast, accessible experience they expect.


Monitor Page Speed & Core Web Vitals
DebugBear monitoring includes:
- In-depth Page Speed Reports
- Automated Recommendations
- Real User Analytics Data