
GTmetrix and other tools let you measure page speed and identify ways to improve your website performance.
But how is GTmetrix different, and what tools provide data you can trust? In this article we'll compare GTmetrix to Google's PageSpeed Insights tool as well as WebPageTest by Catchpoint and Pingdom.
GTmetrix vs. PageSpeed Insights
GTmetrix and PageSpeed Insights are both based on Google's open-source Lighthouse library. It analyzes page load time on your website, provides a performance score, and suggests optimizations.
Crucially, GTmetrix also adds monitoring on top of on-demand tests. You can set up regular synthetic performance tests to track your website performance over time and get alerted when something breaks.
While PageSpeed Insights also provides an assessment of accessibility and on-page SEO, GTmetrix focuses specifically on page load time.
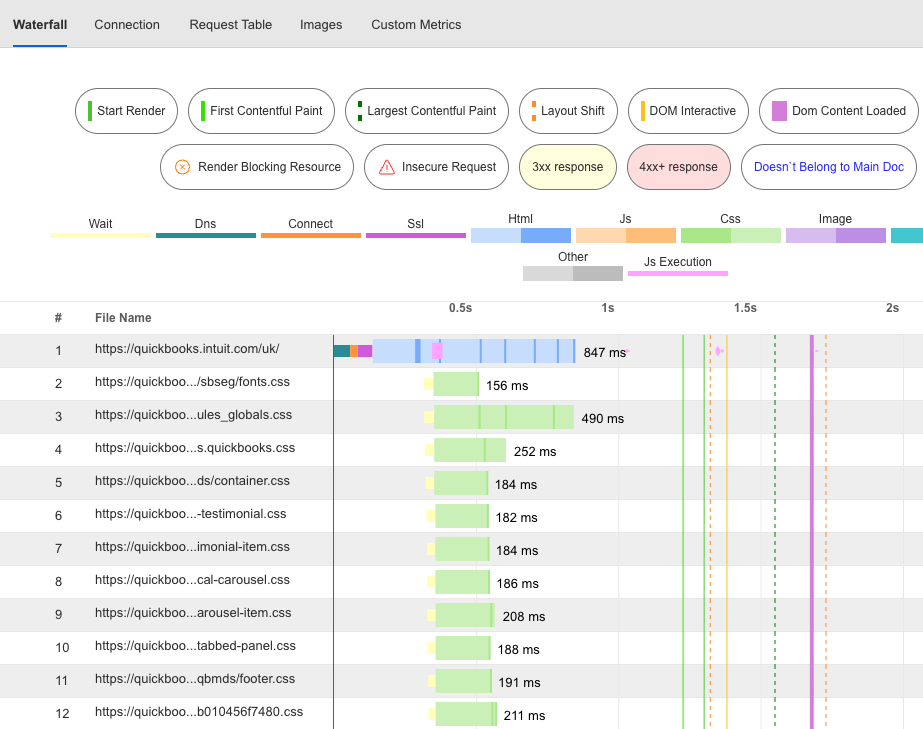
GTmetrix also provides additional reporting, like a request waterfall view and a video recording of the page load process.

Metric discrepancies: should you trust GTmetrix or PageSpeed Insights?
There are two key reasons why you might see different metric values between GTmetrix and PageSpeed Insights:
- Differences in the test environment
- Unreliable network throttling in PageSpeed Insights
Different tools will always report varying performance scores. However, overall you can trust the GTmetrix results more than PageSpeed Insights.
Differences in the test environment
Lab-based performance tests are always run from a specific test location on a device with a certain CPU speed using a specific version of Lighthouse or Chrome.
Different test environments will always result in different metric values. The server running GTmetrix is not the same as the one running PageSpeed Insights. In turn, if you run Lighthouse on your own computer using Chrome DevTools that is again another environment.
None of these environments is "more correct" than the others!
Check the test configuration like server location, bandwidth, and CPU speed for any two test results you're comparing.
Differences in how network and CPU throttling is applied
PageSpeed Insights is sometimes unreliable, because it uses a less accurate way of throttling the network and CPU speed.
Take a look at the screenshot of the Lighthouse test settings below. It says "(Simulated)" after the throttling settings, indicating that PageSpeed Insights is using simulated throttling.

In contrast, GTmetrix actually slows down the network and CPU processing and then reports the values observed when loading the page. Since the throttling simulation sometimes doesn't match real browser behavior, the GTmetrix results are more reliable.
Google CrUX data
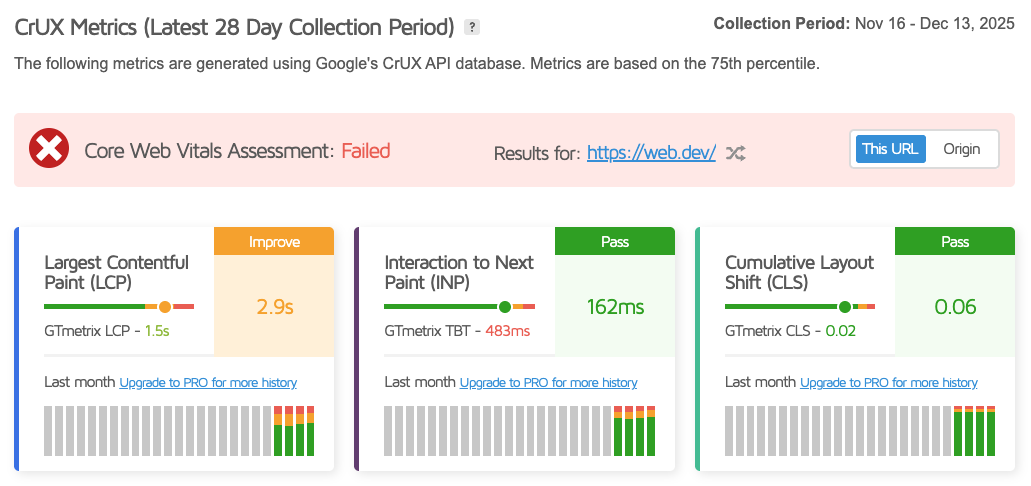
In addition to the lab-based tests, both GTmetrix and PageSpeed Insights also report real user metrics.
This data is equally reliable in both tools, because both use Google's Chrome User Experience Report (CrUX) as the data source.
GTmetrix vs. WebPageTest
WebPageTest is another popular web performance testing tool. It also provides reliable data collection by applying packet-level throttling to the network connection when loading the page.
WebPageTest is a more advanced tool than GTmetrix, surfacing more performance metrics and detailed debug data. For example, WebPageTest can show you:
- What requests are render-blocking
- When data chunks arrive for different response bodies
- How different server connections are used throughout the page load process
- How much CPU processing time is spent on layout calculations or script evaluation
Unlike GTmetrix, WebPageTest is focused on running one-off performance tests. However, you can monitor performance metrics over time using Catchpoint's monitoring solution.
The free DebugBear website speed test is a more modern alternative to GTmetrix or WebPageTest. It provides reliable performance metrics, shows how the user experiences the page load, and suggests high-impact optimizations.
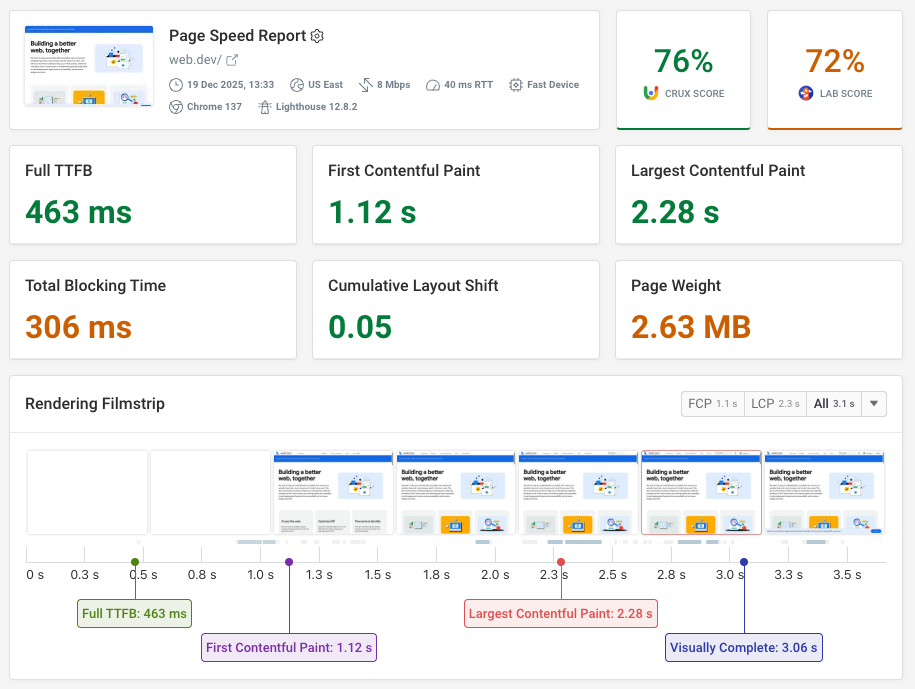
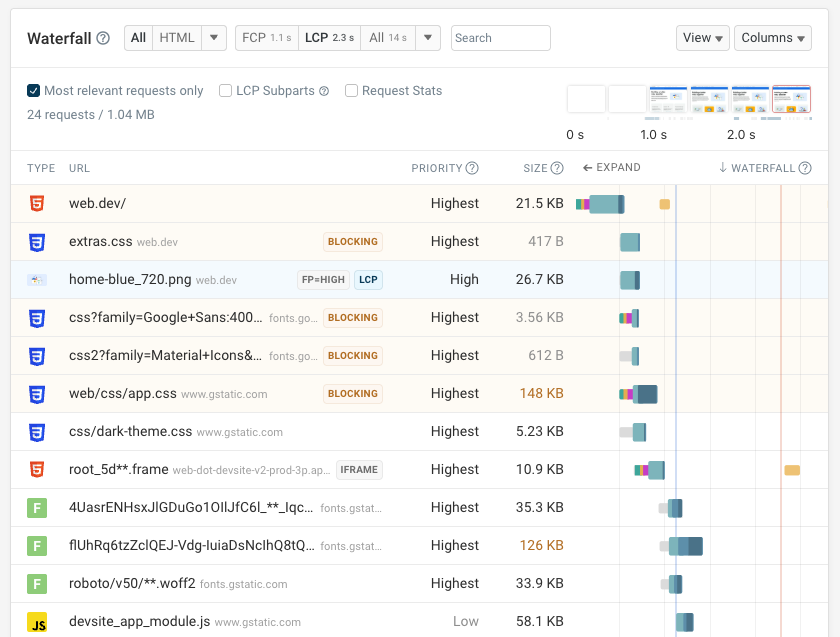
The DebugBear waterfall view shows the role of each resource for the rendering process and lets you see how resource load times determine what the user can see at each point in time.
GTmetrix vs. Pingdom
Pingdom is another web performance tool, built on the YSlow tool. GTmetrix was also built on top of YSlow before switching to Lighthouse.
YSlow is older than Lighthouse and no longer actively maintained. Lighthouse also supports more modern web performance metrics that focus on user experience rather than technical page load milestones.
The free Pingdom speed test does not apply any network throttling by default. That means the metrics it reports will be lower than in other tools like GTmetrix or PageSpeed Insights, because the page is loaded on a fast network connection in a data center.
Like GTmetrix, Pingdom offers ongoing synthetic monitoring. It provides a more comprehensive monitoring platform that also includes uptime checks and real user monitoring.
Using DebugBear as a powerful alternative to GTmetrix and PageSpeed Insights
DebugBear is a modern web performance monitoring tool with a focus on Core Web Vitals and user experience. You can run synthetic performance tests or collect real user analytics to gain in-depth insights into how your website performs.
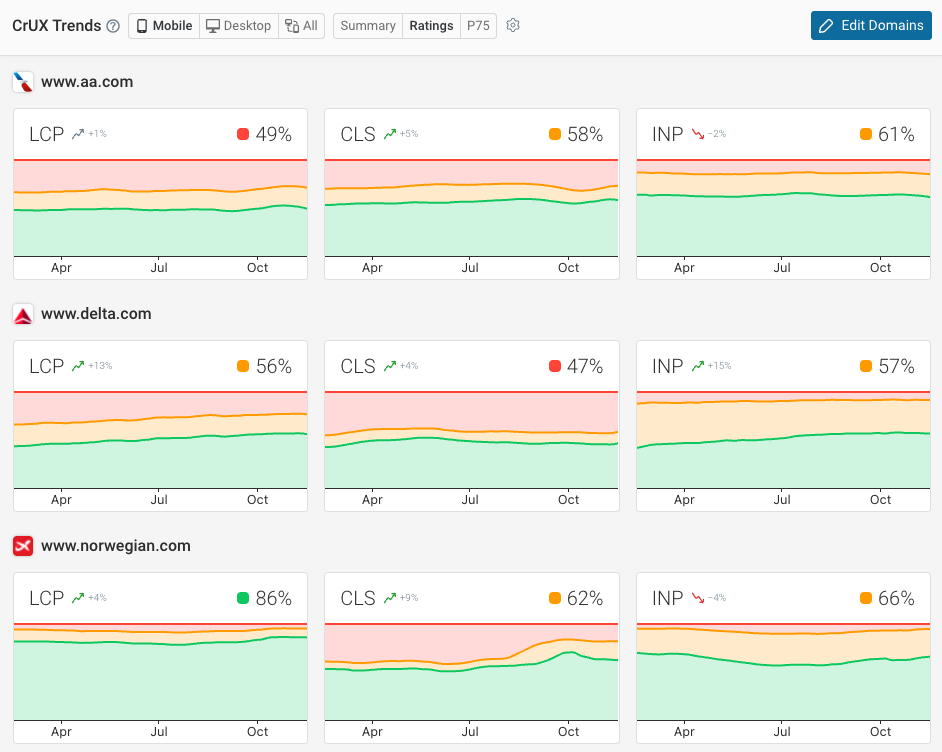
It also makes it easy to benchmark your website against competitors to see how you compare in your industry.


Monitor Page Speed & Core Web Vitals
DebugBear monitoring includes:
- In-depth Page Speed Reports
- Automated Recommendations
- Real User Analytics Data