
Dynatrace is an observability platform that lets you monitor and analyze real user performance. This guide explains how to set up Dynatrace real user monitoring and how to use it for performance debugging.
What is Dynatrace RUM?
Dynatrace real user monitoring lets you track user experience data for real visitors on your website. For example, you can track web performance metrics, page errors, or view network requests for specific page views.
RUM works by installing a JavaScript snippet on your website. This snippet collects metrics and debug data about the visit and sends it to Dynatrace for processing and analysis.
Many different real user monitoring tools are available on the market, each with a different focus. Some focus on performance metrics, others on user behavior analytics, and others on error tracking.
How to set up real user monitoring with Dynatrace
To set up real user monitoring, open the Experience Vitals tab in your dashboard. Here you need to add a frontend - the part of your application that's facing the user.
Dynatrace supports RUM for websites and mobile apps. Here we'll select "Web" as part of the setup process.
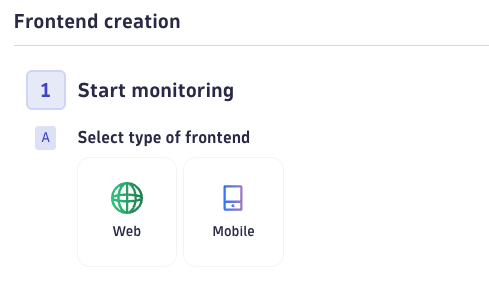
Enter a name for the frontend and then click on the "Next" button.
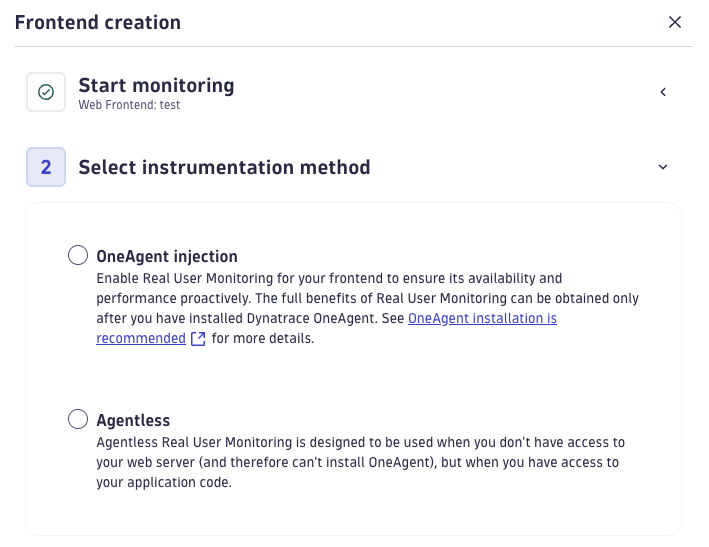
The next step is selecting the instrumentation method. That's how your data will be collected. There are two options:
- OneAgent Injection: Use this if OneAgent is already configured on your web server
- Agentless: Add a JavaScript snippet to the page or add it to a tag manager
In this example I'll go with the Agentless option.
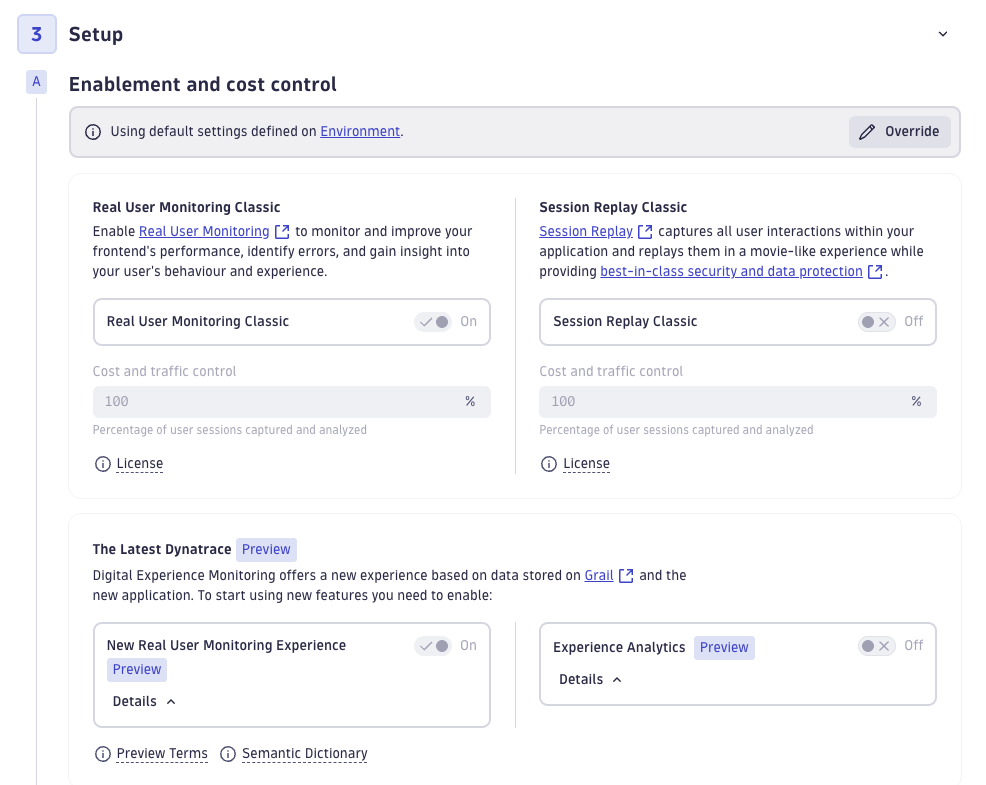
After moving to the next step, Dynatrace shows a bunch of optional configuration options:
- Do you want to track all page views or just a sample?
- Do you want to enable Session Replay or Experience Analytics?
- What privacy settings should the RUM code use?
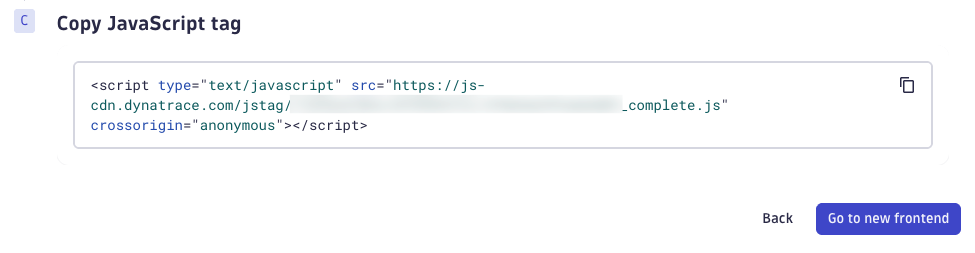
Once that's complete, Dynatrace provides the JavaScript snippet that you need to add to your website.
After installation, click on "Go to new frontend" and select "Analyze performance" to see what visitor data has been collected.
Use Dynatrace RUM data for performance debugging
Dynatrace RUM prominently features the Core Web Vitals metrics that Google developed to assess user experience on the web:
- Largest Contentful Paint (LCP): how fast does the page load?
- Cumulative Layout Shift (CLS): is the page visually stable?
- Interaction to Next Paint (INP): how quickly does the page respond to user input?
You can see this data broken down by page URL.
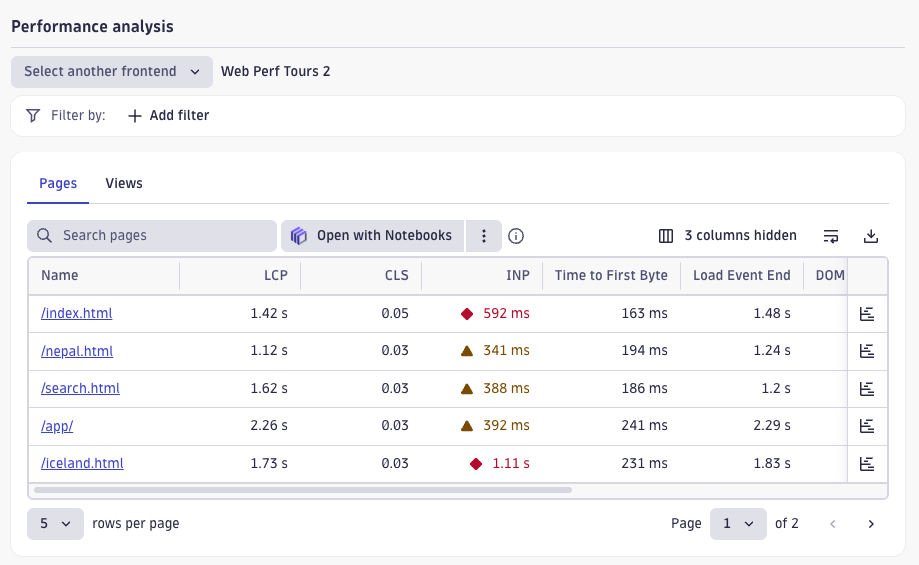
Dynatrace also prominently highlights 6 other metrics:
- Time to First Byte (TTFB): how long does it take for the server to respond?
- Load Event: when does the page load event fire, indicating a full initial page load?
- DOM Interactive: how long does it take for the HTML parser to reach the end of the page?
- Error rate: how many page errors occur per minute?
- Average foreground time: how long the user stayed on the page, excluding time when the page was in a background tab or window
- Page visit rate: how often is the page loaded per minute?
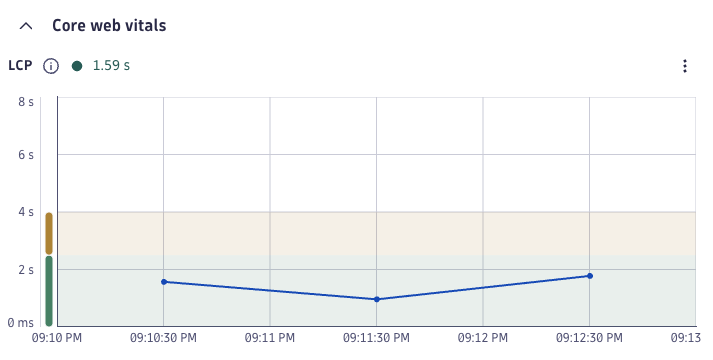
The Dynatrace RUM dashboard also lets you track how these metrics have changed over time.
Waterfall analysis
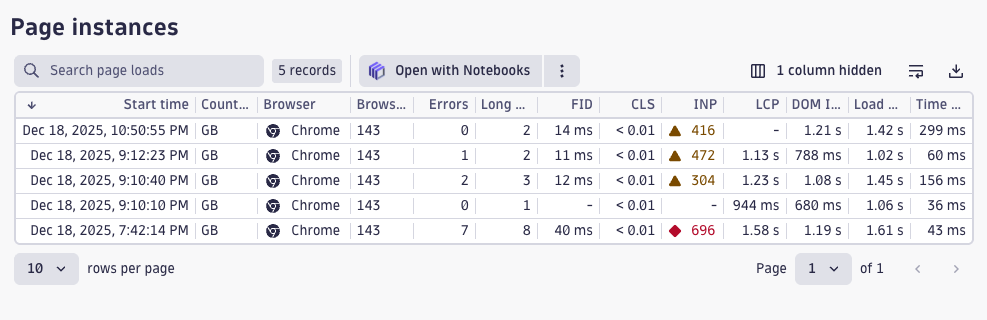
After selecting a particular page URL, the "Perform waterfall analysis" option becomes available. A request waterfall can tell you when different resources on the page are loaded.

This then takes you to a list of specific page instances: unique visits to each page.
Click on one visit to inspect the full request waterfall view.
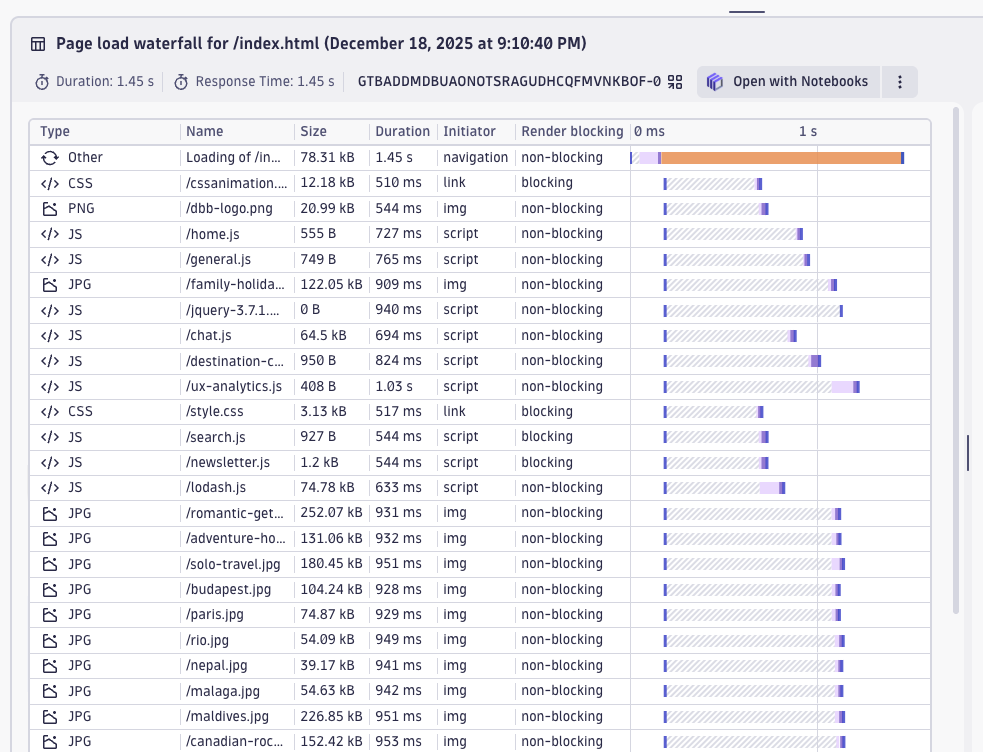
The waterfall lists the network requests made on the page and shows key details about each one:
- Type: is it an HTML document, a script, or an image?
- Name: the URL of the resource
- Size: the transfer size of the resource
- Duration: the total duration of the request
- Initiator: was the resource loaded because of the initial navigation, or because of a specific HTML tag?
- Render-blocking: is the resource required before the page can start rendering content?
Finally, you have the actual waterfall column on the right: this shows when the request started and finished, and how long each phase of the resource loading process took.
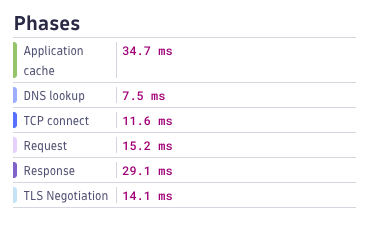
You can also click on each request to view additional details. For example, you can see a breakdown of the different loading phases:
- Application cache lookup: checking if the resource is available in the cache
- DNS lookup: looking up the IP address based on the domain name
- TCP connect: time spent establishing a reliable server connection
- Request: Time to First Byte of the response body
- Response: download time for the response content
- TLS negotiation: time spent establishing a secure connection
Break down and debug web vitals metrics
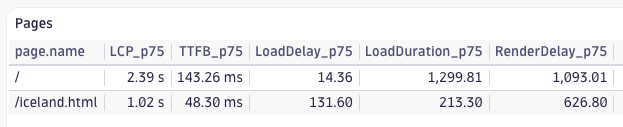
LCP subparts data can tell you how much time was spent on each phase of loading the Largest Contentful Paint element. In Dynatrace, you can set up custom dashboards to find out what's causing delays.
To view the subparts data, create a new dashboard and run this DQL query.
fetch user.events
| filter characteristics.has_page_summary == true
| filter lcp.status == "reported"
| summarize
    LCP_p75          = percentile(web_vitals.largest_contentful_paint, 75),
    TTFB_p75         = percentile(web_vitals.time_to_first_byte, 75),
    LoadDelay_p75    = percentile(lcp.resource.load_delay, 75),
    LoadDuration_p75 = percentile(lcp.resource.load_duration, 75),
    RenderDelay_p75  = percentile(lcp.ui_element.render_delay, 75),
    by: { page.name }
| sort LCP_p75 desc
This will show you the 75th percentile LCP score for each page.
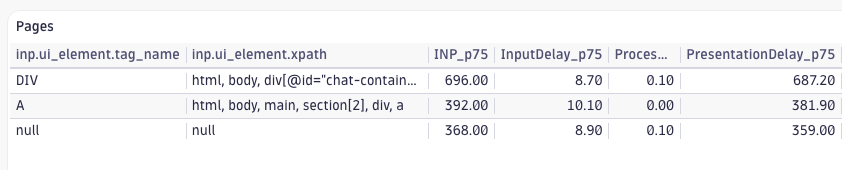
To view INP subparts and see what element was responsible for a slow interaction, you can use this query:
fetch user.events
| filter characteristics.has_page_summary == true
| filter inp.status == "reported"
| fieldsAdd
    input_delay         = inp.processing_start - inp.start_time,
    processing_time     = inp.processing_end - inp.processing_start,
    presentation_delay  = inp.duration
                        - (inp.processing_end - inp.processing_start)
                        - (inp.processing_start - inp.start_time)
| summarize
    INP_p75               = percentile(inp.duration, 75),
    InputDelay_p75        = percentile(input_delay, 75),
    ProcessingTime_p75    = percentile(processing_time, 75),
    PresentationDelay_p75 = percentile(presentation_delay, 75),
    interactions          = count(),
    by: { inp.ui_element.tag_name, inp.ui_element.xpath }
| sort INP_p75 desc
Website error monitoring with Dynatrace
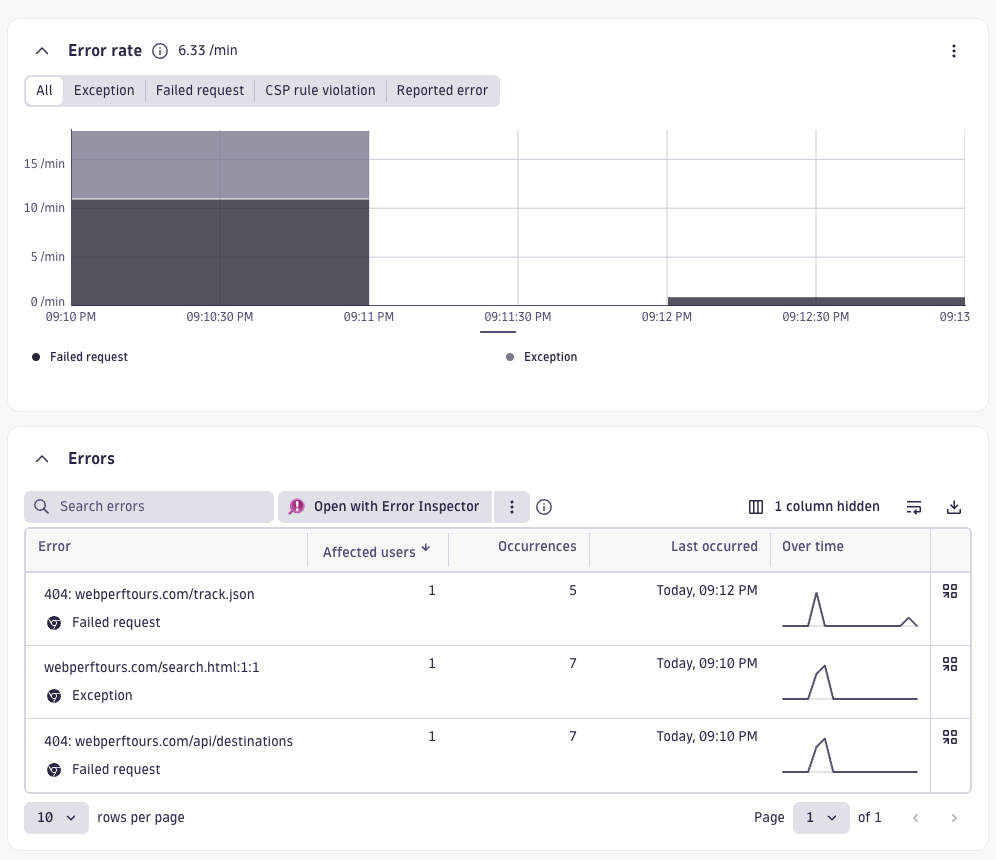
In addition to tracking performance metrics, Dynatrace also collects page errors like JavaScript exceptions or failed network requests.
You can debug each error in detail to see how often it happens, what page it occurs on, or which browsers or operating systems are impacted.
Making Core Web Vitals analysis easy
Dynatrace RUM provides a real user monitoring solution that's tightly integrated with their overall observability platform. You can track Core Web Vitals metrics and identify network requests that are slowing down your website.
However, it can sometimes be difficult to find the data you need. And, if you have trouble with INP scores, Dynatrace does not report data on Long Animation Frames that can tell you what scripts are delaying interactions.
If Core Web Vitals optimization is a priority for you, consider a specialized web performance tool like DebugBear.
You can easily get an overview of your overall website performance and identify specific pages that are having problems. From there you can deep-dive into specific performance metrics to see what's causing poor scores.

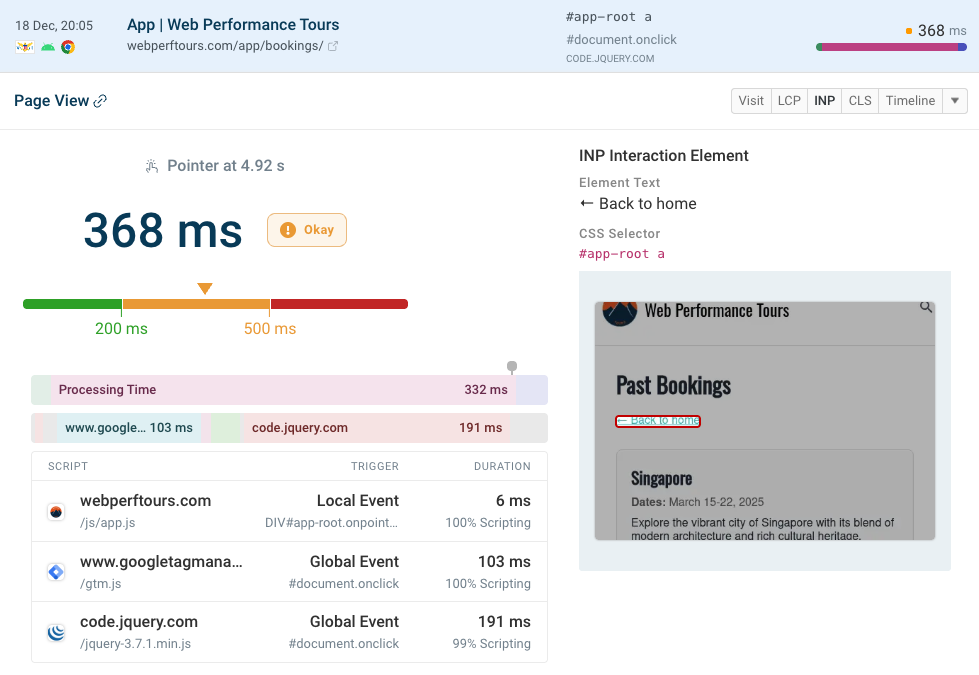
For example, for the INP metric, DebugBear shows a breakdown into different components and highlights specific scripts that run during an interaction, slowing it down.
You can also see how often experiences are delayed when interacting with different page elements.

Review specific page views to view in-depth details on the user's device (like browser, screen size, and the amount of device memory available).
You can also see when the user interacted with a specific page element. Where possible, the element is highlighted in a screenshot.
Different scripts run during different phases of handling the interaction, and contribute to the overall INP score.
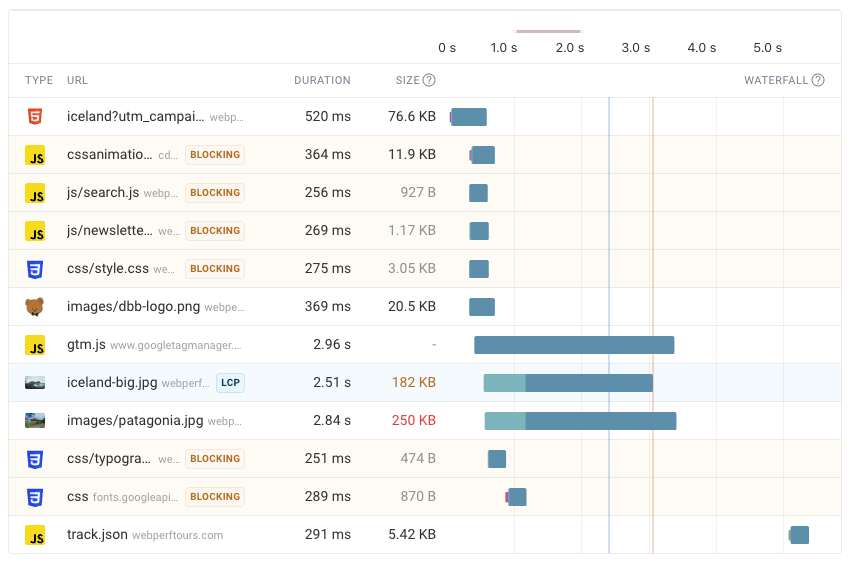
The request waterfall highlights key network requests that impacted performance, as well as other factors affecting load time:
- What request was required to load the LCP image?
- Did slow CPU tasks impact page speed?
- When did the First Contentful Paint and Largest Contentful Paint occur?
DebugBear also supports a number of other features, like conversion tracking, advanced alert criteria, and visitor segmentation.
You can also combine RUM metrics with synthetic tests and Google CrUX data, for comprehensive web performance coverage. Sign up for a free trial.


Monitor Page Speed & Core Web Vitals
DebugBear monitoring includes:
- In-depth Page Speed Reports
- Automated Recommendations
- Real User Analytics Data