
The Uptrends website speed test is a free tool that helps you analyze the page load performance of your website. This guide explains how to run tests and interpret the results.
What is the Uptrends website speed test?
The Uptrends web performance test lets you see how quickly your website loads from different locations around the world. It provides a detailed report with performance metrics and a request waterfall visualization.
Uptrends is based on the open-source Lighthouse tool that also powers PageSpeed Insights. However, it complements the Lighthouse report with custom reporting and analysis.
How to test your website with Uptrends
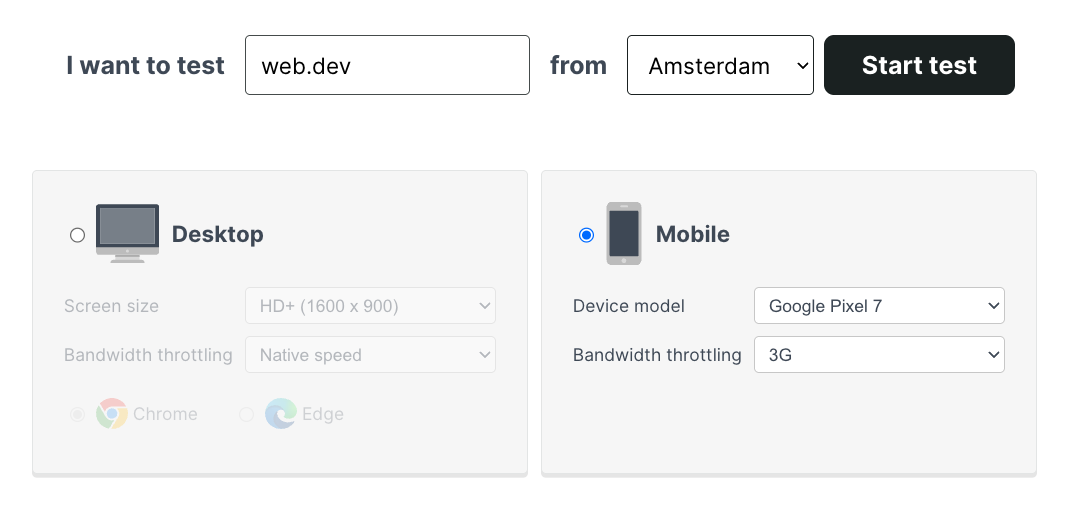
To test your website, open the free Uptrends speed test and enter your website URL.
Decide if you want to run the test from a mobile or desktop device, pick a test location, and select a throttled network speed to make sure your metrics reflect real user conditions rather than a fast server environment.
Uptrends also lets you configure a custom screen size and pick either Chrome or Edge as the test browser. Click "Start Test" to run the performance analysis.
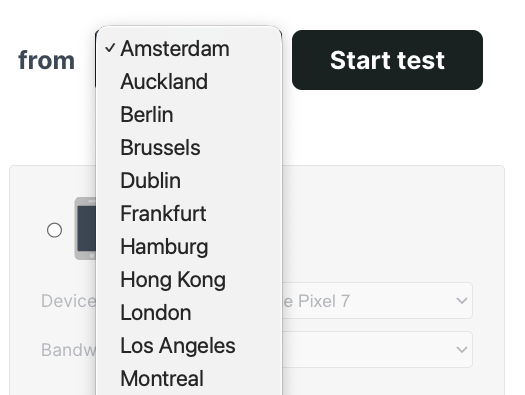
One strength of the Uptrends speed test is that it lets you run page speed tests from multiple global locations. Select one of 20 options from Amsterdam to Montreal or Vancouver.
Analyze the Uptrends speed test result
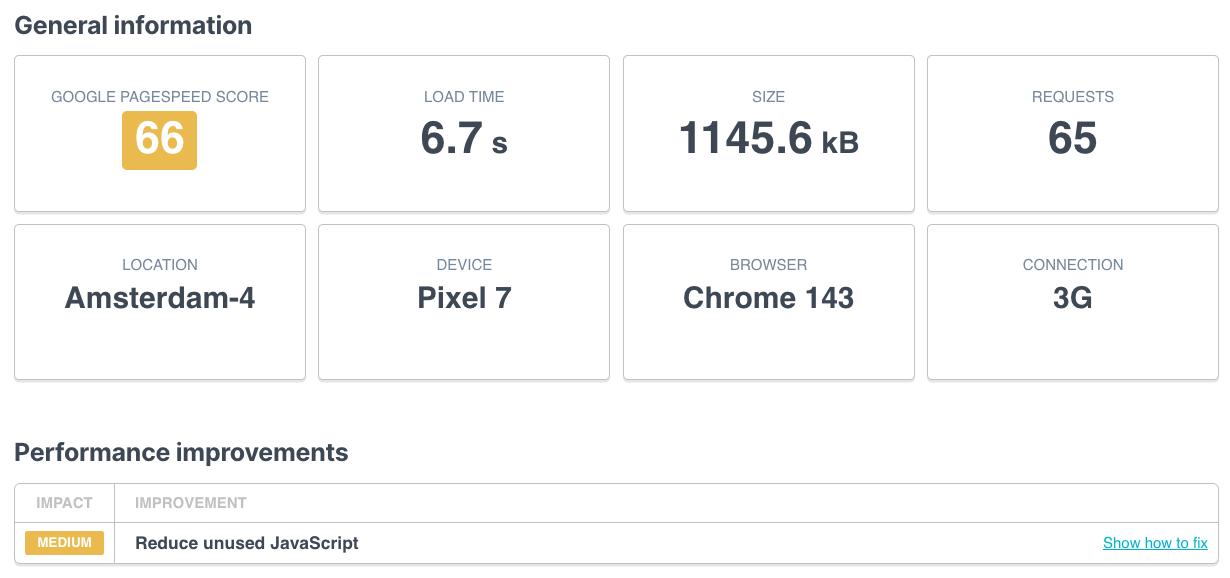
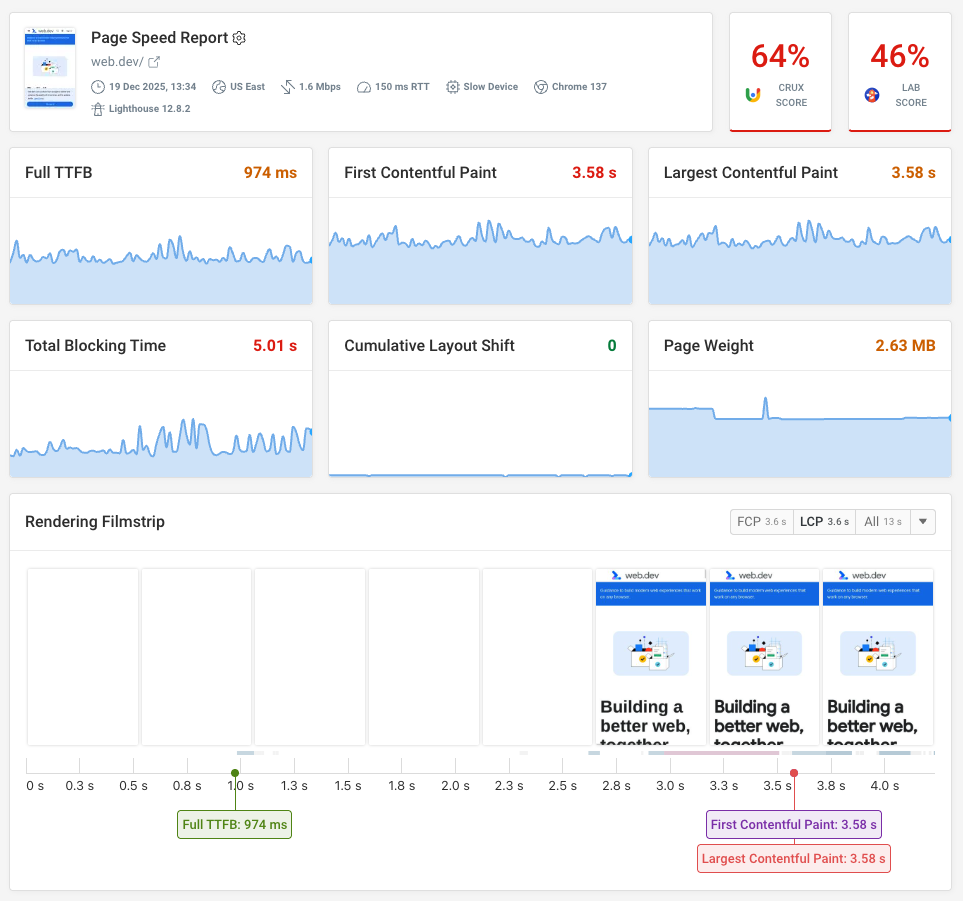
Once the test is complete, Uptrends shows you a summary of the test result, including the Lighthouse performance score, page load time, and page weight.
Uptrends also shows some of the performance opportunities identified by Lighthouse, in this case reducing unused JavaScript code.
Core Web Vitals and W3C Navigation Timings
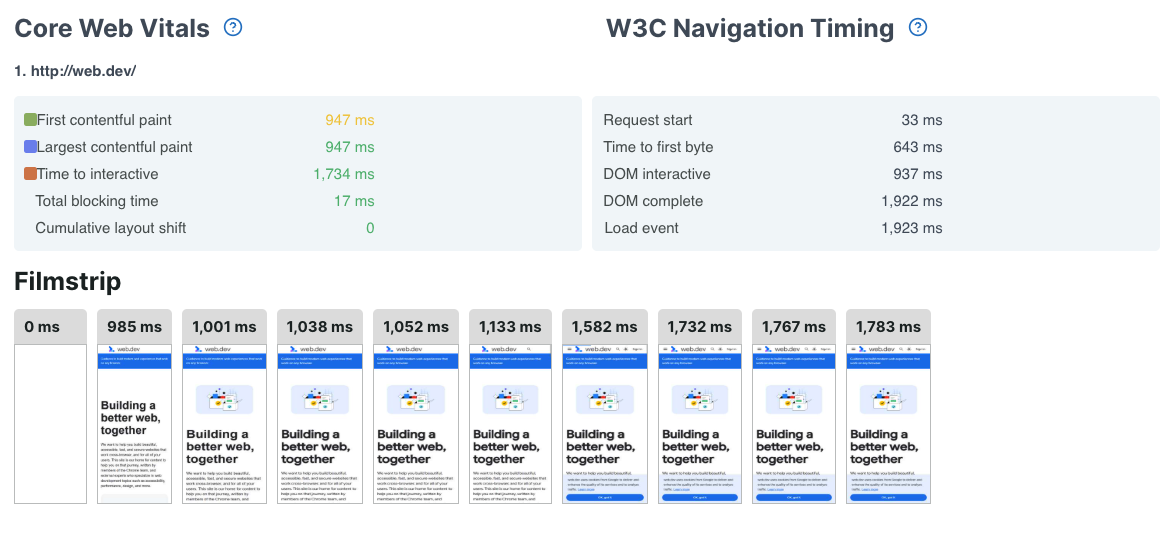
Uptrends also reports Core Web Vitals metrics like Largest Contentful Paint and Cumulative Layout Shift. These metrics help you understand visitor experience on your website.
Synthetic tests don't include interactions by default, so the Interaction to Next Paint metric cannot be measured. However, Uptrends reports the Total Blocking Time metric to highlight potential interaction delays during the page load process.
Uptrends also shows a set of W3C Navigation Timing metrics: these are older technical metrics that describe when different page load milestones occur. For example, you can measure Time to First Byte and the Load Event.
The filmstrip view visually shows each rendering stage.
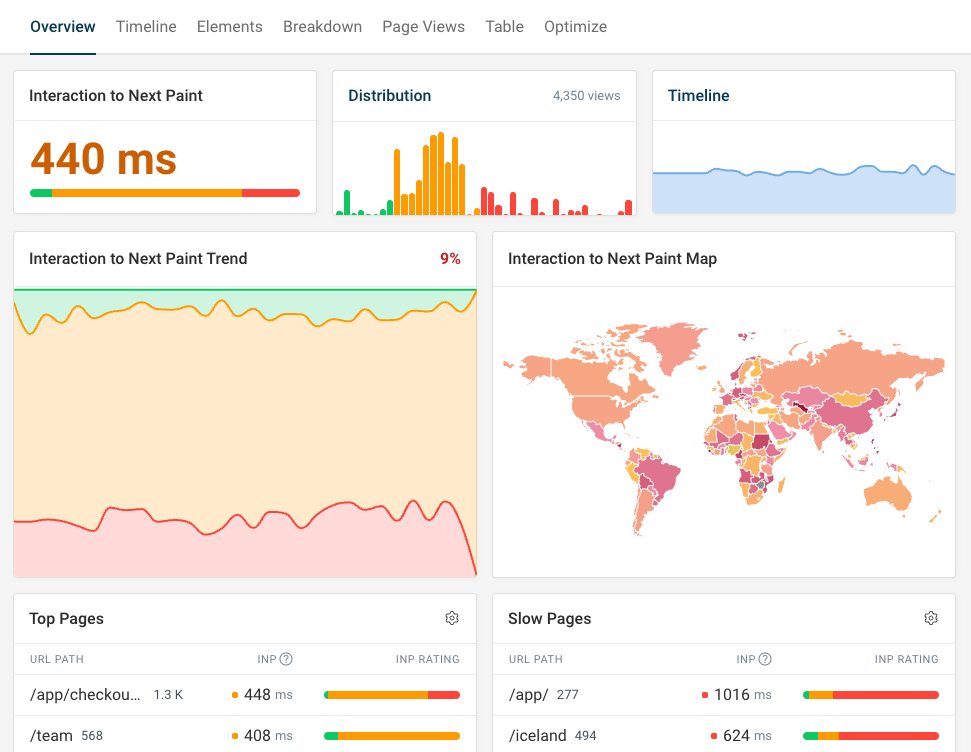
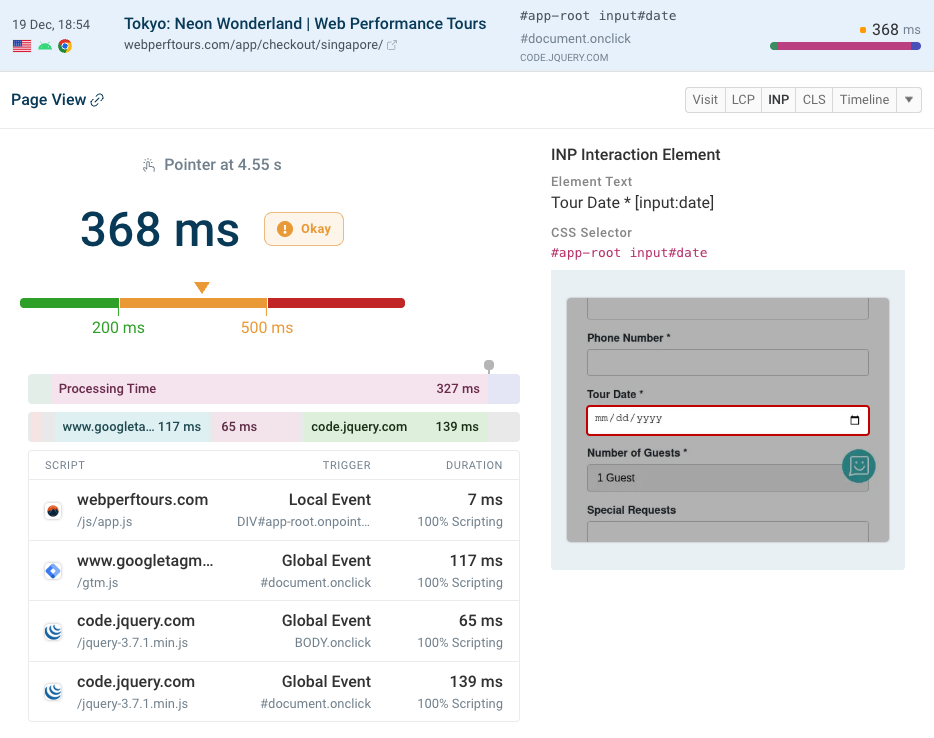
A real user monitoring tool can help track poor INP scores and see what page elements users interacted with.
Thanks to Chrome's Long Animation Frames API it's also possible to identify specific scripts that slowed down user interactions.
Request analysis and waterfall view
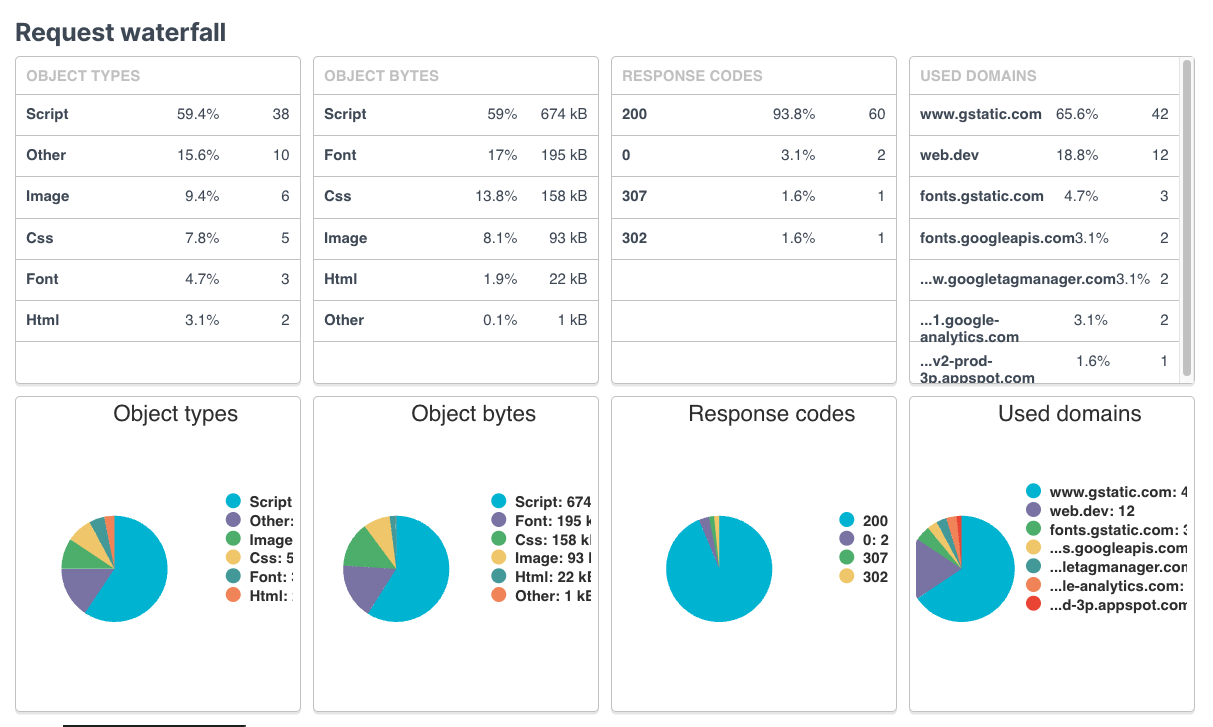
Uptrends provides detailed data of what resources were loaded on the tested page. You can break page weight down by resource type or domain name.
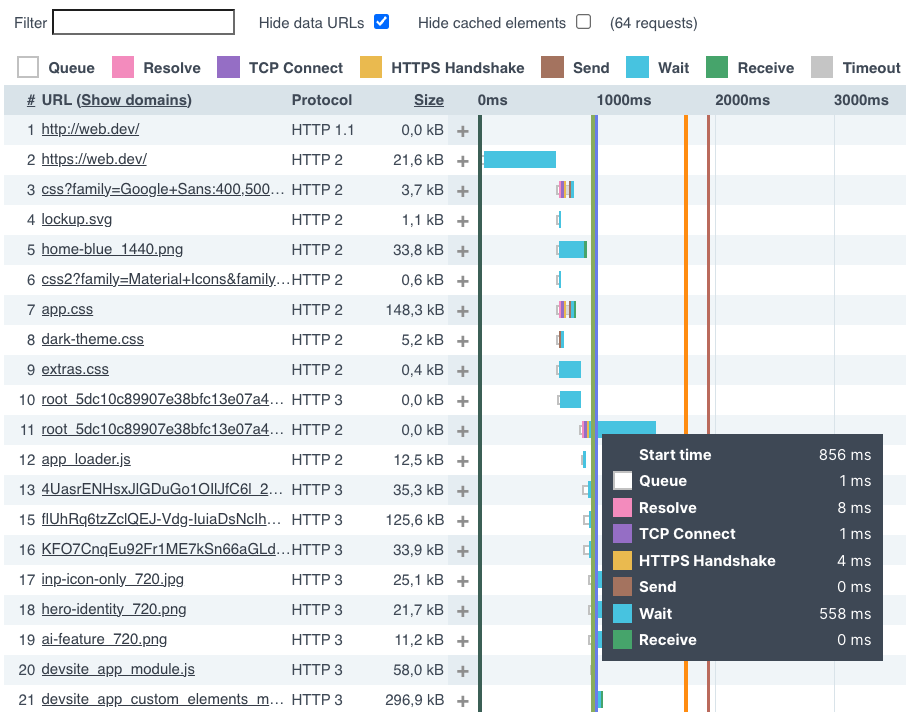
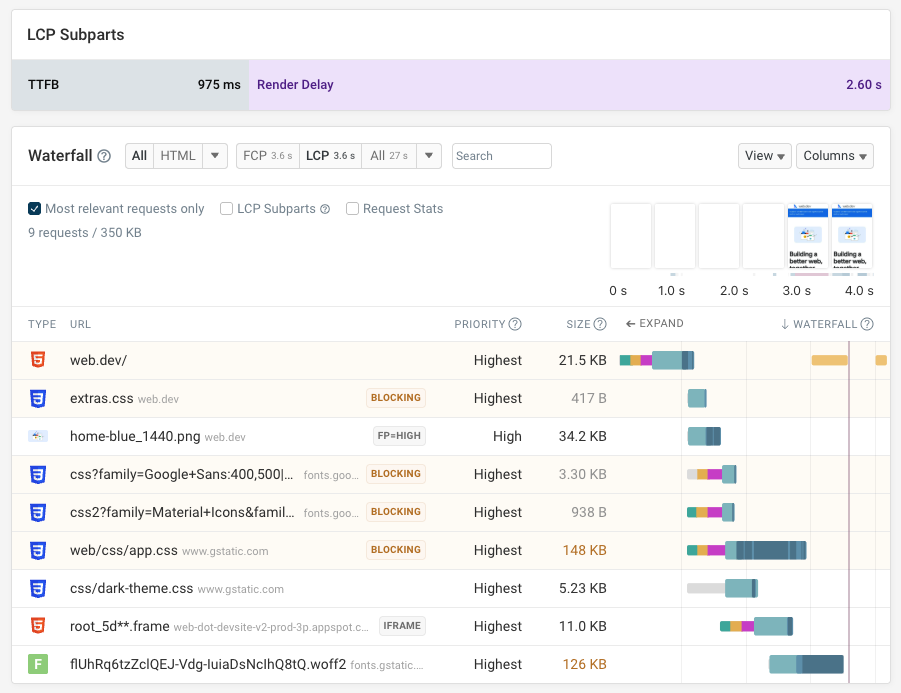
The request waterfall shows you the URL of each request and when the resource was loaded. The request waterfall also shows additional details:
- The protocol used for the connection
- The download size of each resource
- The request duration breakdown into DNS resolution, TCP connection time, HTTPS handshake, and other components
Uptrends also shows key page load milestones in the waterfall, for example First Contentful Paint and Time to Interactive.
You may notice that the Uptrends speed test shows resources loading quickly even on a slow connection. That's because the requests are not slowed down when the data is collected. Instead, Uptrends uses simulated throttling to calculate the Lighthouse Performance score.
Try the free DebugBear website speed test if you want to see a request waterfall with real throttling applied.
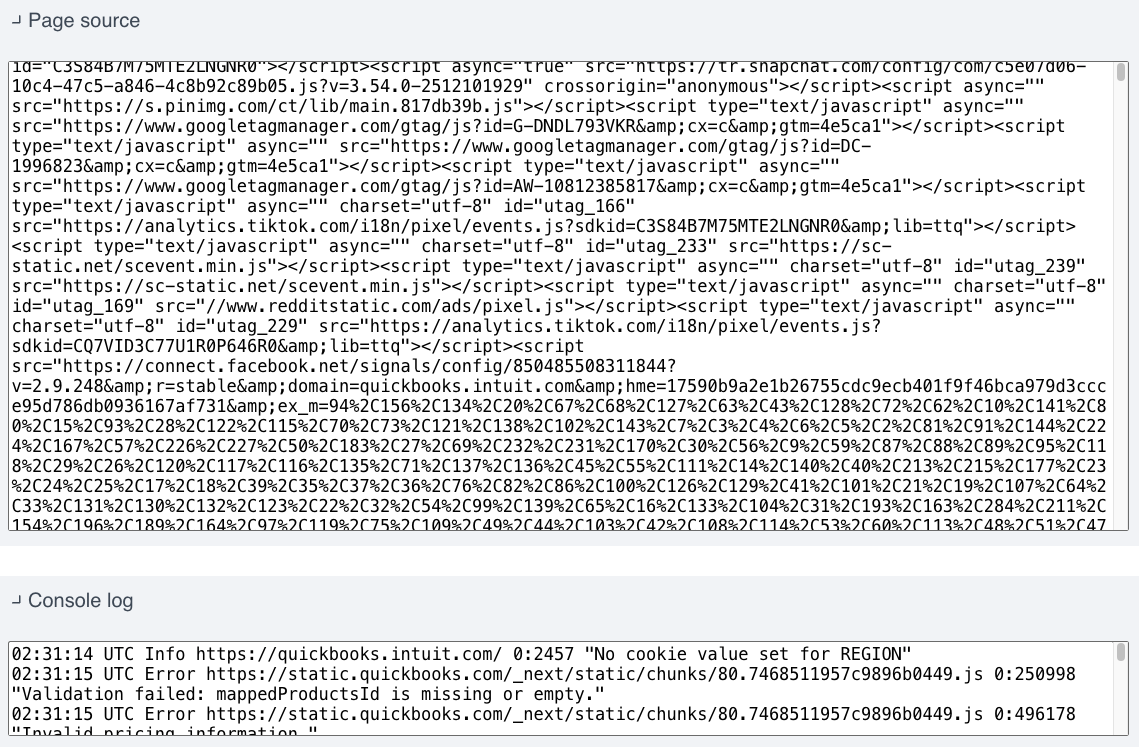
View page source and console logs
In addition to the performance reporting, Uptrends also shows you the source code for the HTML document as well as any console log messages that were emitted by the browser during the page load.
This can help you debug whether the page loaded correctly and check how different page resources are referenced in the HTML.
Get more advanced performance insights
DebugBear page speed testing can help you get a better understanding of your website performance and monitor Core Web Vitals and other metrics continuously.
On top of running on-demand tests, the DebugBear test result also includes real visitor data from Google's Chrome User Experience Report.
The request waterfall can help you investigate performance issues in more detail. All data is collected on a throttled connection to reflect real user conditions, using packet-level network throttling to provide reliable results.
Each test result includes a full Lighthouse report, as well as over 20 custom performance recommendations. Quickly measure the impact of optimizations with experiments so your development team can focus on the most important fixes. Sign up for a free trial.


Monitor Page Speed & Core Web Vitals
DebugBear monitoring includes:
- In-depth Page Speed Reports
- Automated Recommendations
- Real User Analytics Data