
Do you want to quickly identify performance or SEO issues across your entire website? The free Unlighthouse website scan can highlight these problems for you.
Auditing web pages with Lighthouse
Google Lighthouse is a free tool that analyzes the Performance, Accessibility and SEO of a web page.
You can use a free tool like PageSpeed Insights or the DebugBear Website Grader to analyze a URL on your website.
What is Unlighthouse?
Unlighthouse lets you run Lighthouse tests across your whole website instead of just for one page. It crawls your sitemap and internal links to build up a URL list, and then analyzes each page with Google's Lighthouse Node library.
You can then:
- View test results for each of your pages
- Sort audits to identify pages with poor performance
- View meta descriptions and open graph images
How to scan your website with Unlighthouse
Unlighthouse is written in JavaScript and uses the Node runtime. So you first need to download and install Node.js.
Once that's done you can install and run Unlighthouse by running a terminal command like this:
npx unlighthouse --site https://web.dev
What does this mean?
npxis a tool that's included in Node Package Manager and lets you quickly run programs published in the Node package registryunlighthouseis the name of the NPM module--siteis a command line option for passing a website URL to Unlighthousehttps://web.devis the website you want to scan: you'll need to put your own website URL here
After running this command you'll start seeing some console output in the terminal window.
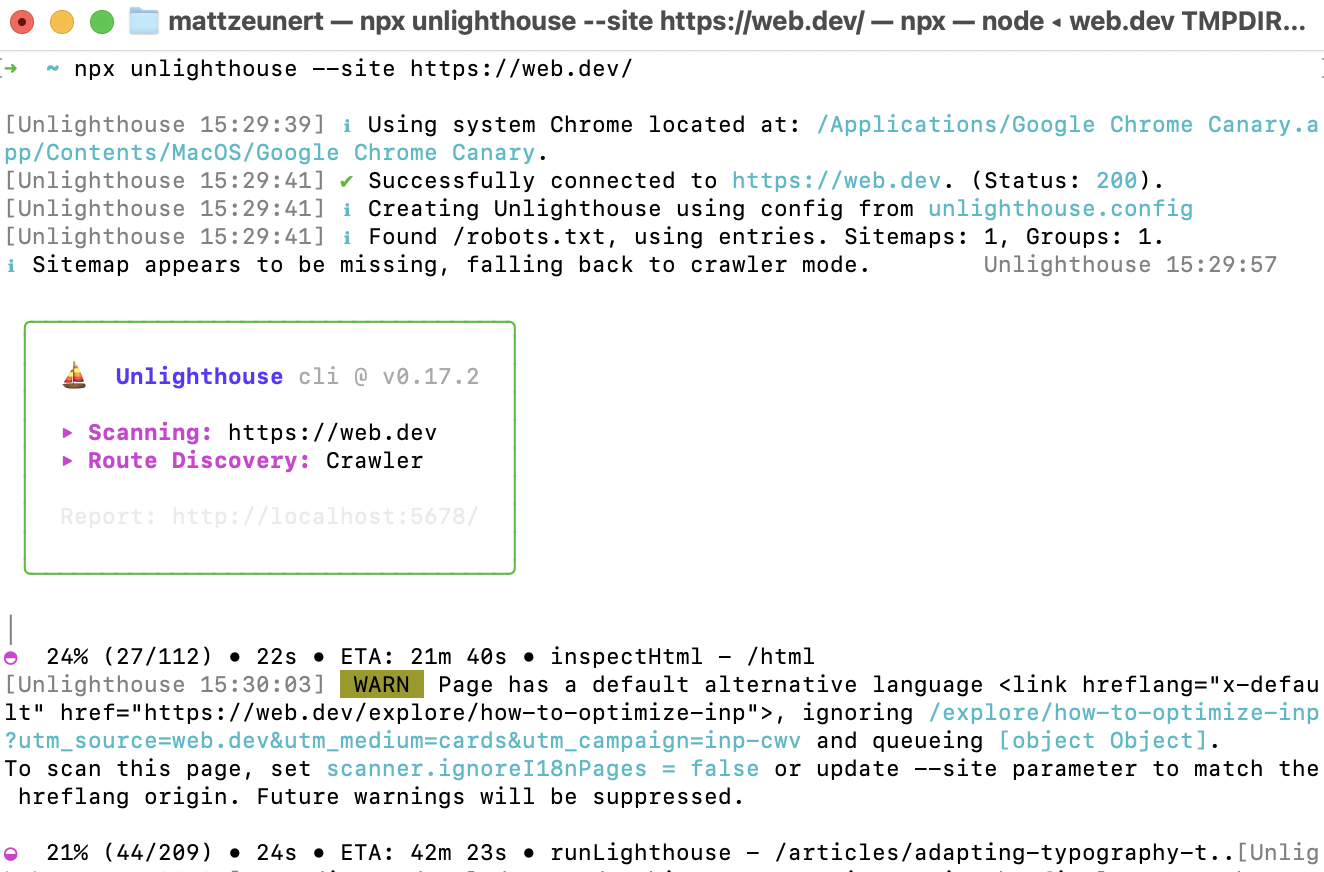
Once the scan is complete, Unlighthouse starts a local server on http://localhost:5678/ and opens this server URL in the browser. There you can see your scan results.
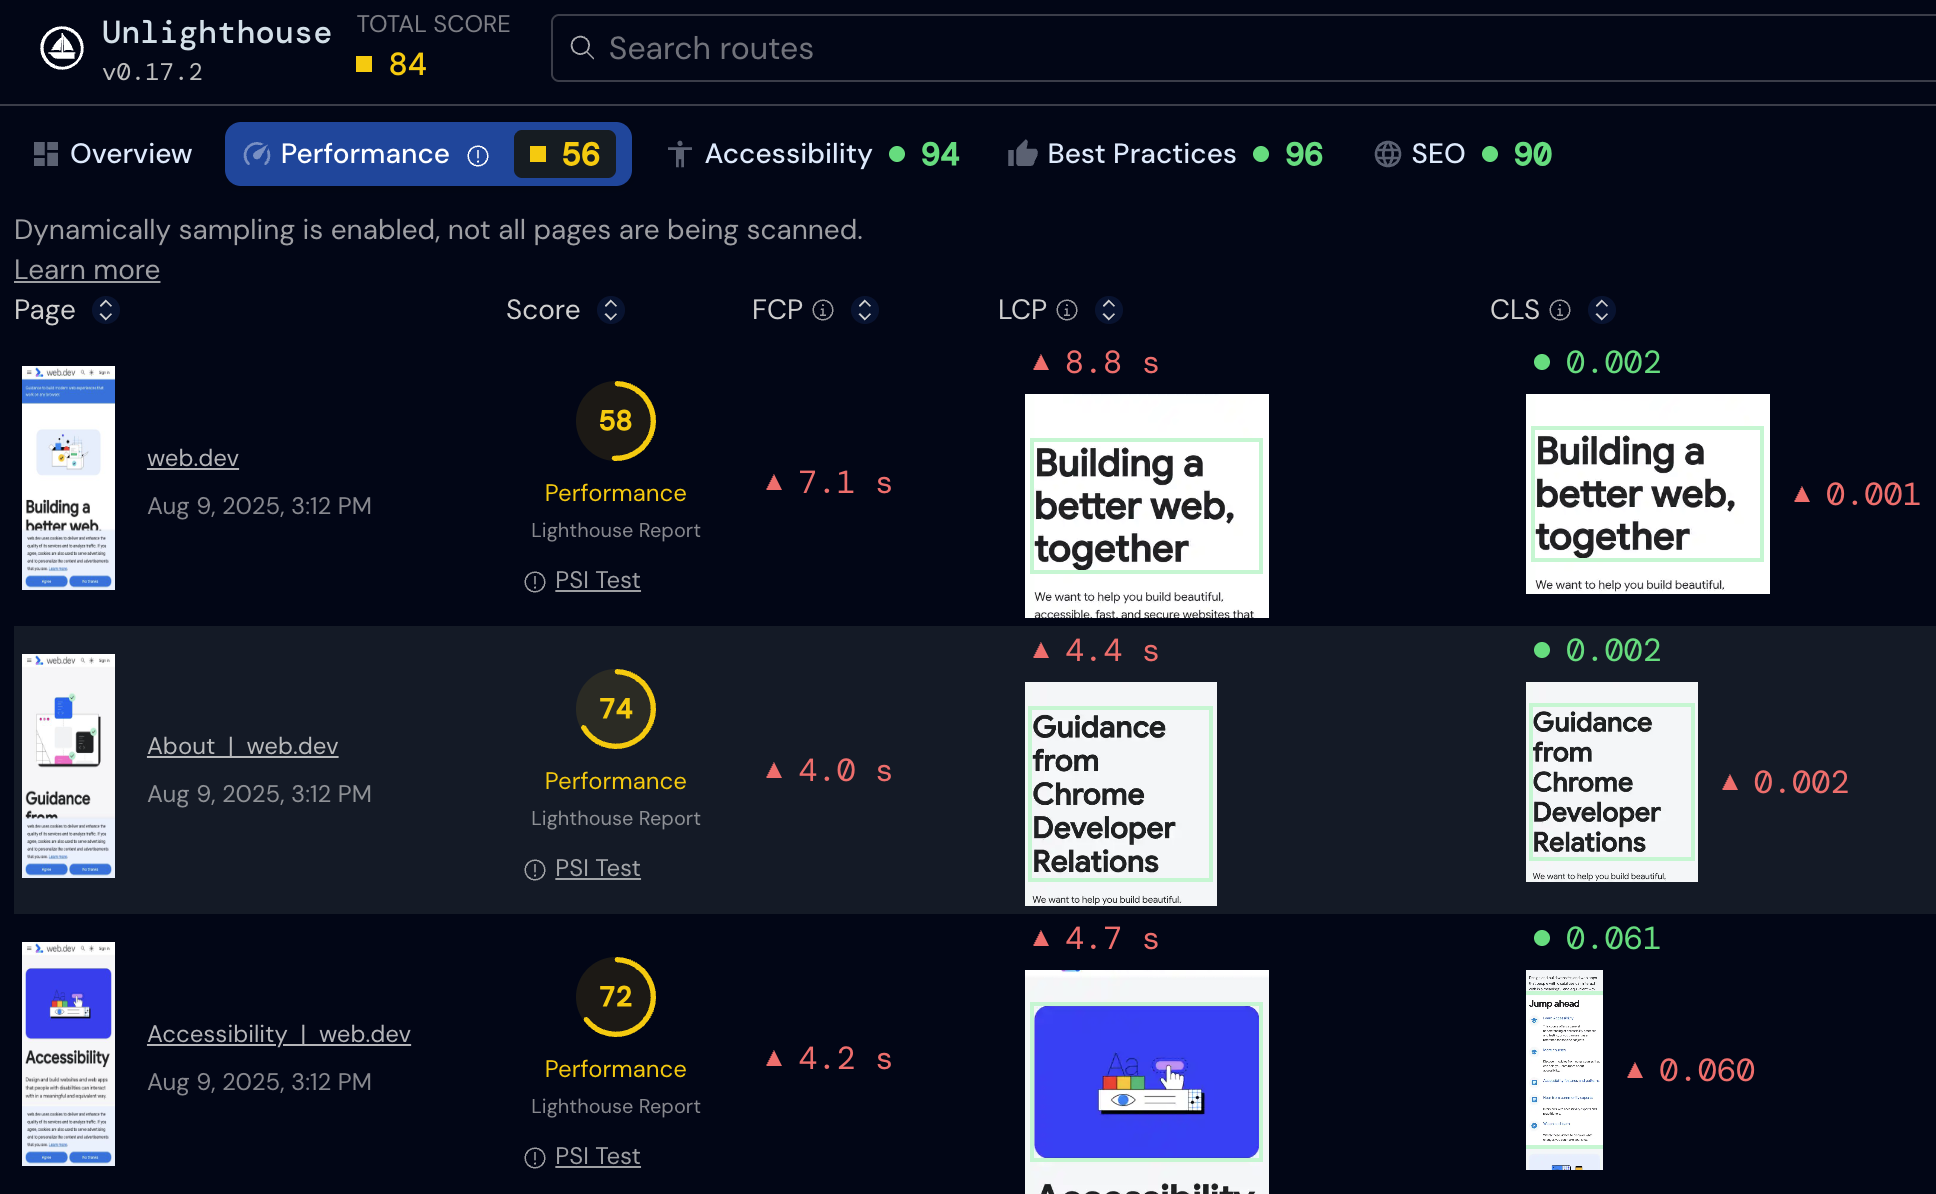
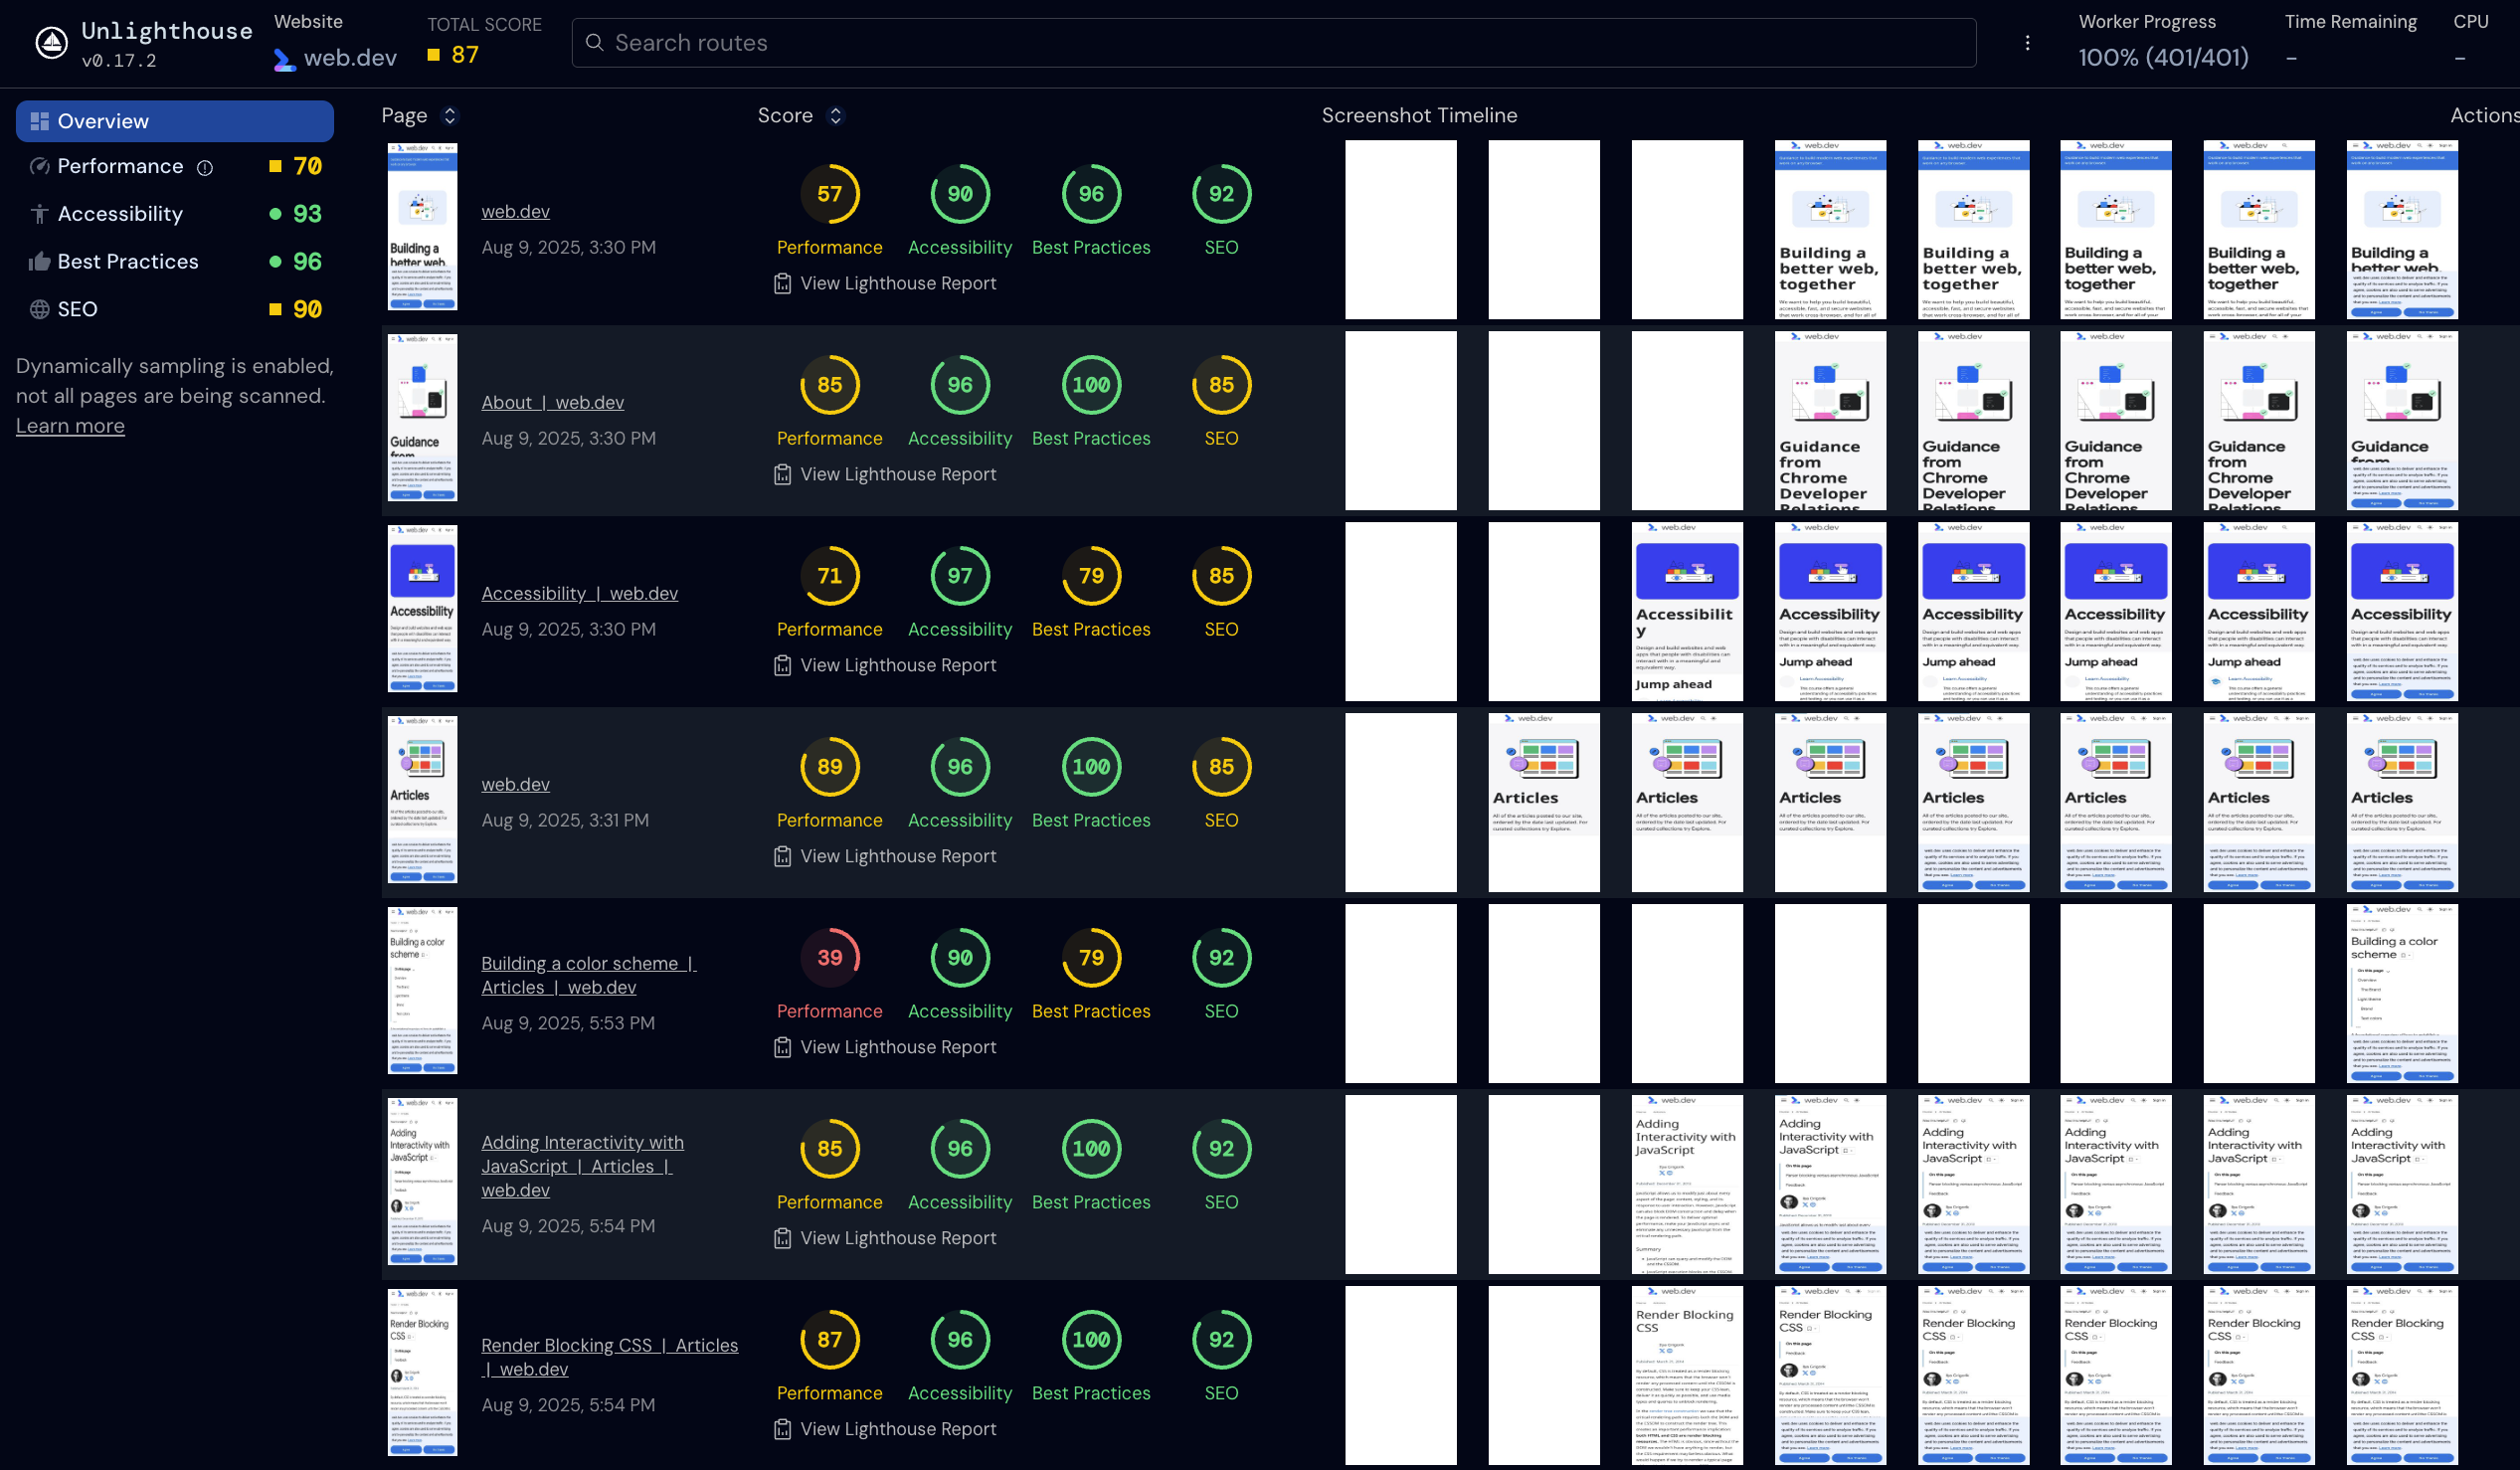
The Overview tab shows scores for the 4 Lighthouse audit categories: Performance, Accessibility, SEO, and Best Practices.
You can also see a comparison view of rendering filmstrips for the different pages that have been scanned.
Check the .unlighthouse directory to find the individual test result data including the Lighthouse Result JSON (LHR).
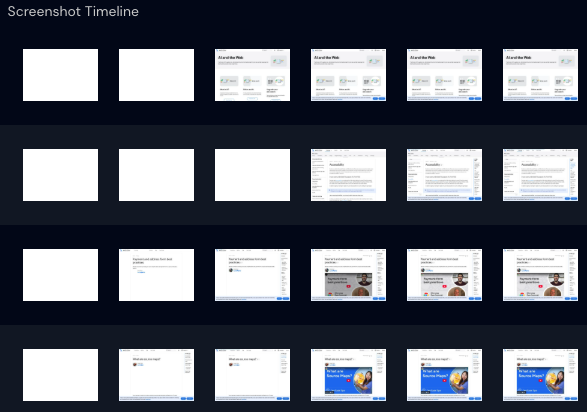
Filmstrip and video view
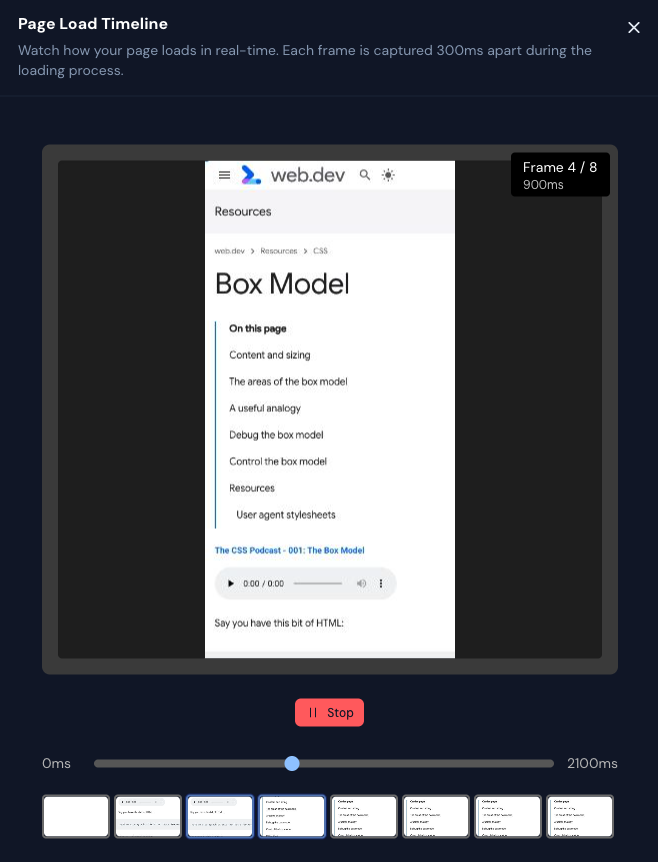
Click on the image on the left to view a full-size view of the final screenshot taken by Lighthouse.
You can also click on each filmstrip image to view a larger version, step through the page rendering process frame by frame, and even replay the page load process.
The rendering progress you see here will not match the metric scores that you see in the Lighthouse report. That's because Lighthouse uses simulated network throttling by default, where the throttling is applied after the page is loaded.
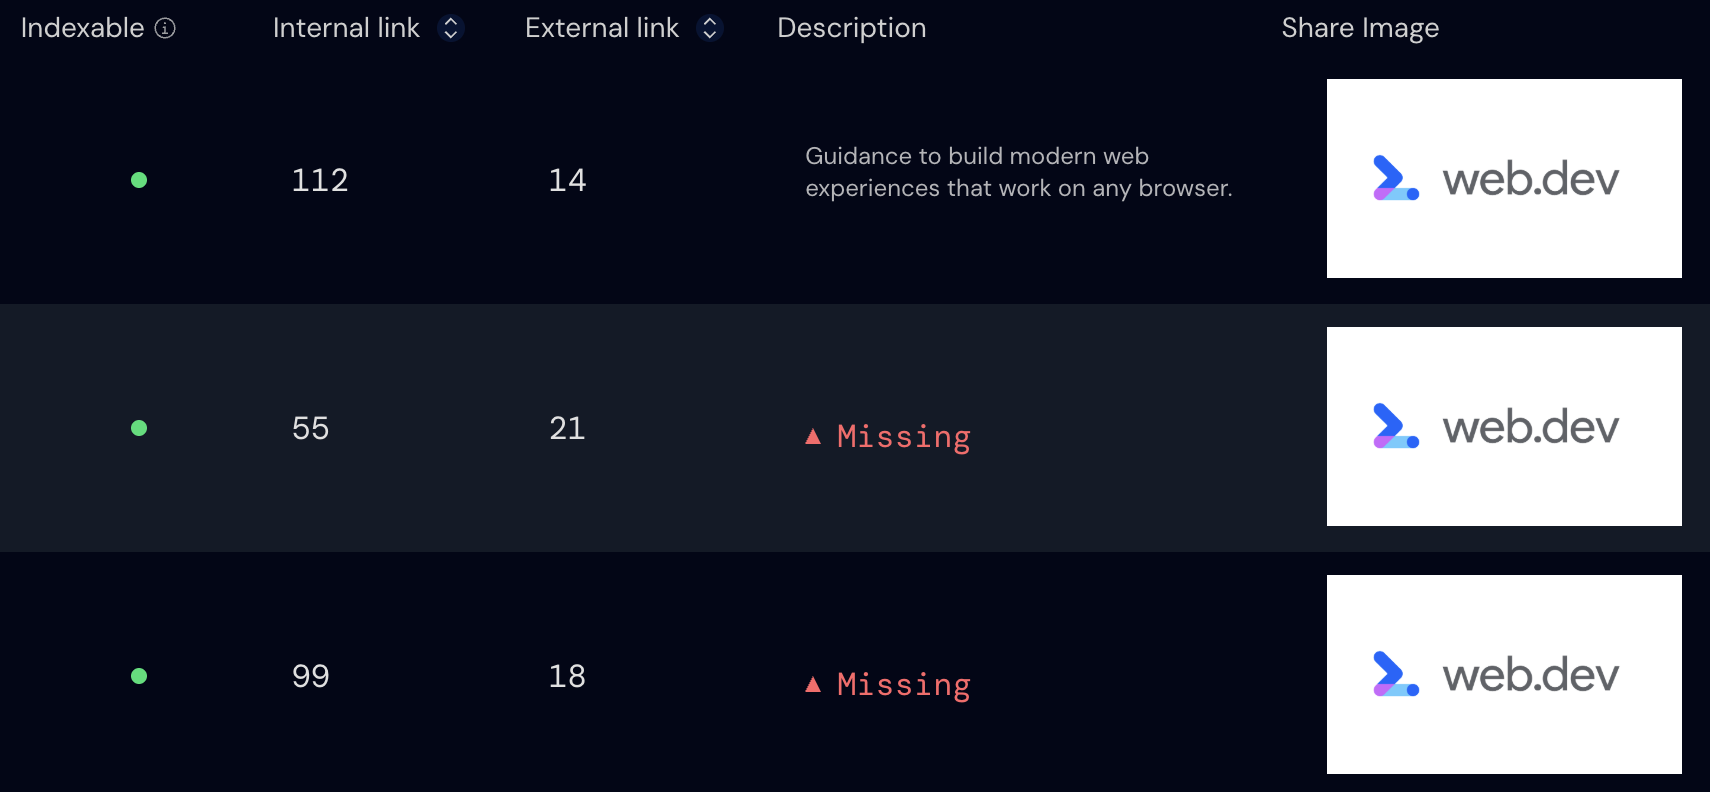
SEO view
The SEO view also provides some convenient search engine optimization info that goes beyond what Lighthouse provides:
- How many external and internal links are on the page
- The page meta description
- The Open Graph social sharing preview image
Testing desktop pages with Unlighthouse
By default, Unlighthouse uses an emulated mobile device to collect page data. To test desktop pages you can use add the --desktop flag to your CLI command.
npx unlighthouse --site https://web.dev --desktop
As you can see in the filmstrip, the pages are now opened in a larger window.
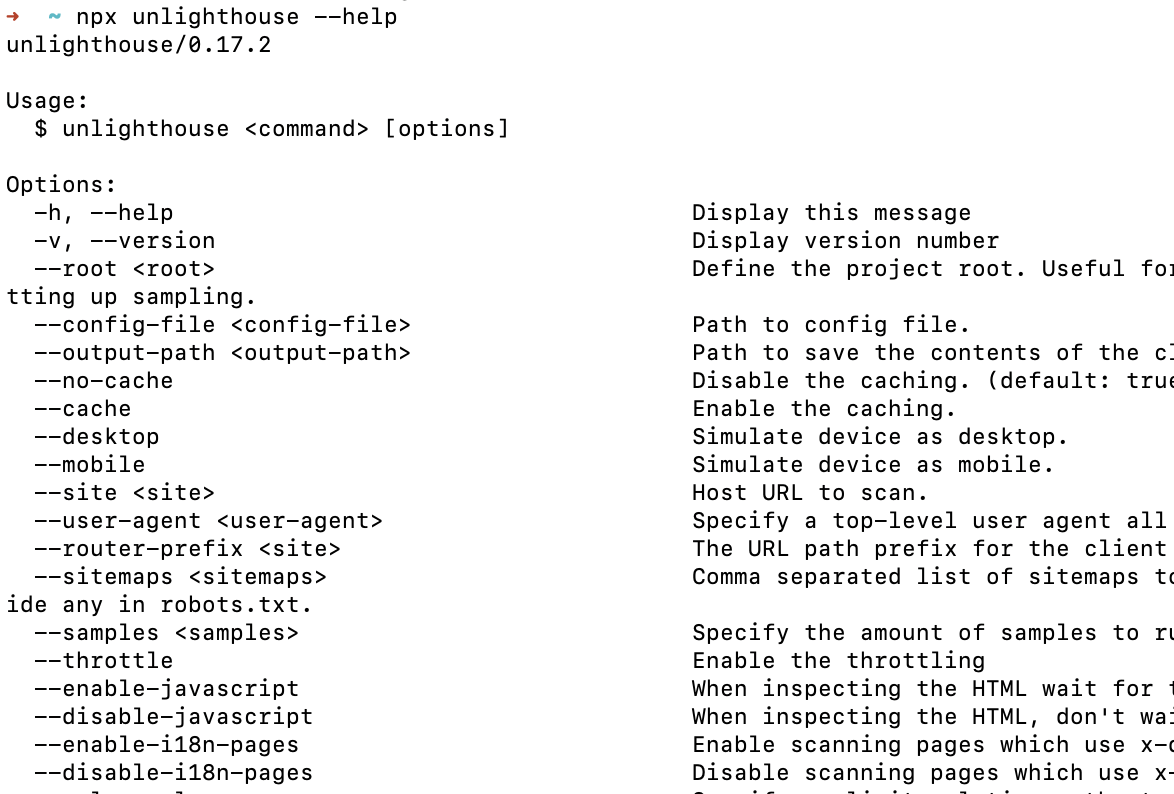
Other Unlighthouse configuration options
To view the full list of CLI options, run npx unlighthouse --help.
You can also create a unlighthouse.config.ts file to specify configuration options. For example, you can set a custom output path, limit how many routes should be scanned, and generate a log message for every test result.
import { defineUnlighthouseConfig } from "unlighthouse/config";

export default defineUnlighthouseConfig({
  site: "https://web.dev/",
  outputPath: "./scan-output",
  scanner: {
    maxRoutes: 50,
  },
  hooks: {
    "task-complete": function (path, info) {
      console.log(
        `Finished test for ${path}: Found ${info.seo?.internalLinks} internal links`,
      );
    },
  },
});
You'll then get test output like this:
Finished test for /blog/community-highlights/elisa: Found 55 internal links
Customize throttling options
As mentioned above, Lighthouse uses simulated throttling by default. It also uses custom throttling settings because running multiple tests in parallel will result in worse page load performance.
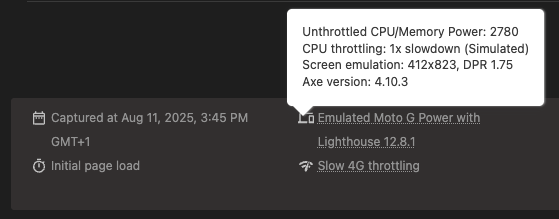
You can pass in custom Lighthouse settings through the lighthouseOptions key. Setting the throttlingMethod to provided tells Lighthouse that you'll throttle the network and CPU yourself, so no simulation from Lighthouse is required.
import { defineUnlighthouseConfig } from "unlighthouse/config";

export default defineUnlighthouseConfig({
  site: "https://web.dev/",
  puppeteerClusterOptions: {
    maxConcurrency: 1,
  },
  lighthouseOptions: {
    // Provide throttling externally from Lighthouse
    throttlingMethod: "provided",
  },
});
How to run regular Lighthouse website scans
You can use Unlighthouse to regularly check scores across your entire website. However, there are a few limitations you'll run into:
- You need to run the scan on your own computer
- The performance data is limited and not always reliable
- It's not easy to share results with team members
- You can't easily compare test results to each other
A website monitoring tool like DebugBear can make it easier to run regular performance tests on your website and get alerted when new problems arise.
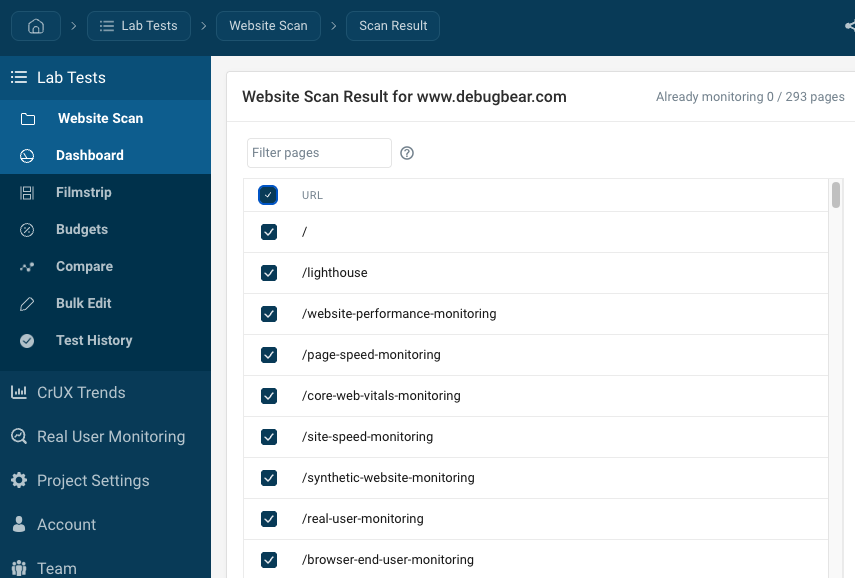
You can use the website scan feature to identify pages to monitor based on your website sitemap.
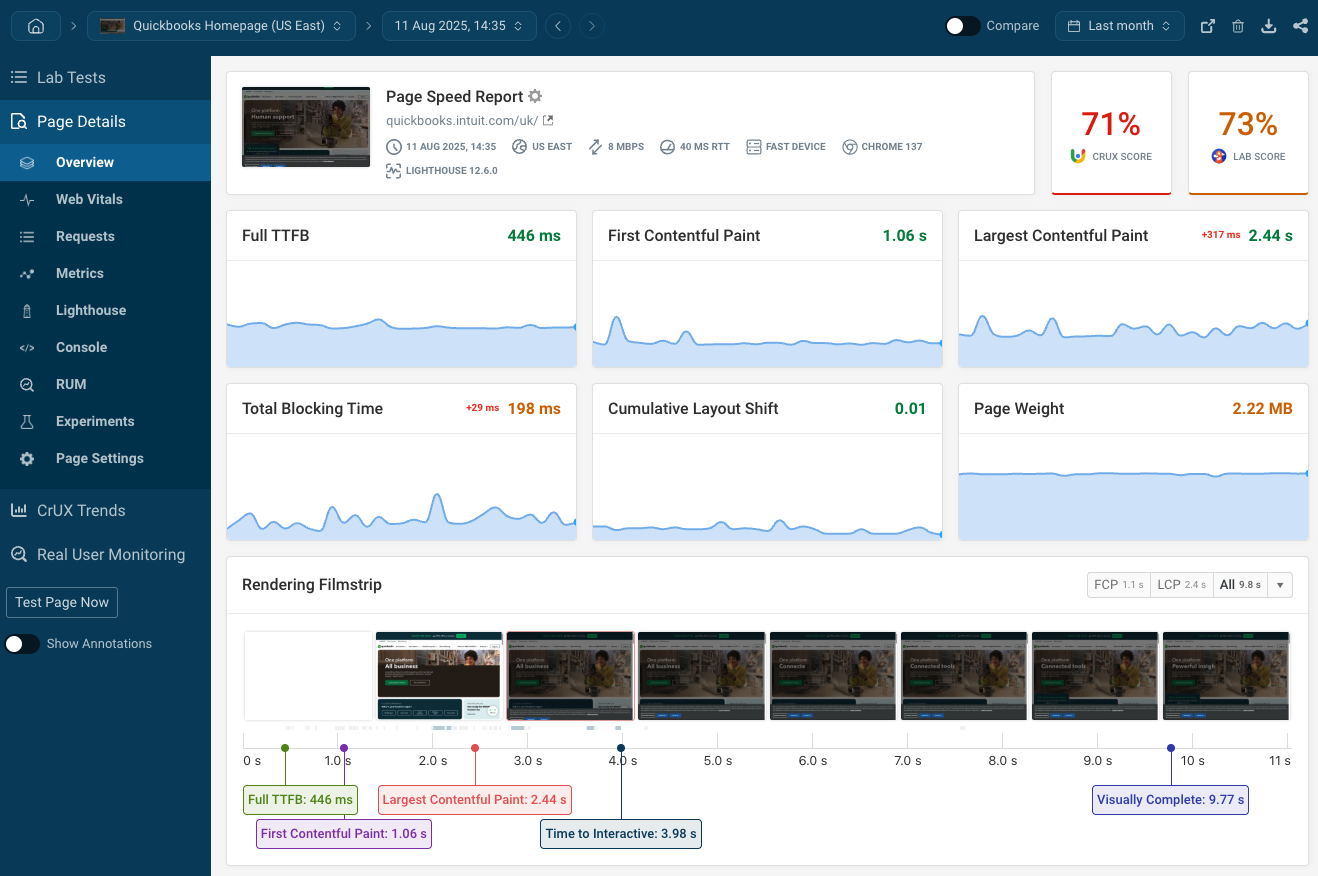
After setting up regular scheduled scans you can view page performance over time, as well as deep dive into additional data that's not part of the Lighthouse report:
- Network request waterfalls
- Custom performance recommendations
- Response size analysis for HTML and CSS files
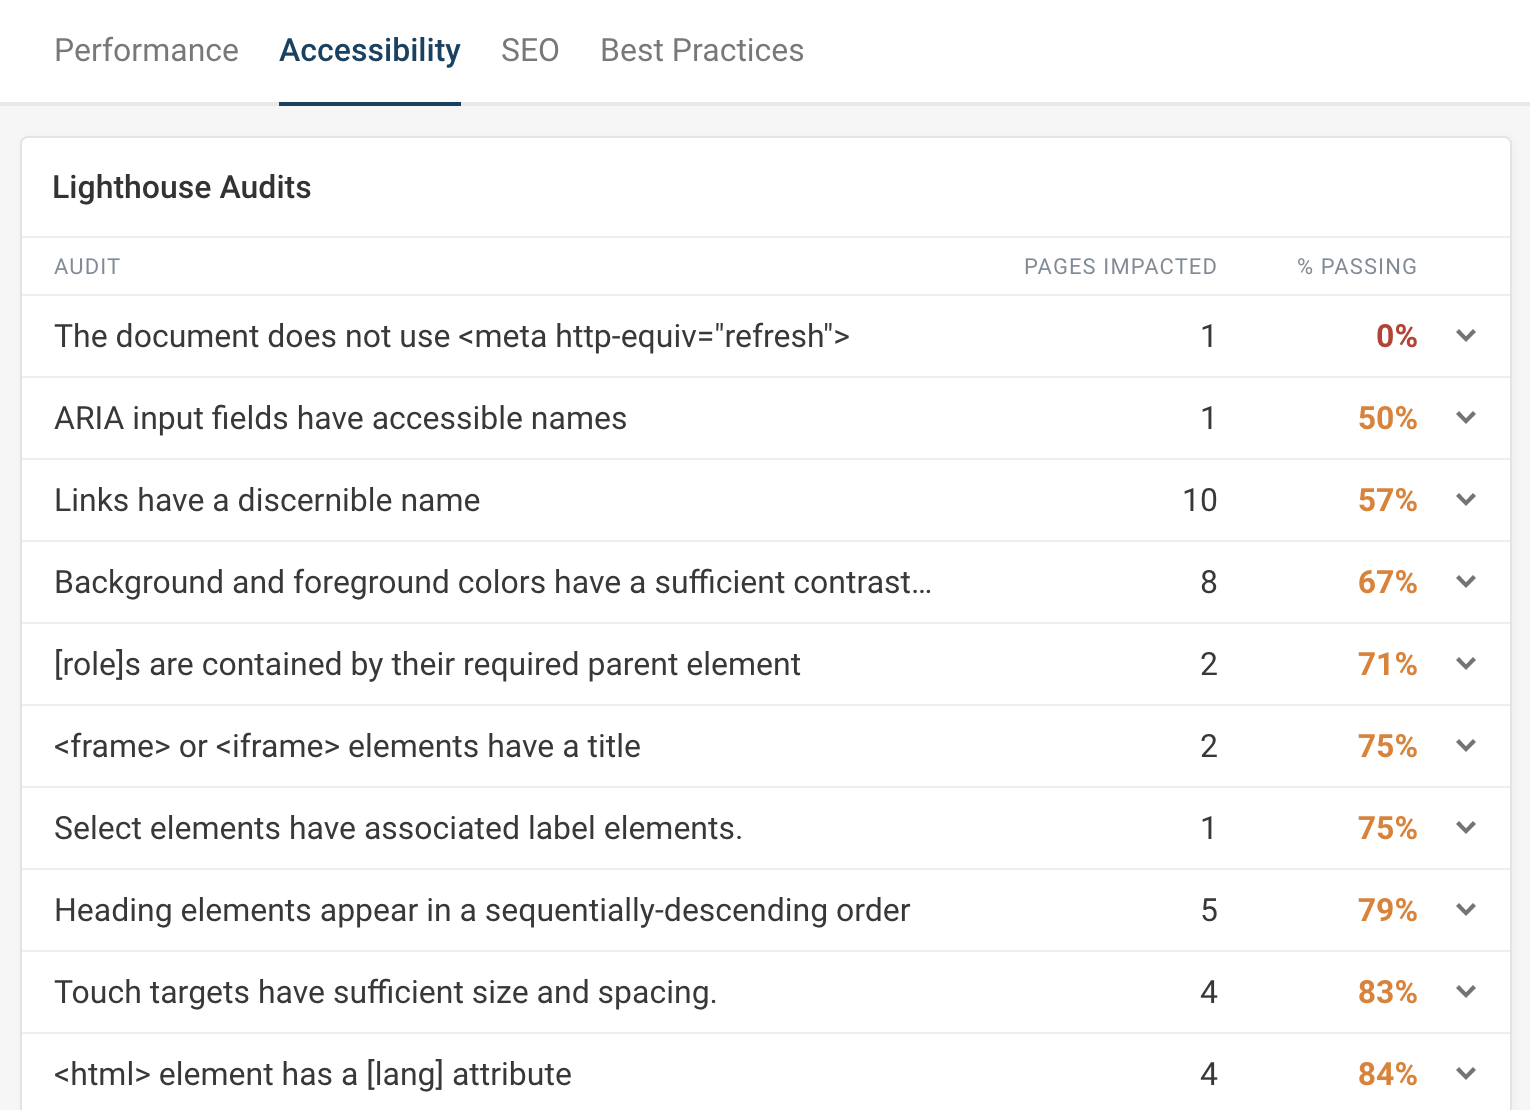
The audits dashboard shows you which Lighthouse audits are failing across your website.
You can then check what pages are impacted and review the specific recommendations for each issue.
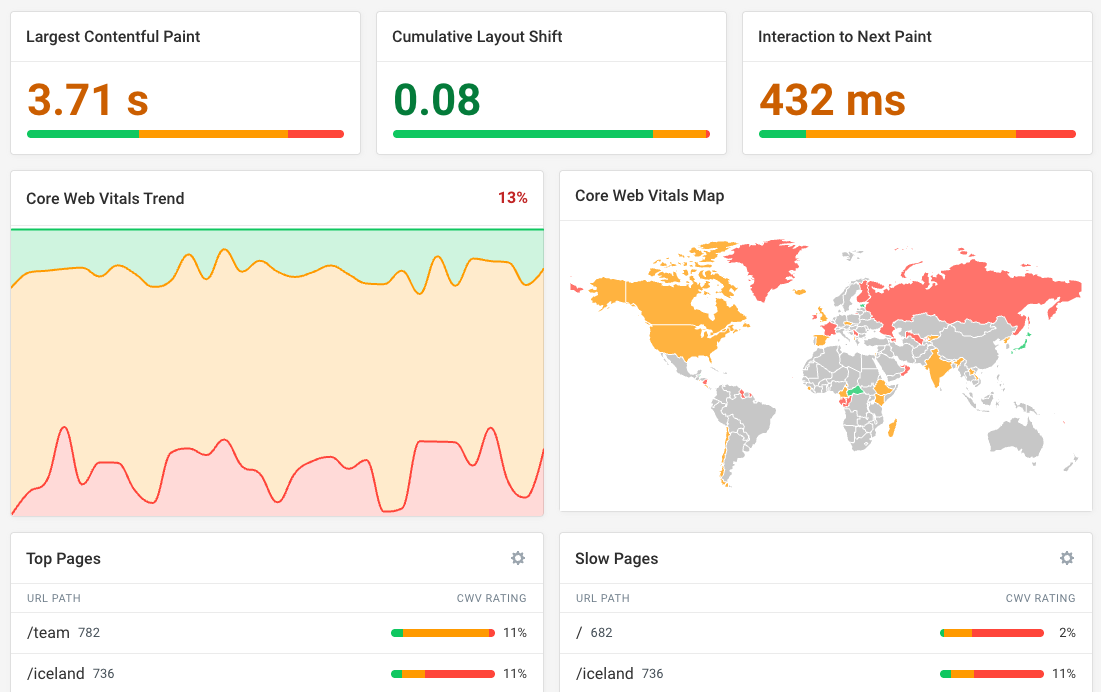
On top regular scheduled synthetic performance tests, DebugBear also includes real-user analytics to see how fast your website is for actual users, and what scripts and elements cause poor Interaction to Next Paint scores across your website.
Sign up for a free trial to get comprehensive performance insights for your website, share data with your team, and get regression alerts by email, in Slack, or in Microsoft Teams.


Monitor Page Speed & Core Web Vitals
DebugBear monitoring includes:
- In-depth Page Speed Reports
- Automated Recommendations
- Real User Analytics Data